3559
Assessment of Liver Function of HBV-induced Cirrhosis using T1 Mapping on Gd-EOB-DTPA-Enhanced MRI1Nantong Third People’s Hospital, Nantong University, Nantong, People's Republic of China, 2Philips Healthcare, Shanghai, People's Republic of China
Synopsis
The purpose of this study was to investigate the ability of T1 mapping on Gd-EOB-DTPA-enhanced MRI for the assessment of liver function of HBV-induced cirrhosis. We used Look-Locker sequences to acquire T1 mapping images pre and post-contrast at 5, 10, 15 and 20 minutes after Gd-EOB-DTPA administration, T1 relaxation times of the liver parenchyma were measured, reduction rates of T1 relaxation times between pre- and post-contrast enhancement were calculated, our study showed that Gd-EOB-DTPA-enhanced T1mapping MRI is useful for the evaluation of Liver function of HBV-induced cirrhosis.
INTRODUCTION
Assessment of hepatic functional plays a crucial role in selecting therapeutic approaches in patients with chronic liver disease especially liver tumors. Gadoxetic acid (Gd-EOB-DTPA) is a hepatocyte-specific contrast agent for MRI of the liver, uptake and metabolism of Gd-EOB-DTPA is related to hepatocyte function. The aim of this study was to investigate the ability of T1 mapping on Gd-EOB-DTPA-enhanced MRI for the assessment of liver function of HBV-induced cirrhosis.METHODS
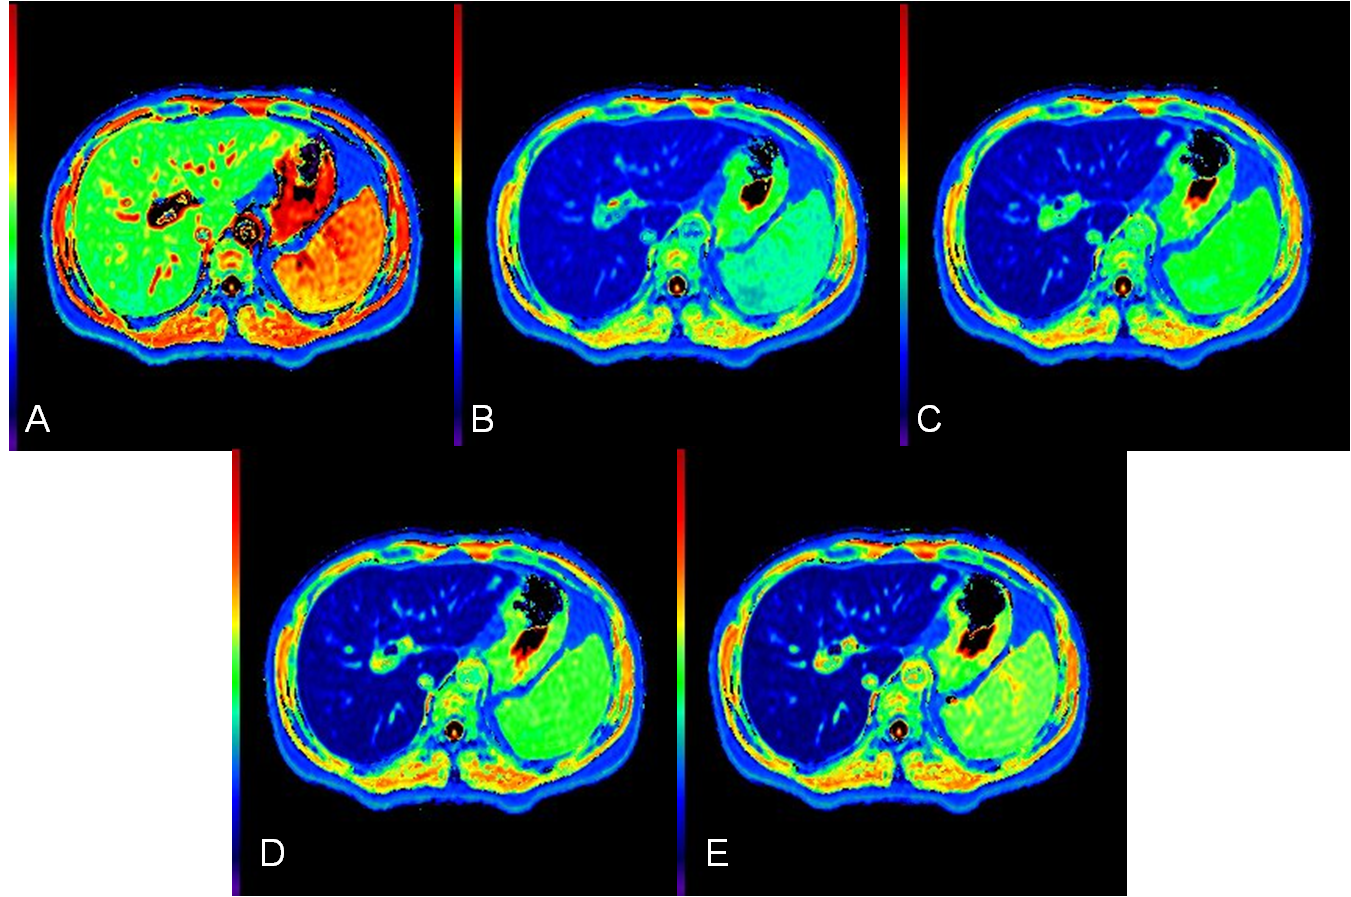
133 patients (83 Males, 50 Females; mean age 54.39±12.24 years) who underwent Gd-EOB-DTPA-enhanced MRI were classified in to 5 groups as follows: normal liver function (NLF), n=21; chronic hepatitis (CH), n=19; HBV-induced liver cirrhosis with Child-Pugh A (LCA), n=47; Child-Pugh B (LCB), n=37; Child-Pugh C (LCC), n=9. Look-Locker sequences with exactly the same scan parameters and geometry position (the level of porta hepatis) were performed pre and post-contrast separately at 5, 10, 15 and 20 minutes after Gd-EOB-DTPA administration.1 All the data were acquired on 3T Achieva MR System (Philips, Best, the Netherlands) with Torso-XL body coil. T1 relaxation times of the liver parenchyma were measured at all time points, four regions of interest(ROIs) were sparsely placed in both lobes of the liver, mean T1 relaxation times of the four ROIs were considered as the representative T1 relaxation time for the liver, reduction rates of T1 relaxation times between pre- and post-contrast enhancement were calculated as [(T1pre-T1post )/ T1pre*100%]. The one-way ANOVA was used to compare T1 relaxation times and reduction rates of T1 relaxation times at all time points for the 5 groups.RESULTS
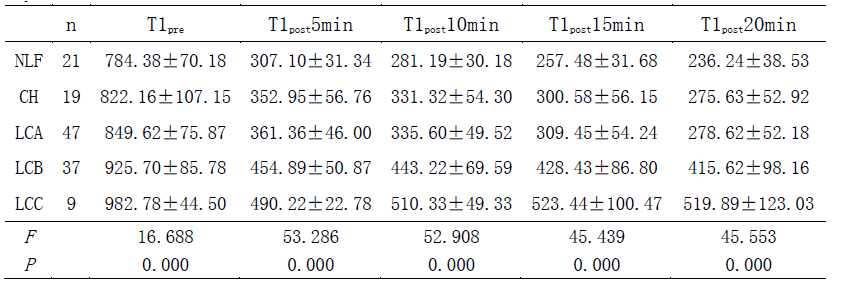
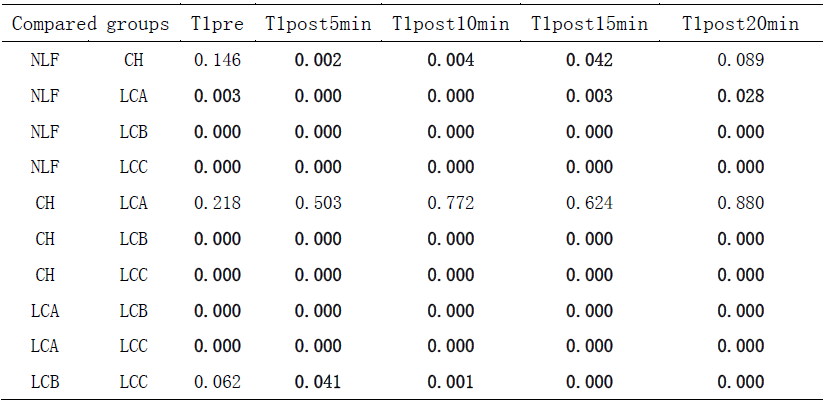
Liver T1 relaxation times before and after Gd-EOB-DTPA injection at 5, 10, 15 and 20 minutes were shown in table 1, comparisons of T1 relaxation times between different groups were shown in table 2.
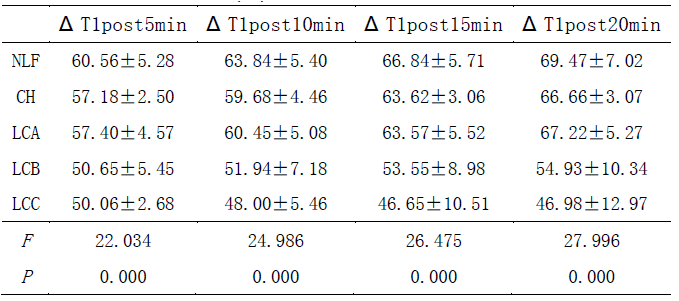
Reduction rates of T1 relaxation times of the liver were shown in table 3. Reduction rates of T1 relaxation times at 5 and 10 minutes were significant different (P<0.05) between any two groups except that between CH and LCA, LCB and LCC (P>0.05). Reduction rates of T1 relaxation times at 15 and 20 minutes were significant different (P<0.05) between any two groups except that between NLF and CH, NLF and LCA, CH and LCA (P>0.05).
DISCUSSION
Liver function can be evaluated by using T1 relaxation time of the liver parenchyma before and after Gd-EOB-DTPA enhancement. 1-3 In our study, T1 relaxation times progressively increased from NLF、CH、LCA、LCB to LCC both before and after Gd-EOB-DTPA injection at every time point. T1 relaxation times of NLF, CH, LCA and LCB reduced with the scanning time increasing, with the most drastic fall happening at 5min; T1 relaxation time of LCC increased from 5min to 15min after reduced at 5min, and then began to reduce at 20min, which might be due to insufficient uptake of Gd-EOB-DTPA with poor liver function. Therefore, the acquisition time needs to be extended for patients with poor liver function. Reduction rates of T1 relaxation times showed a constant decrease from NLF, CH, LCA, LCB to LCC at all time points, also reflected that the uptake of Gd-EOB-DTPA reduced with impaired liver function.CONCLUSION
Gd-EOB-DTPA-enhanced T1mapping MRI is useful for the evaluation of Liver function of HBV-induced cirrhosis.Acknowledgements
No acknowledgement found.References
[1] Katsube T , Okada M, Kumano S, et al. Estimation of liver function using T1mapping on Gd-EOB-DTPA-enhanced magnetic resonance imaging. Invest Radiol, 2011, 46(4): 277-283.
[2] Haimerl M, Verloh N, Zeman F, et al. Assessment of clinical signs of liver cirrhosis using T1 mapping on Gd-EOB-DTPA-enhanced 3T MRI. PLoS One, 2013, 8(12): e85658.
[3] Besa C, Bane O, Jajamovich G, et al. 3D T1 relaxometry pre and post gadoxetic acid injection for the Assessment of Liver Cirrhosis and Liver Function. Magn Reson Imaging, (2015), doi: 10.1016/j.mri.2015.06.013.
Figures