3558
Investigation of liver cirrhosis using 31P-MRS at 7T1OCMR, Department of Cardiovascular Medicine, University of Oxford, Oxford, United Kingdom, 2Translational Gastroenterology Unit, University of Oxford, Oxford, United Kingdom
Synopsis
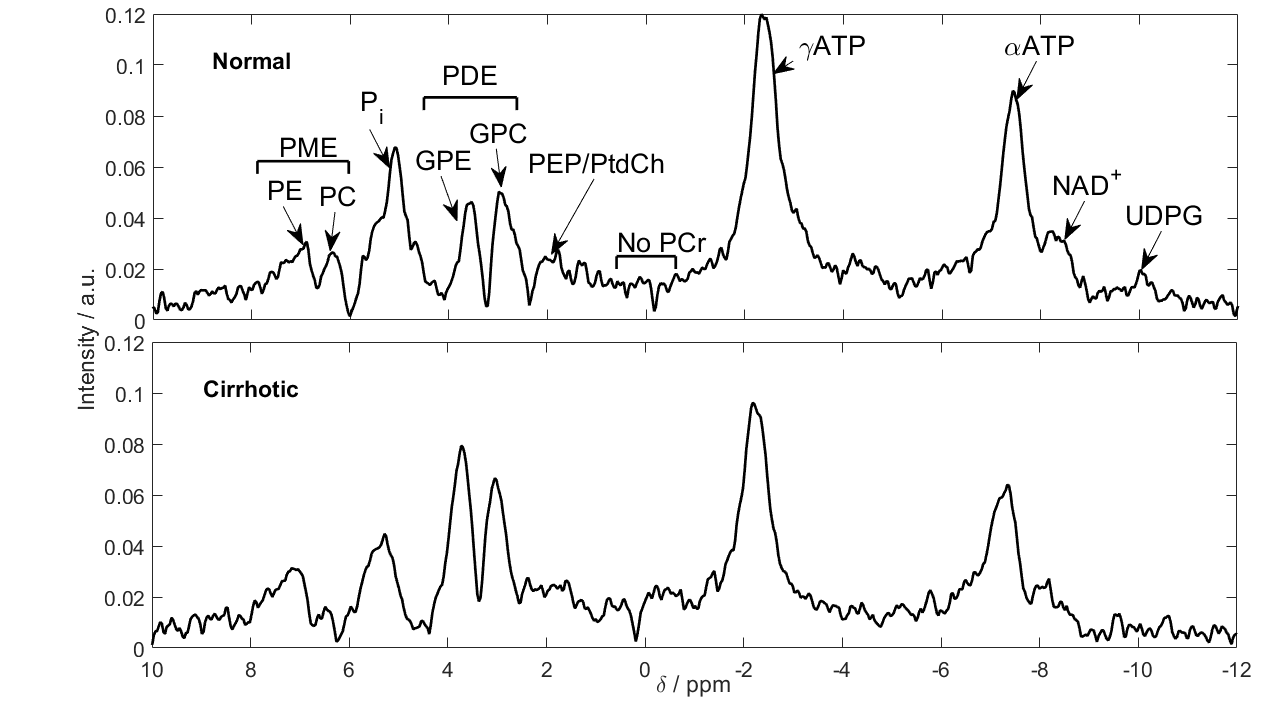
Phosphorus (31P) metabolites have potential value as markers in liver disease. The increase in field strength from 3 to 7T allows more accurate quantitation of the liver 31P-MRS spectrum. Ten volunteers and eleven patients with liver cirrhosis were scanned using a 16-channel array and a 3D UTE-CSI sequence. Metabolite concentrations were calculated using an endogenous 2.5mM ATP reference. Significant reductions in inorganic phosphate and phosphoenolpyruvate/phosphatidylcholine concentrations were seen, as well as an increase in glycerophosphoethanolamine (P<0.05). The splitting of PDE into its constituent peaks allows more insight into changes in metabolism.
Purpose
The burden of hepatic disease is increasing1. Phosphorus (31P) metabolites have potential value as markers for diseases including non-alcoholic fatty liver disease (NAFLD)2, and cirrhosis3. The increase in field strength from 3T to 7T increases SNR4 and allows increased spectral resolution5. In addition, using a 16-channel array at 7T increases the coverage and precision of metabolite peak fitting6. These allow more accurate quantitation of the liver 31P-MRS spectrum, especially the phosphodiester (PDE) region7. This study investigates the effect of this improved quantification on measuring metabolites in the cirrhotic liver.Methods
Ten volunteers (six male and four female, 27 ± 5 years, BMI 22.5 ± 1.5 kg.m-2) and eleven patients with cirrhosis of the liver (seven male and four female, 61 ± 6 years, BMI 29.5 ± 6.9 kg.m-2) were scanned supine after an overnight fast using a whole-body Siemens Magnetom 7T (Siemens Healthcare, Germany) and a 16-channel 31P receive array coil (Rapid Biomedical, Germany)8. The patients were recruited based on cirrhosis established using clinical, biochemical or radiological criteria. Five patients had been previously diagnosed with hepatitis C, three with non-alcoholic fatty liver disease, two with alcoholic steatohepatitis, and one with autoimmune hepatitis. Data were acquired as previously described6. In short, a 1s TR, UTE-CSI sequence was used to acquire a 16 × 16 × 8 matrix of liver spectra over a 270 x 240 x 200 mm3 field of view. Whitened singular value decomposition (WSVD)9 was used for channel combination. The CSI data were then analysed as previously described6, giving a mean and standard deviation for each subject. Concentrations were calculated using γ-ATP (adenosine triphosphate) as a 2.5mM endogenous reference10.Results
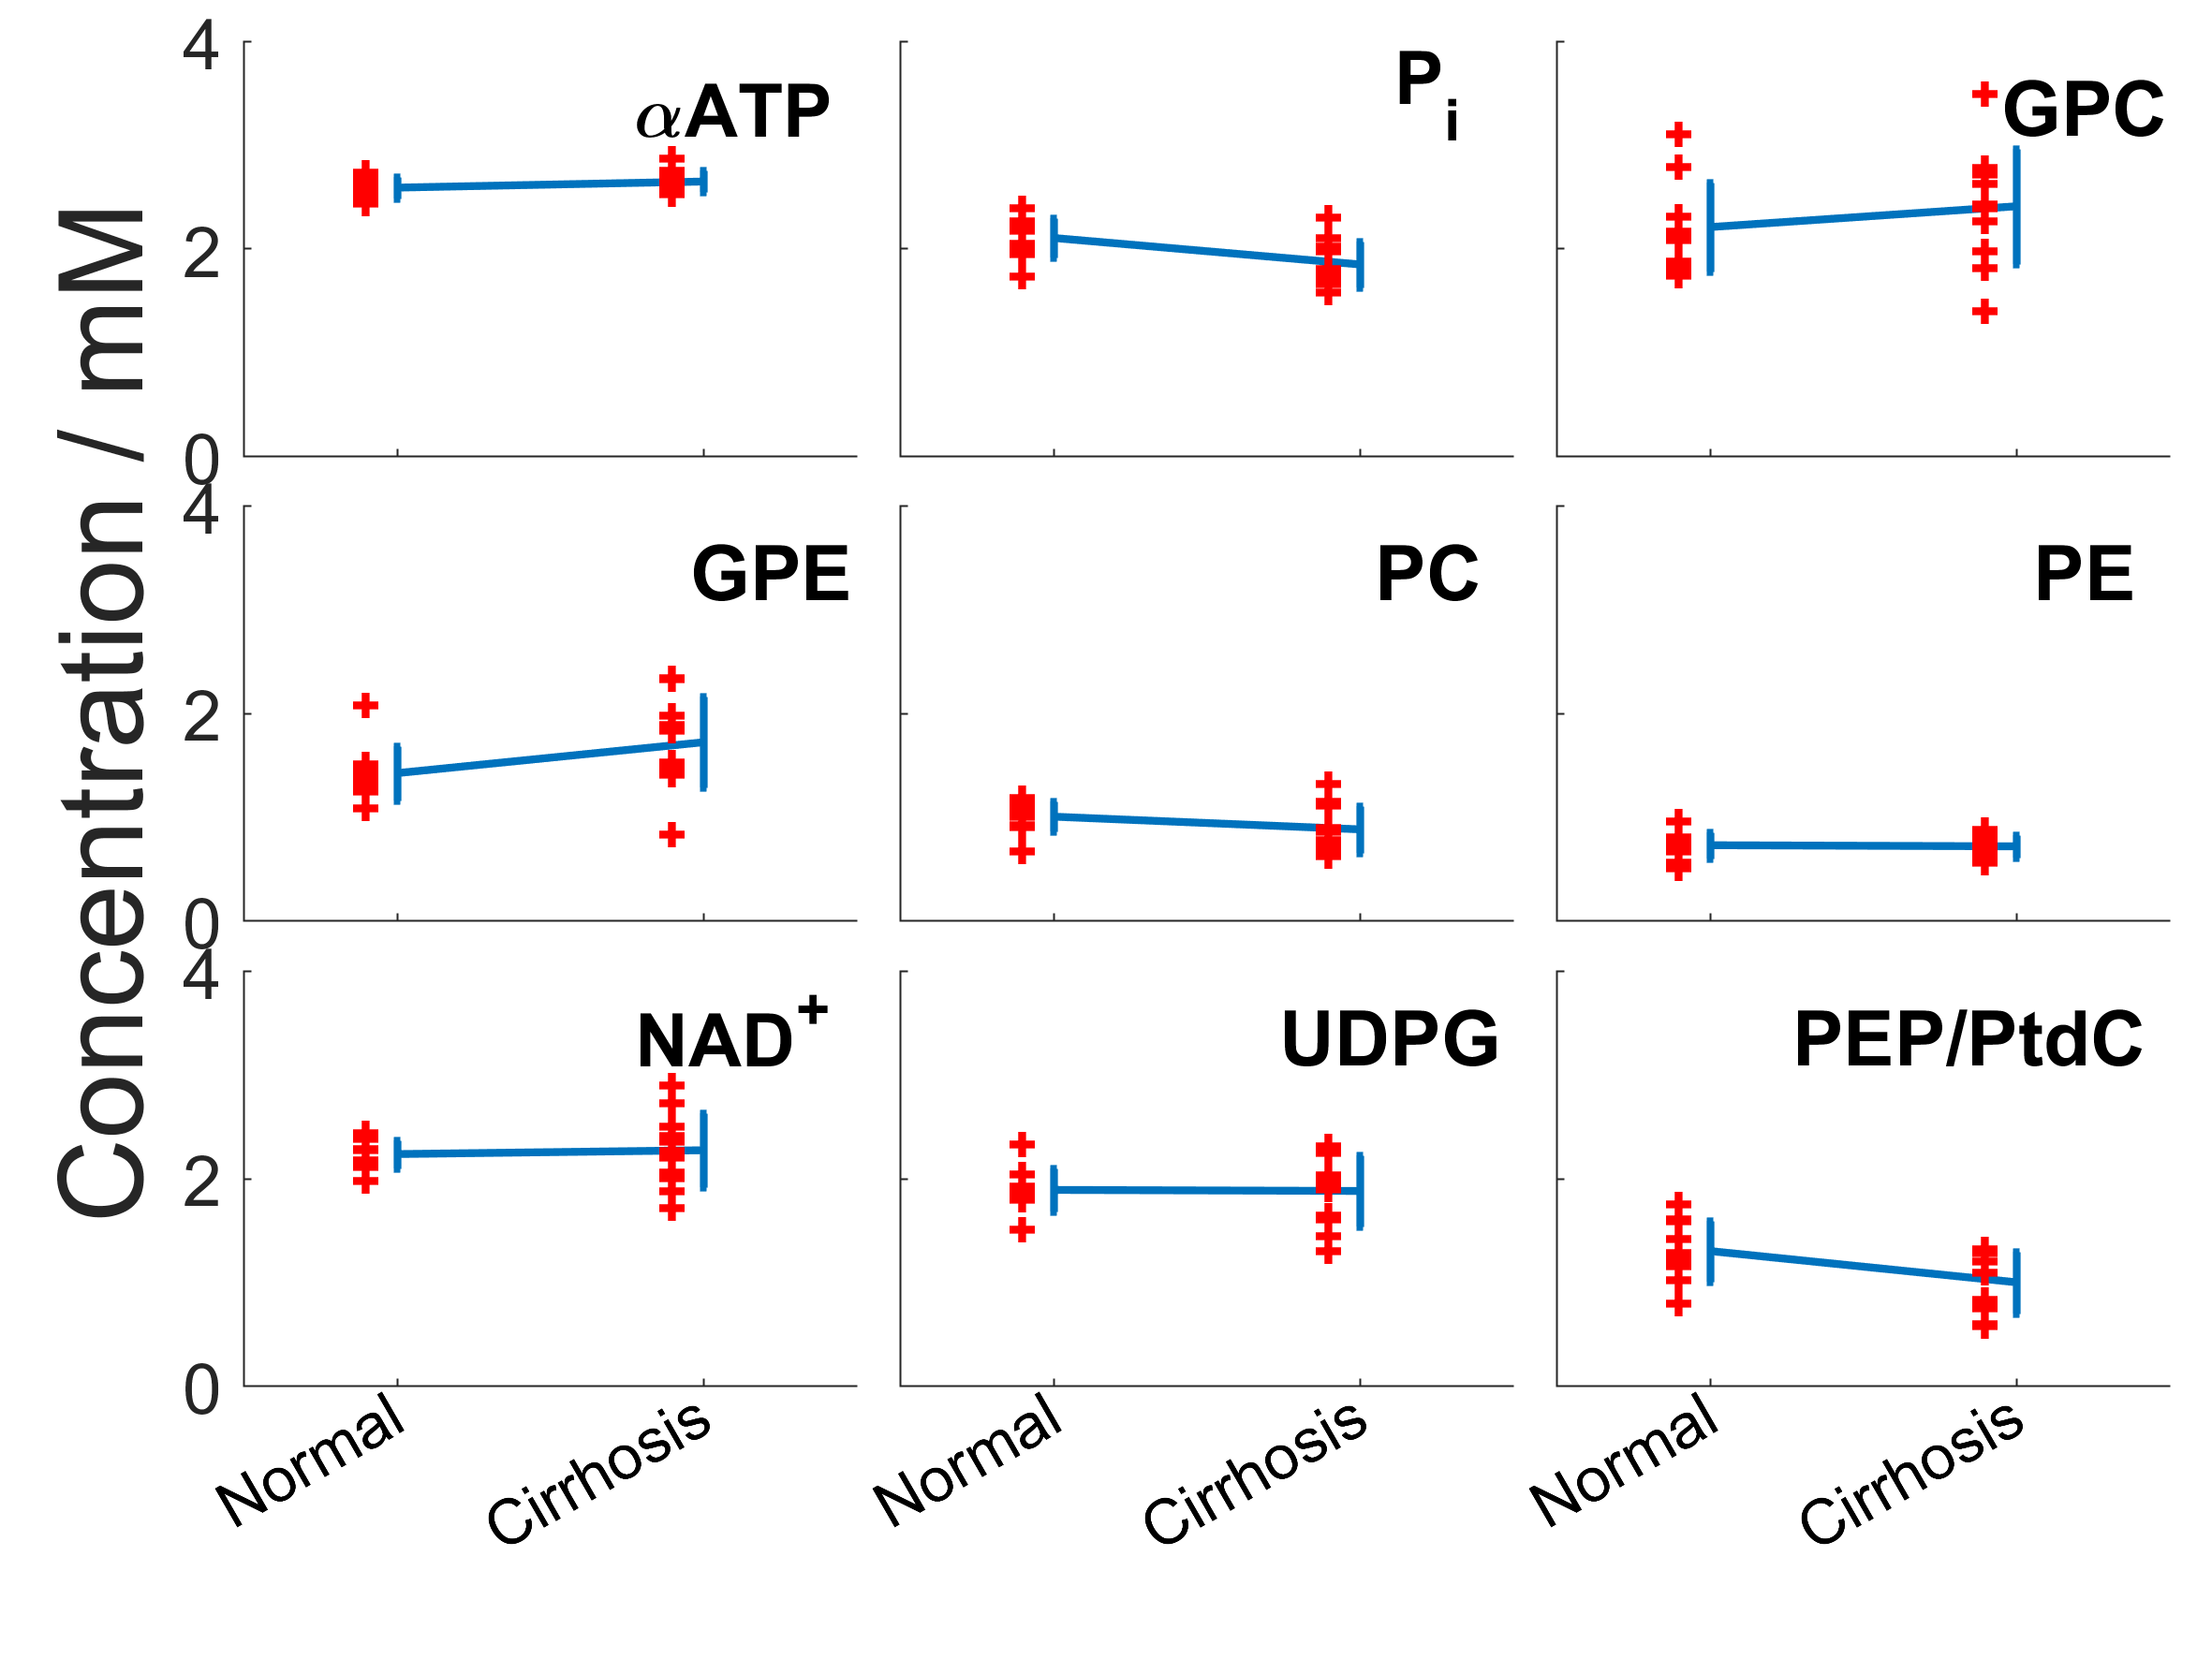
The average γ-ATP linewidth in cirrhosis was 43.25 ± 10.65Hz compared to 44.02 ± 18.86 Hz in normal volunteers. The average γ-ATP SNR was 19.58 ± 3.64 in cirrhosis compared to 20.77 ± 6.15. Average metabolite concentrations for both normal and cirrhotic livers are given in Table 1, and the concentrations for individual patients are given in Table 2 with their diagnoses. Figure 2 shows the concentrations for each volunteer and patient. There are significant reduction in inorganic phosphate (P = 0.005), and phosphoenolpyruvate/phosphatidylcholine (PEP/PtdC) concentrations (P = 0.016), and a trend to a reduction in phosphocholine (P = 0.08). There was a significant increase in glycerophosphoethanolamine concentrations (P = 0.04). Only nicotinamide dinucleotide has a significantly larger variance in patients than in healthy volunteers (F-test, P = 0.003). There was no significant difference in residual phosphocreatine signal.Discussion
The average γ-ATP linewidths indicates that the shim was also not significantly different from in healthy volunteers. Only nicotinamide dinucleotide has a significantly larger variance than in healthy volunteers (F-test, P = 0.003), and the residual phosphocreatine signal is not significantly higher. Our protocol is therefore still effective in patients with cirrhotic livers. We saw a significant 12% reduction in inorganic phosphate (P = 0.005), which agrees with the 18% change reported by Dezortova et al. in patients with cirrhosis3. A reduction in inorganic phosphate has been correlated with an increase in hepatic inflammation11. Dezortova et al. also found a significant 34% reduction in PDE, whereas we saw a significant 21% increase in GPE (P = 0.04). The two PDE metabolites are cell degradation products, so this study would indicate an increase in cell turnover rate, which has been previously found in hepatitis-C induced cirrhosis12. There are two contaminating factors in the PDE signal at low field strength: signal from the PEP/PtdC peak, and a broad underlying peak from phospholipids in the membrane7. The PEP/PtdC signal was reduced by 23% (P = 0.02). This signal reduction is likely due to a reduction of bile in the liver. The remaining change in PDE, and the increase in PME at 3T might be explained by a variation in the underlying phospholipid signal.Conclusion
We report comparable quality of data in patients with cirrhosis and in healthy volunteers. 7T 31P spectroscopy with a receive array is a powerful tool for studying metabolism in the diseased liver. A reduction in inorganic phosphate indicates an increase in inflammation in the cirrhotic liver. The splitting of PDE into its constituent peaks allows more insight into changes in metabolism.Acknowledgements
Funded by a Sir Henry Dale Fellowship from the Wellcome Trust and the Royal Society (Grant Number 098436/Z/12/Z). LABP has a DPhil studentship from the Medical Research Council (UK).References
1. Blachier M, et al. J Hepatol. 2013
2. Abrigo JM, et al. J Hepatol. 2014
3. Dezortova M, et al. World J Gastroenterol. 2005
4. Runge JH, et al. Magn Reson Imaging. 2016
5. Chmelik M, et al. NMR Biomed. 2014
6. Purvis LAB, et al. Proc. ISMRM p.0838, 2015
7. Purvis LAB, et al. Proc. ISMRM p.3691, 2016;
8. Rodgers CT, et al., Proc ISMRM p.2896, 2014;
9. Rodgers CT, Robson MD. Magn Reson Med. 2016
10. Sijens PE, et al. Magn Reson Imaging. 1998
11. van Wassenaer-van Hall HN, et al. Hepatology. 1995
12. Karidis NP, et al. Gastroenterology Research and Practice. 2015
Figures