3557
Cardiac-induced liver deformation as a measure of liver stiffness: normal volunteer reproducibility and post-prandial stress studies1UCL Centre for Medical Imaging, University College London, London, United Kingdom, 2Department of Medical Physicist, University College London Hospitals NHS Trust, London, United Kingdom, 3UCL Institute for Liver and Digestive Health, University College London, London, United Kingdom
Synopsis
Liver stiffness measured with elastography has useful clinical applications but requires the use of expensive, specialist equipment. In this study, we acquire dynamic ‘cine’ data of the liver to capture cardiac-induced liver motion during cardiac cine MRI. We quantify these data by applying a registration algorithm and use the deformation fields as a surrogate for liver stiffness. We demonstrate feasibility and good seven-day reproducibility and evaluate the effects of physiological haemodynamic changes using a liquid meal challenge. This technique would be widely applicable to hospital MRI scanners without elastography equipment.
Purpose:
MR elastography (MRE) liver stiffness (LS) measurements have delivered new insights into liver fibrosis and portal hypertension, but require a physical driver attached to the patient delivering stress to the patient’s upper abdomen for the duration of the scan1. In this study, we propose using previously validated software-quantified deformation2 to measure cardiac-induced liver motion observed within imaged portions of the liver on dynamic cardiac-gated cine-imaging through the left ventricular short-axis. We aim in this study to demonstrate the feasibility of liver deformation (LD) measurements, their seven-day reproducibility and the effects of hepatic haemodynamic changes using prandial stress in normal volunteers.Methods:
Healthy normal volunteers (n=9, mean age 28.3±1.4 years, n=3 female) were fasted for 6 hours before scanning. Imaging was performed using a 3.0T scanner (Achieva, Philips Healthcare, Best, Netherlands) with a 16 channel body coil (SENSE XL-Torso, Philips Healthcare, Best, Netherlands) and digital pulse oximetry.
LD measurement
Short-axis cardiac cine MRI studies were planned using coronal and long-axis images. Images were obtained in expiratory breath-hold, using a spoiled gradient echo sequence (TR/TE=3.4/1.7s, α=45°, 8 mm slice thickness, 256x256 matrix, FOV 320x320 mm, 30 cardiac cycle phases), gated to the pulse oximetry signal. Data was analysed using validated deformation analysis software GIQuantTM (Motilent, Ford, UK)2,3. A single short-axis slice was selected mid-way between the cardiac apex and mitral valve and a single ROI was placed on subdiaphragmatic hepatic parenchyma and propagated automatically to other frames within the slice cine-loop (figure 1). LD measured in arbitrary units (a.u.) was based on average pixel-wise deformation using the standard deviation over time of the pixel’s Jacobian determinant.
Hepatic haemodynamic assessment
Coronal images of the upper abdomen and with additional anatomical imaging parallel to the portal vein (PV) were used to plan phase-contrast MRI (PCMRI) studies through the PV. Expiratory breath-hold cardiac gated PCMRI studies (TR/TE=8.7/5.2s, α=10°, 5 mm slice thickness, 336x336 matrix, FOV 271x210 mm, 7 cardiac cycle phases), were performed in triplicate. Quantification was performed using Segment (Medviso, Lund, Sweden) and PV bulk flow measurements were normalised to segmented liver volume.
Post-prandial stress and reproducibility studies
For prandial stress studies (n=9), subjects were given 440 mls of oral Ensure Plus® (Abbot Laboratories, Illinois, USA) after the initial scan. Approximately 45-60 minutes after ingestion, the MRI protocol was repeated. For reproducibility studies (n=8), subjects were scanned in the fasted state using the same MRI protocol 7 days later.
Results:
Mean LD at baseline was (0.079±0.0073 a.u.). There was good seven day LD reproducibility (mean bias of -0.0043 a.u., Bland-Altman 95% Limits-of-Agreement ±0.028 a.u., figure 2a), with a positive correlation between repeated measurements (figure 2b).
Expected increases in PCMRI PV flow were observed post-prandially (fasting 53.88±4.74 ml/min/100g, post-prandially 107.5±4.01 ml/min/100g, p<0.0001, figure 3a). An increase in LD was observed post-prandially (fasting 0.075±0.0065 a.u., post-prandially 0.088±0.0087 a.u.), but this was difference was not significant (mean difference -0.013±0.0094 a.u., p=0.2046, figure 3b). A positive but non-significant correlation was demonstrated between post-prandial change in LD and post-prandial change in PCMRI PV flow (r=0.3595, p=0.3420, figure 4).
Discussion:
Previous approaches to measuring liver stiffness using cardiac motion have relied on more specialised magnetisation-tagged MRI sequences4-6. This is the first application of purely software-based quantification of deformation to assess of liver stiffness. LD measurements do not require an external driver or specialist sequences during data acquisition.
We have demonstrated that measurements in normal volunteers are reproducible, but expected post-prandial increases in LD were not observed. Previous MRE studies have shown significant increases in post-prandial liver stiffness and positive correlations between post-prandial changes in liver stiffness vs PCMRI PV flow (in patients but not in normal volunteers)7. LD measurements rely on uncontrolled (and variable) physical stress arising from cardiac motion. Differences in physical stress accounted for by changes in cardiac output following ingestion of a liquid meal could obscure changes in true liver stiffness. Additionally, capacity within intrahepatic venous vasculature could accommodate changes in portal venous flow with little effect of on tissue stiffness in healthy volunteers – post-prandial changes in liver stiffness in patients with diffuse liver disease are therefore likely to be more apparent.
Future work involves translating this method to patients with diffuse liver disease and using cardiac MR parameters to quantify myocardial external work to correct LD measurements. This is essential in liver disease, where cardiac dysfunction severity can vary significantly between patients.
Conclusion:
Liver deformation measurements are feasible and reproducible in normal volunteers. Despite significant increases in PV flow, no significant post-prandial changes in LD were observed.Acknowledgements
This work was supported by a Wellcome Trust Clinical Research Training Fellowship (grant WT092186), a National Institute for Health Research Clinical Lectureship and Senior Investigator award and the University College London Hospitals Biomedical Research Centre.References
1. Venkatesh SK, Yin M, Ehman RL. Magnetic resonance elastography of liver: technique, analysis, and clinical applications. Journal of magnetic resonance imaging : JMRI 2013;37(3):544-555.
2. Menys A, Taylor SA, Emmanuel A, et al. Global small bowel motility: assessment with dynamic MR imaging. Radiology 2013;269(2):443-450.
3. Odille F, Menys A, Ahmed A, Punwani S, Taylor SA, Atkinson D. Quantitative assessment of small bowel motility by nonrigid registration of dynamic MR images. Magnetic resonance in medicine : official journal of the Society of Magnetic Resonance in Medicine / Society of Magnetic Resonance in Medicine 2012;68(3):783-793.
4. Chung S, Kim KE, Park MS, Bhagavatula S, Babb J, Axel L. Liver stiffness assessment with tagged MRI of cardiac-induced liver motion in cirrhosis patients. Journal of magnetic resonance imaging : JMRI 2014;39(5):1301-1307.
5. Chung S, Breton E, Mannelli L, Axel L. Liver stiffness assessment by tagged MRI of cardiac-induced liver motion. Magnetic resonance in medicine : official journal of the Society of Magnetic Resonance in Medicine / Society of Magnetic Resonance in Medicine 2011;65(4):949-955.
6. Hotta N, Ayada M, Okumura A, et al. Noninvasive assessment of liver disease - measurement of hepatic fibrosis using tissue strain imaging. Clinical imaging 2007;31(2):87-92.
7. Jajamovich GH, Dyvorne H, Donnerhack C, Taouli B. Quantitative liver MRI combining phase contrast imaging, elastography, and DWI: assessment of reproducibility and postprandial effect at 3.0 T. PloS one 2014;9(5):e97355.
Figures
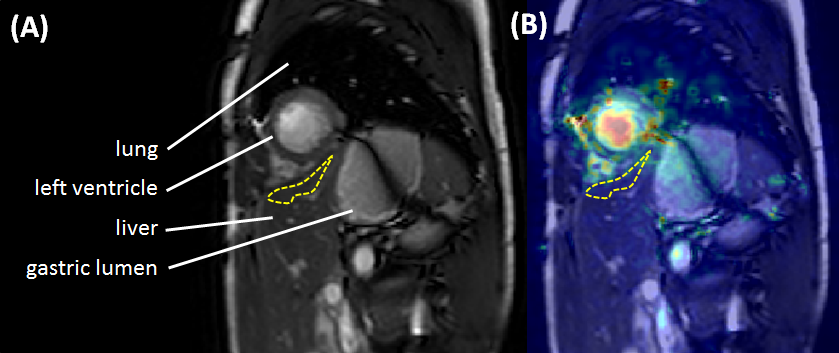
Figure 1: ROI placement for liver deformation measurements
(a) Short-axis cardiac cine MRI image selected mid-way between the cardiac apex and mitral valve. A ROI (yellow-dashed region) was positioned within subdiaphragmatic hepatic parenchyma near the heart, but with care to avoid any vessels or extra-hepatic tissues. The ROI was propagated automatically to other frames within the cine-loop. (b) demonstrates the overlaid deformation map. Note increased deformation within ventricular myocardium (overlaid yellow signal), but lower deformation away from the heart at the inferior margin of the image (overlaid blue signal).
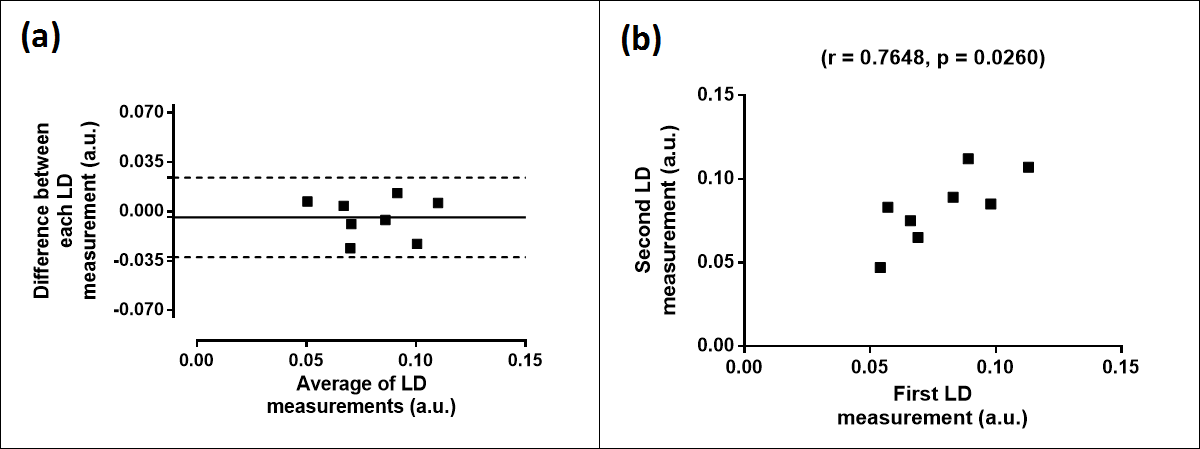
Figure 2: Liver deformation seven-day reproducibility
Data from normal volunteers, demonstrated ±0.028 a.u. Bland-Altman 95% Limits of Agreement (a). A strong and significant correlation between methods was demonstrated (b).
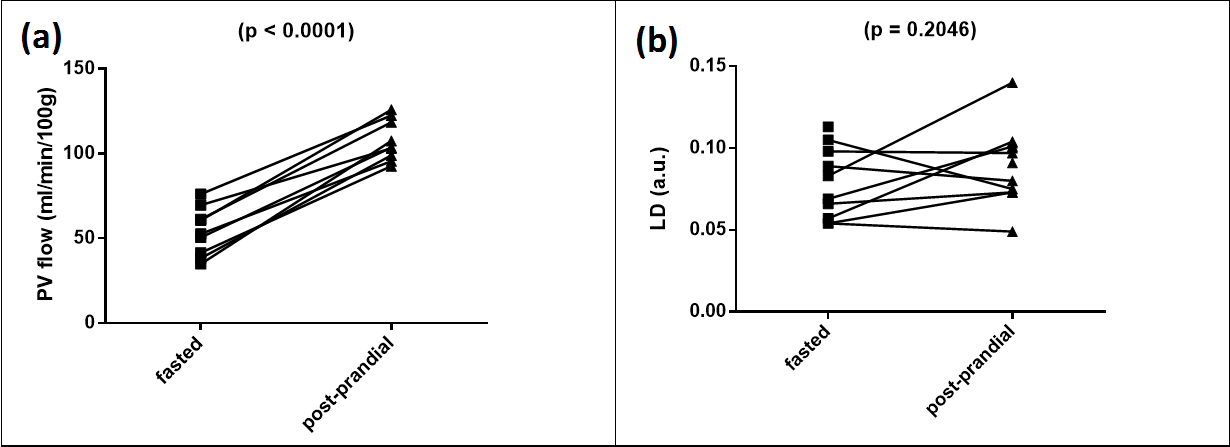
Figure 3: Hepatic haemodynamic stress
Hepatic haemodynamic stress was elicited using a liquid meal challenge. Significant increases in portal venous flow were observed post-prandially (a). Mean liver deformation increased post-prandially (b), but this difference was not significant.
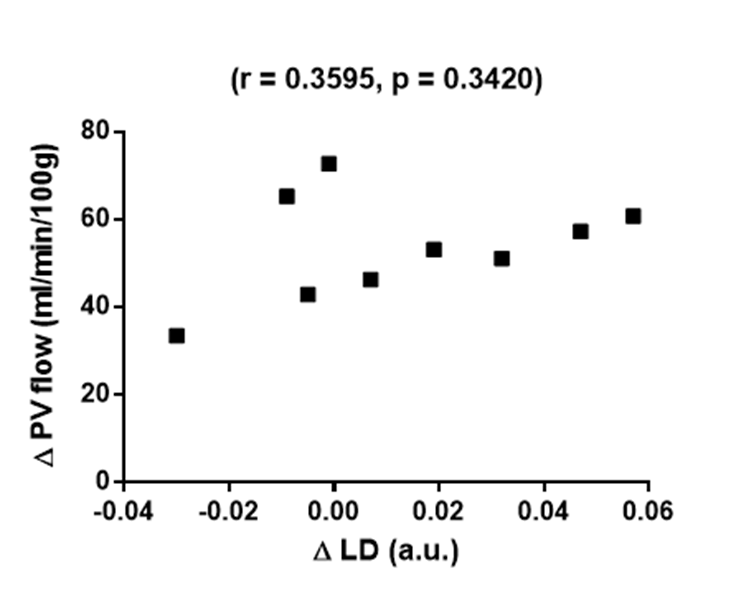
Figure 4: Post-prandial changes in liver deformation correlated with changes in portal venous flow
A positive but non-significant correlation was demonstrated (Δ change was calculated as 100*(postprandial – fasting/fasting)).