3556
Hepatocyte Fraction: Correlation with non-invasive liver functional biomarkers1Department of Radiology, Gifu University, Gifu, Japan, 2Philips Healthcare, Tokyo, Japan
Synopsis
The hepatocyte fraction (HeF) is based on simple pharmacokinetics and can quantitatively estimate the fraction of hepatocyte. In our study, the HeF, quantitative liver-to-spleen contrast ratio (Q-LSC), and delta T1 value were compared and correlated with Child-Pugh and MELD score. The HeF demonstrated the highest correlations with Child-Pugh score (r = -0.58, P < 0.0001) and MELD score (r = -0.57, P < 0.0001). The HeF could be a useful biomarker for the evaluation of liver function, compared to conventional imaging based quantitative methods.
Purpose
To evaluate the correlation between hepatocyte fraction (HeF) (1, 2) obtained from gadoxetic-acid-enhanced magnetic resonance (MR) imaging and clinical biomarkers for the assessment of liver function.Materials and Methods
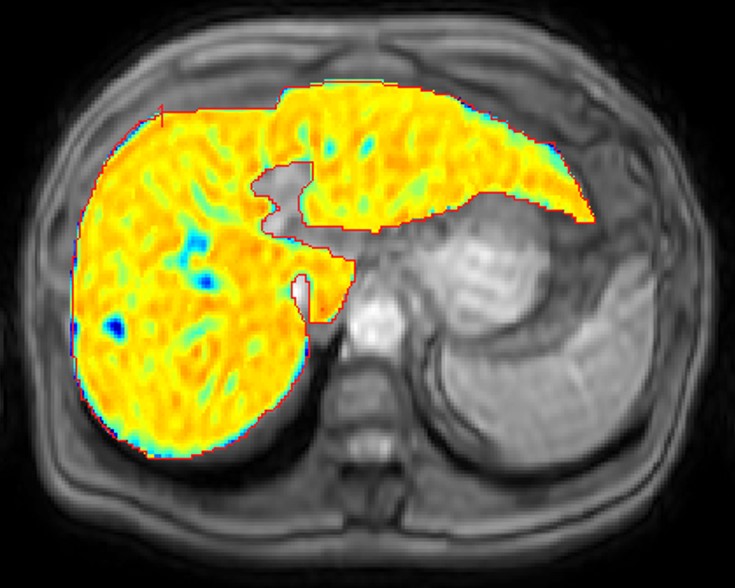
This prospective study was approved by our institutional review board and written informed consent was obtained. Forty-eight patients performed gadoxetic acid-enhanced MR imaging. The ΔR1 value of the liver was calculated as the difference between R1 values on pre and hepatobiliary phase (20 minutes after the administration). The T1 map was calculated from the Look-Locker sequence using the following scan parameters: T1-TFE, TE/TR = 1.7/5 msec, 1.32 × 1.32 × 8 mm, FA = 7, single-slice, shot interval = 5 sec, SENSE factor = 2, and scan time = 20 sec with breath holding. The proposed new model of the HeF was calculated from the ΔR1 values of the liver (extracellular space and hepatocytes) and spleen (extracellular space). The HeF was measured in the four hepatic segment using region-of-interest (ROI), carefully devoid of large vessels or bile ducts, focal lesions, and artifacts, and then averaged. The ratio of the signal intensities of the liver to the spleen measured on the hepatobiliary phase images was expressed as quantitative liver-to-spleen contrast ratio (Q-LSC). From the hospital information system matching with the time of MR imaging, we retrieved each patient’s laboratory and clinical data.
The Mann-Whitney U test was conducted to compare the Child-Pugh class with the HeF, Q-LSC, and ΔT1 value (the reduction rate of the T1 value between the pre- and post-contrast images), respectively. Receiver-operating-characteristic (ROC) analysis was conducted to determine the optimal threshold that yielded the maximal sensitivity and specificity for differentiating Child-Pugh class A and B. The HeF, Q-LSC, and ΔT1 value were compared with Child-Pugh score and end-stage liver disease (MELD) score. A P value < 0.05 was considered to be significant.
Results
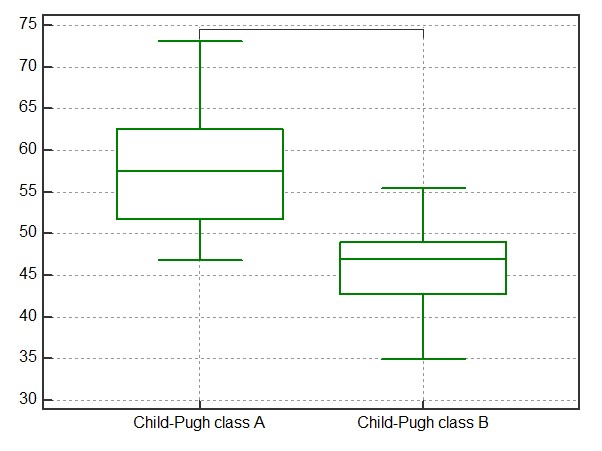
Among 48 patients, forty were in Child-Pugh class A and eight were in class B. The median HeF, Q-LSC, and ΔT1 value in patients with Child-Pugh class A were significantly higher than in those with class B (P = 0.0001, P = 0.0023, P = 0.015, respectively) (Figures 1–3). On the basis of the ROC analysis, the sensitivities, specificities, and area under the ROC curves for the differentiating Child-Pugh class A and B were 95.0%, 87.5%, and 0.93 in the HeF, 77.5%, 75.0%, and 0.78 in the Q-LSC, and 57.5%, 100.0%, and 0.84 in the ΔT1 value, respectively.
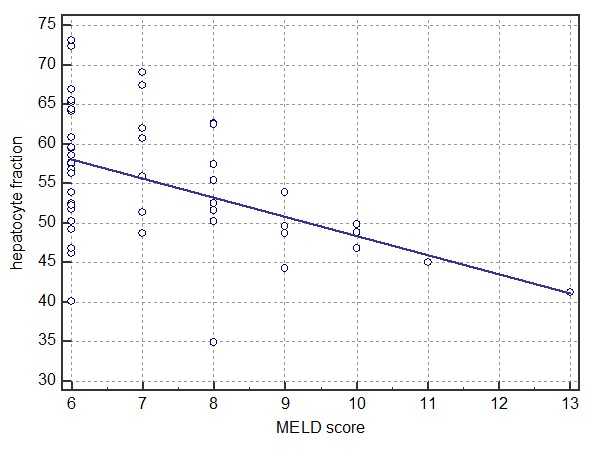
The HeF (r = -0.58, P < 0.0001), Q-LSC (r = -0.43, P = 0.0025), and ΔT1 value (r = -0.50, P = 0.0003) were significantly correlated with Child-Pugh score. HeF (r = -0.57, P < 0.0001), Q-LSC (r = -0.43, P = 0.0025), and ΔT1 value (r = -0.33, P = 0.023) were also significantly correlated with MELD score (Figures 4–5). HeF demonstrated the highest correlation for Child-Pugh and MELD score.
Discussion
Previous studies reported that some liver function indices could be obtained from MR imaging such as a relative contrast medium enhancement of liver and Q-LSC (3, 4). In particular, compared to other MR contrast agents, gadoxetic acid is known to be liver-specific and has been widely used for the detection and characterization of liver lesions (5). We tried a new method to assess the quantification of the HeF based on simple pharmacokinetics on gadoxetic acid-enhanced hepatobiliary phase image (6). The HeF is thought possibly to reflect the pure hepatocellular signal change between pre- and post-contrast hepatobiliary phase images, because the blood and extracellular extravascular space (EES) signals are normalized by the measurement of the ΔR1 of the spleen. We believe that HeF is feasible MRI biomarker for the assessment of liver function.
In conclusion, the HeF was well correlated with Child-Pugh and MELD score and could be a new biomarker to assess liver function.
Acknowledgements
We thank Eunju Kim for valuable help with the software supporting.References
1. Tomoyuki Okuaki, Kosuke Morita, Tomohiro Namimoto, et al. Assessment of the Hepatocyte Fraction for estimation of liver function. Proc Intl Soc Mag Reson Med 2015, p 384
2. Tomoyuki Okuaki, Kosuke Morita, Tomohiro Namimoto, et al. Comparison of the Hepatocyte Fraction and Conventional Image Based Methods for the Estimation of Liver Function. Proc Intl Soc Mag Reson Med 2016, p 165
3. Kubota K, Tamura T, Aoyama N, et al. Correlation of liver parenchymal gadolinium-ethoxybenzyl diethylenetriaminepentaacetic acid enhancement and liver function in humans with hepatocellular carcinoma. Oncol Lett. 2012;3(5):990-4.
4. Motosugi U, Ichikawa T, Sou H, et al. Liver parenchymal enhancement of hepatocyte-phase images in Gd-EOB-DTPA-enhanced MR imaging: which biological markers of the liver function affect the enhancement? J Magn Reson Imaging. 2009;30(5):1042-6.
5. Hammerstingl R, Huppertz A, Breuer J, et al. Diagnostic efficacy of gadoxetic acid (Primovist)-enhanced MRI and spiral CT for a therapeutic strategy: comparison with intraoperative and histopathologic findings in focal liver lesions. Eur Radiol. 2008;18(3):457-67.Dahlqvist Leinhard O,
6. Dahlstrom N, Kihlberg J, et al. Quantifying differences in hepatic uptake of the liver specific contrast agents Gd-EOB-DTPA and Gd-BOPTA: a pilot study. Eur Radiol. 2012;22(3):642-53.
Figures