3555
Splenic MR Elastography in Prediction of Hepatic Fibrosis Stage1Radiology, Chang-Hua Christian Hospital, Chang-Hua, Taiwan, 2Biomedical Imaging and Radiological Sciences, National Yang-Ming University, Taipei, Taiwan, 3Health Promotion Administration, Ministry of Health and Welfare, 4Biomedical Imaging and Radiological Sciences, National Yang-Ming University, Taipei
Synopsis
The purpose of our study was to investigate the relationship between splenic MR elastography (MRE) and liver fibrosis stages. 109 patients underwent histological examination and abdominal MR examination within 3-months interval were enrolled in our study. MRE was performed with passive driver on right and left chest wall separately. The mean stiffness value of liver and spleen was determined and showed good correlation between hepatic/splenic stiffness and liver fibrosis stage. Our results demonstrated that spleen stiffness measured by MRE was significant correlated with liver fibrosis stage. Combination of the spleen/liver stiffness provide higher diagnostic value than liver stiffness alone.
Aim
Splenomegaly is a common complication in patients with liver fibrosis and cirrhosis and portal congestion, tissue hyperplasia and fibrosis are the main factors to increase the spleen size. The purpose of our study was to investigate the relationship between splenic MR elastography (MRE) and liver fibrosis stages.Materials and Methods
This retrospective study was approved and the informed consent was waived by our institutional review board. Finally, 109 patients (16 healthy living donors, 93 patients with chronic liver disease) underwent histological examination and abdominal MR examination within 3-months interval were enrolled. All MRE images were obtained from a 1.5 Tesla scanner using a 16-channel phased array body coil. Two passive drivers were placed on patient’s right and left chest wall at the level of xiphoid simultaneously and imaging scan were performed separately. Continuous vibration waves of 60Hz were generated by active driver and the 2D gradient echo MR elastography was performed. A confidence map was created automatically. Five elastogram of liver and three elastogram of spleen for each patient were obtained. One radiologist who was blinded to patients’ clinical information and pathological results performed the quantitative analyses of all images on workstation. The stiffness was calculated using the ROI (region of interesting) manually drawn on each elastogram with confidence mask. The ROI should be greater than 200 mm2 and avoid major blood vessels, obvious wave disturbance districts, and tumors. The mean stiffness value of liver and spleen was determined as follow: mean stiffness value =Σ stiffness value x ROI area/Σ ROI area. All liver specimens were evaluated by one pathologist who was blinded to the patients’ clinical information and MRE results using METAVIR system (F0~F40). Fibrosis stage of F3 or higher was consider to be advanced liver fibrosis.Results
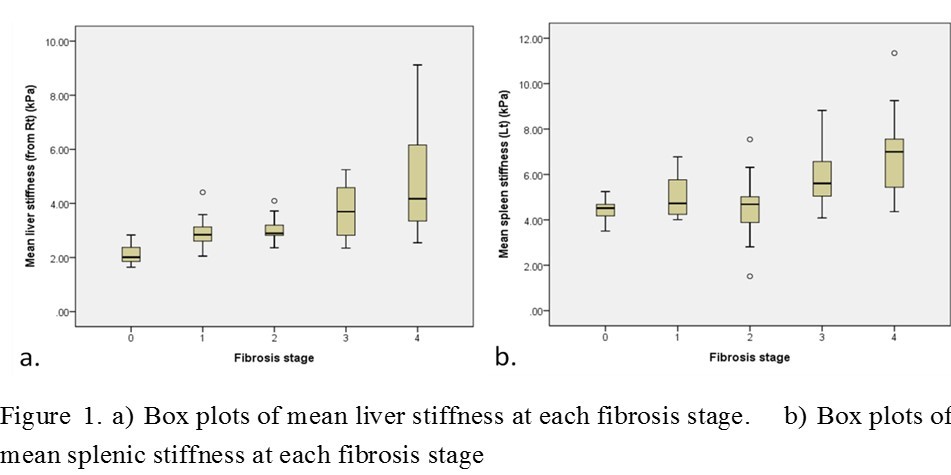
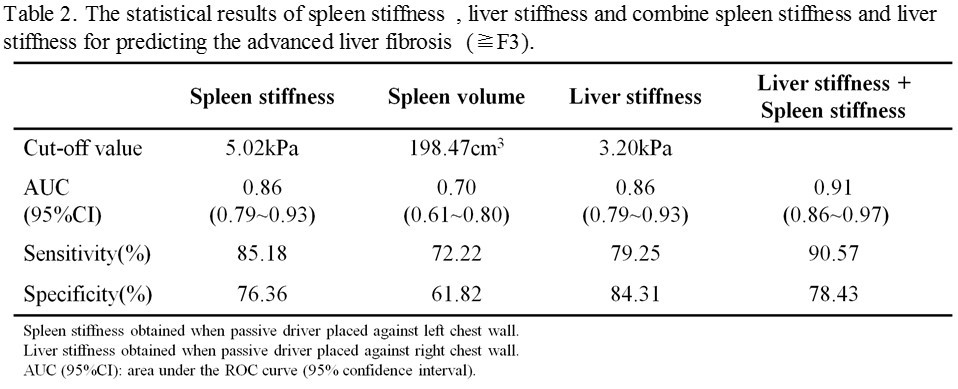
The liver and splenic stiffness values obtained when passive driver placed at right and left location are shown on Figure 1. The correlation of liver and spleen stiffness with fibrosis stages were depicted on Figure 2. Using Spearman’ rank test, the correlation coefficient with passive driver against right chest wall (γ=0.72) was better than driver on left chest wall (γ=0.62) between the liver stiffness measurement and the fibrosis stages. According to our results, the passive driver should be placed near the target organ. The spleen stiffness with passive driver on left chest wall showed good correlation with liver fibrosis stages (p<0.001). As 109 patients were divided into two subgroups: 55 patients with F0, F1 and F2l, and 54 patients with F3 and F4 (advanced liver fibrosis). The diagnostic performances of the liver stiffness, spleen stiffness, and combination of the liver/splenic stiffness in prediction of advanced liver fibrosis were shown on Figure 3. The combination of spleen/liver stiffness value in detecting advanced liver fibrosis showed highest diagnostic value.Discussions
The results of our study indicate that the spleen stiffness obtained with the passive driver placed on left chest wall was significantly correlated with liver fibrosis stages (p<0.001). Our results agreed with Jayant et al. study [1]. However, the correlation between hepatic fibrosis and splenic stiffness with passive driver on left chest wall was higher than passive driver on right chest wall. According to our results, the passive driver should place on left chest wall instead of right chest wall for patients underwent splenic MR elastography. In prediction of hepatic fibrosis stage, the combination of splenic and hepatic stiffness provided higher diagnostic value than hepatic stiffness alone. One possible reason was that portal pressure was one of factors in hepatic stiffness measurement for patients underwent MR elastography. Previous studies have been reported that portal pressure, splenic volume, gastroesophageal varices were associated with splenic stiffness [2].Conclusion
Our results demonstrated that spleen stiffness measured by MRE was significant correlated with liver fibrosis stage. Combination of the spleen/liver stiffness provide higher diagnostic value than liver stiffness alone.Acknowledgements
No acknowledgement found.References
1 Talwalkar JA, Yin M, Venkatesh S, et al. Feasibility of in vivo MR elastographic splenic stiffness measurements in the assessment of portal hypertension. AJR Am J Roentgenol 2009;193(1):122-7.
2. Shin SU, Lee JM, Yu MH, et al. Prediction of esophageal varices in patients with cirrhosis: usefulness of three-dimensional MR elastography with echo-planar imaging technique. Radiology 2014;272(1):143-53.
Figures