3552
Gadoxetate-disodium-enhanced T1-weighted R2* Mapping Improves Visualization of Biliary Anatomy in Liver Donor Candidates1Liver Imaging Group, Department of Radiology, University of California San Diego, San Diego, CA, United States, 2Dimagem Diagnóstico por Imagem, Rio de Janeiro, Brazil, 3Department of Surgery, University of California San Diego, San Diego, CA, United States
Synopsis
Gadoxetate-disodium (Gd-EOB-DTPA)-enhanced 3D T1- weighted (T1W) MR cholangiography (MRC) is recognized as an efficient method for evaluation of biliary anatomy, which is critical in the preoperative evaluation of living liver donors. We hypothesize that bile duct visualization could be improved by acquiring Gd-EOB-DTPA-enhanced T1W multi-echo (ME) gradient-echo (GRE) images and generating parametric R2* map cholangiograms. In 10 liver donor candidates, we retrospectively compared biliary duct visualization on T1W-R2* maps vs. 3D T1W cholangiograms obtained 20 minutes after IV administration of gadoxetate disodium. T1W-R2* maps provided comparable visualization of the first-order bile duct branches and better visualization of the second-order branches (p<0.05).
Introduction
Several variations in the anatomy of the intrahepatic bile ducts have been described 1. Thus, evaluation of biliary anatomy and detection of normal variants is critical in the preoperative evaluation of living liver donors to minimize postoperative complications 2. Traditionally, the standard MR examination for defining biliary anatomy has been 2D T2-weighted (T2W) MR cholangiography (MRC). Although T2W MRC has a high sensitivity and specificity for detection of bile duct dilatation and strictures, it has limitations in the visualization of non-dilated ducts 3. Recently, 3D T1- weighted (T1W) MRC after intravenous administration of gadoxetate disodium (Gd-EOB-DTPA) has been proposed as an efficient method for preoperative evaluation of living liver donor’s biliary anatomy 4. The rationale is that the excreted Gd-EOB-DTPA shortens the T1 of bile making it appear hyperintense on T1W images. Gd-EOB-DTPA also shortens T2*, however, which may partially mitigate the benefits of T1 shortening. We hypothesize that bile duct visualization could be improved by acquiring Gd-EOB-DTPA-enhanced T1W multi-echo (ME) gradient-echo (GRE) images and generating parametric T1W-R2* map cholangiograms. The rationale is that such maps would generate high bile to liver contrast by combining the contrast effects of T1 and T2* shortening 5. The purpose of this pilot study was to compare bile duct visualization using R2* map cholangiograms versus T1W MRC in liver donor candidates.Methods
Potential liver donor candidates referred for pre-transplant evaluation with 3T MRI from 2013-2016 were included in our study. Approximately 20 minutes after Gd-EOB-DTPA injection, 3D T1W GRE and 2D T1W ME GRE images were acquired. T1W R2* maps were generated inline by the scanner computer assuming exponential decay. For evaluation of the biliary system, the 3D T1W and R2* map cholangiograms were retrospectively reviewed by three radiologists (with different levels of experience in liver imaging) independently. Visualization of each of the following bile duct segments were scored individually on a 4-point ordinal scale: common, right, and left hepatic, right anterior and posterior, and segment 2, 3, and 4 ducts. Segmental duct visualization scores for each method were compared (Mann-Whitney test). Intraclass correlation coefficients (ICCs) were estimated to assess inter-reader agreement for biliary tract visualization.Results
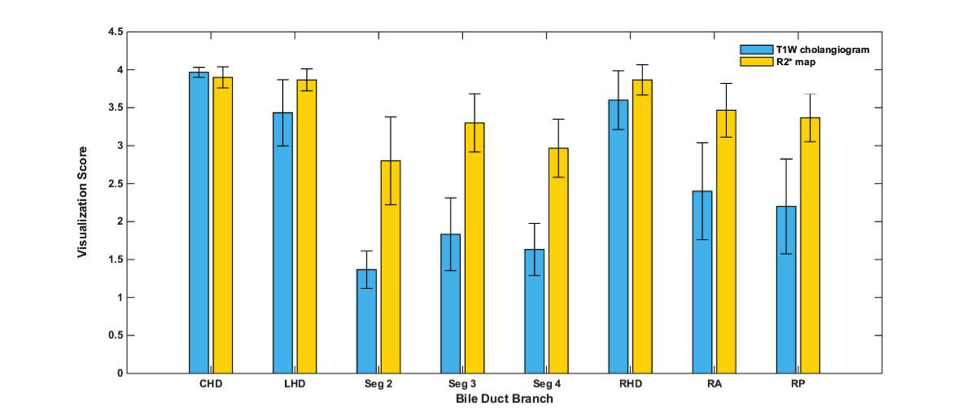
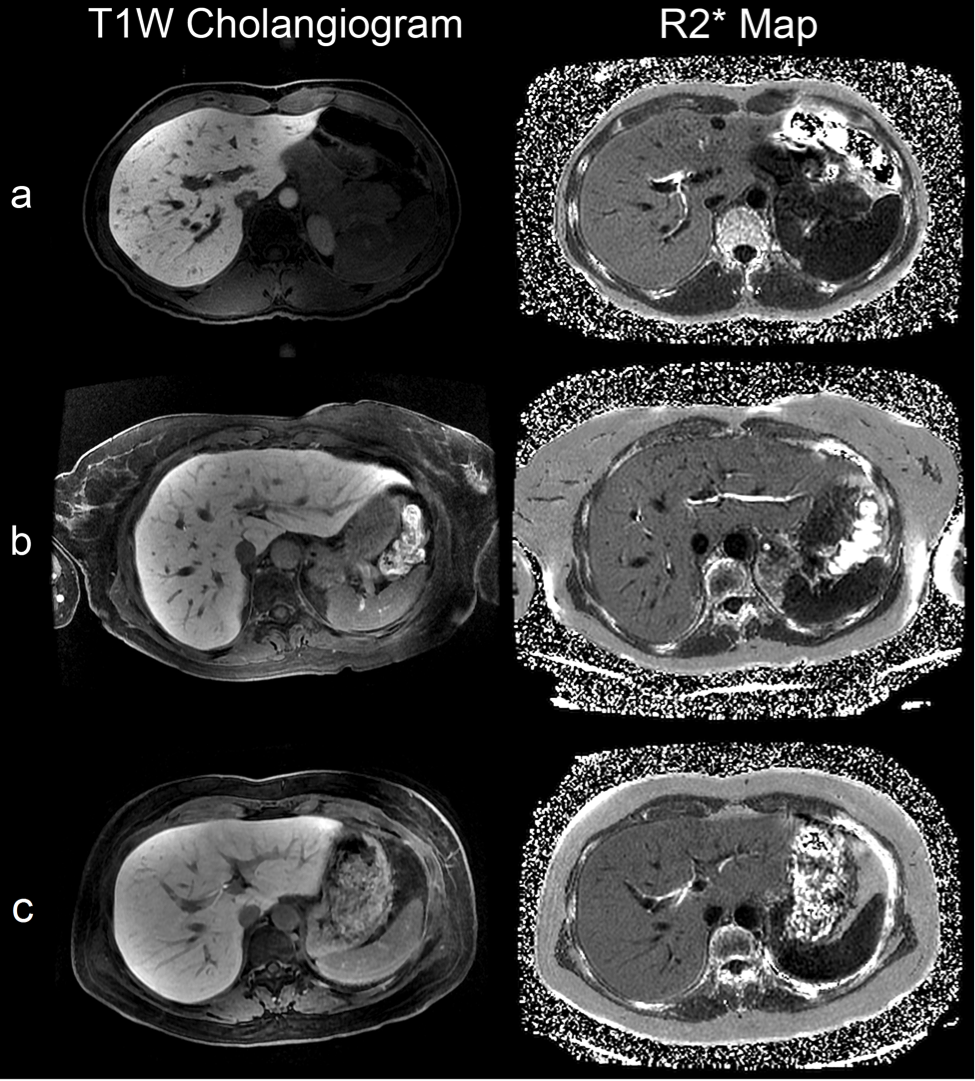
10 consecutive potential living donors were included. Figure 1 illustrates overall mean visualization scores of each bile duct segment for 3D T1W and R2* map cholangiograms. For all readers, visualization scores of T1W-R2* maps were significantly higher than those of 3D T1W cholangiograms for right anterior (p<0.05), segment 2 (p<0.01), segment 3 (p<0.05), and segment 4 (p<0.01) ducts. Although right posterior duct had a higher visualization score on R2* maps among all readers, the difference was only significant for reader 1 and 2. For visualization of the common, right, and left hepatic ducts, there was no significant difference between the two methods. ICCs were 0.98 for 3D T1W MRCs and 0.83 for T1W-R2* maps. Figure 2 illustrates T1W cholangiograms and T1W-R2* maps of selected liver donors. Conclusion
Our pilot study provides proof of concept that Gd-EOB-DTPA-enhanced T1W-R2* mapping improves visualization of biliary anatomy in potential liver donors than T1W MRC, even though the applied sequence was not designed for high-resolution biliary imaging. Acknowledgements
No acknowledgement found.References
1. Choi JW, Kim TK, Kim KW, et al. Anatomic variation in intrahepatic bile ducts: an analysis of intraoperative cholangiograms in 300 consecutive donors for living donor liver transplantation. Korean J Radiol. 2003;4(2):85-90.
2. Cheng YF, Huang TL, Chen CL, Chen YS, Lee TY. Variants of the intrahepatic bile ducts: application in living-related liver transplantation and splitting liver transplantation. Clin Transplant. 1997;11:337-340.
3. Lim JS, Kim MJ, Myoung S, et al. MR cholangiography for evaluation of hilar branching anatomy in transplantation of the right hepatic lobe from a living donor. AJR. 2008;191:537–545.
4. Mangold S, Bretschneider C, Fenchel M, et al. MRI for evaluation of potential living liver donors: a new approach including contrast-enhanced magnetic resonance cholangiography. Abdom Imaging. 2012;37(2):244-51.
5. Hernando D, Levin YS, Sirlin CB, Reeder SB. Quantification of liver iron with MRI: state of the art and remaining challenges. J Magn Reson Imaging. 2014;40(5):1003-21.
Figures