3543
Comparing liver fat quantification obtained with Complex Chemical Shift-Encoded MRI and Conventional method in an oncologic population sample.1Radiology, Memorial Sloan Kettering Cancer Center, New York, NY, United States
Synopsis
Chemotherapy is hepatotoxic. Since steatosis is an early sign of hepatotoxicity, an accurate estimation of the changing of fat liver concentration would be useful in the management of oncologic patients. The purpose of this study was to compare fat liver concentration estimated by T1-weightened-in-and-out-of-phase (IOP) imaging with the one obtained by IDEAL-IQ method in an oncologic patients population with unknown liver iron concentration. A statistical difference was demonstrated between fat fraction estimated with conventional IOP imaging and IDEAL-IQ method.
Purpose
Chemotherapy is toxic to the liver (1). Since liver is the major organ responsible for metabolism of chemotherapeutic drugs an imaging method of early recognition of hepatotoxicity may be useful in an oncologic patient population. An early sign of hepatotoxicity is fat globules accumulation in hepatocytes which lead to hepatic steatosis and eventually to steatohepatitis (2). Currently majority of oncologic liver protocols include only T1-weightened-in-and-out-of-phase (IOP) imaging as conventional method for qualitative assessment of steatosis (3-5). It is well know that this method is unreliable if concurrent liver iron accumulation is present (6). Oncologic patients are prone to receive transfusions due to bone marrow failure during chemotherapy, resulting in possible liver iron overload. In these patients a multipoint water–fat separation method known as “iterative decomposition of water and fat with echo asymmetry and least squares estimation” (IDEAL) would allow to separate the competing effects on signal from iron and fat accumulation. IDEAL-IQ is a complex-based chemical shift-encoded MRI (CSE-MRI) sequence used to estimate R2* (1/T2*) and water-trigliceride-fat separation (PDFF) in a single simultaneous acquisition. The PDFF maps incorporate T2* and field inhomogeneity effects thereby it is corrected for magnetic field inhomogeneity due to iron overload (7-10). The aim of this study is to compare IDEAL-IQ and IOP in quantify the liver fat fraction in an oncologic population.Methods
This retrospective study was approved by the institutional review board. Study population consisted of those patients, with no known liver iron overload, that underwent upper abdomen MRI between September 2016 and October 2016. Only liver MRIs with both T1-weightened-in-phase (IP), out-of-phase (OP) and IDEAL-IQ sequences were included in the study. All studies where performed on a 3T MRI imaging system (OptimaMR450w, GE Healthcare). Three 10 mm diameter circular regions of interest (ROI) where measured in the liver and spleen on IP and OP images. The fat fraction was calculated from IOP imaging and measured from IDEAL-IQ fat fraction maps. Fat fractions were estimated from IOP using the average of the three ROIs using two different methods.
IOP-Method 1:
FatFractionConventionalMethodLiver = (IPLiver – OPLiver) / (2*IPLiver) (7)
IOP-Method 2:
FatFractionConventionalMethodLiver/Spleen = (IPLiver /IPSpleen) - (OPLiver/OPSpleen) / (2*IPLiver/IPSpleen)
The liver fat fraction was measured on IDEAL-IQ fat fraction maps placing three 10 mm diameter ROIs; the average measurement from these three ROIs was used as an estimate of the liver fat fraction. Liver iron quantification was also performed using the average of three 10 mm diameter ROIs on IDEAL-IQ R2* maps using the following equation:
Iron ConcentrationIDEAL-IQ = 0.0254 * R2* + 0.202 (11)
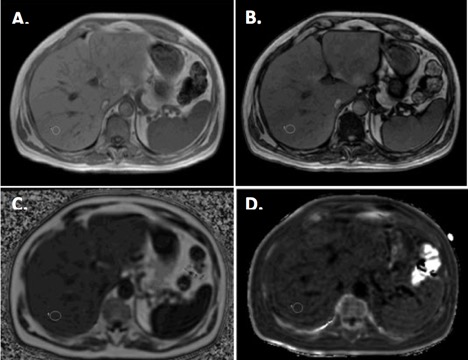
For each patient all the ROI were measured on the same location and avoiding vessels and visible biliary ducts (Figure 1). Differences in fat fraction quantification with the different methods were studied using Student t-test (significant difference for p<0.05).
Results
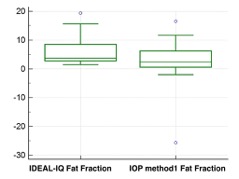
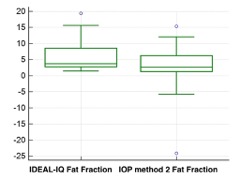
The final sample population consisted of 28 patients (M:F=11:17), mean age 62 (M:F=67:59). Iron liver concentration estimated from R2* maps ranged between 0.94-1.72 mg/g. A statistical difference was demonstrated in fat fraction estimation between the fat fractions calculated by IDEAL-IQ and IOP method 1 (p= 0,0203) and IOP method 2 (p=0,0130) (Figure 2-3).Discussion
Our results show that fat fraction calculated from IDEAL-IQ maps and from T1-weightened-in-and-out-of-phase (IOP) imaging are significantly different in a population without pathologic liver iron levels. IOP methods allow a fat estimation limited to 0%-50% (7), but all the sample population fat fraction obtained with IOP methods never exceed 12% and no subjected in this study demonstrated iron overload. Thus the discrepancy in fat fraction estimation in these subjects is probably due to another known possible cause (i.e. liver fibrosis, noise bias, T1 and T2 bias, eddy currents)(7, 12, 13). A limitation of the study was the lack of pathologic or MRI spectroscopy correlation.Conclusion
Hepatic steatosis is a frequent finding in an oncologic patients population post chemotherapy. Liver fat quantification may have clinical applications in therapy management of these patients. Currently mostly of the MRI liver protocol relay IP-OP sequences for qualitative assessment of liver steatosis, and no liver fat fraction estimation is performed routinely. IDEAL-IQ would allow for a better estimation of fat fraction in this population.Acknowledgements
No acknowledgement found.References
1. Grigorian A, O'Brien CB. Hepatotoxicity Secondary to Chemotherapy. J Clin Transl Hepatol 2014;2(2):95–102.
2. Sharma A, Houshyar R, Bhosale P, Choi J-I, Gulati R, Lall C. Chemotherapy induced liver abnormalities: an imaging perspective. Clin Mol Hepatol 2014;20(3):317–326.
3. Bahl M, Qayyum A, Westphalen AC, et al. Liver steatosis: investigation of opposed-phase T1-weighted liver MR signal intensity loss and visceral fat measurement as biomarkers. Radiology 2008;249(1):160–166.
4. Merkle EM, Nelson RC. Dual gradient-echo in-phase and opposed-phase hepatic MR imaging: a useful tool for evaluating more than fatty infiltration or fatty sparing. RadioGraphics Radiological Society of North America; 2006;26(5):1409–1418.
5. Earls JP, Krinsky GA. Abdominal and pelvic applications of opposed-phase MR imaging. American Journal of Roentgenology American Public Health Association; 1997;169(4):1071–1077.
6. Queiroz-Andrade M, Blasbalg R, Ortega CD, et al. MR imaging findings of iron overload. RadioGraphics Radiological Society of North America; 2009;29(6):1575–1589.
7. Reeder SB, Cruite I, Hamilton G, Sirlin CB. Quantitative assessment of liver fat with magnetic resonance imaging and spectroscopy. J Magn Reson Imaging 2011;34(4):729–749.
8. Reeder SB, McKenzie CA, Pineda AR, et al. Water-fat separation with IDEAL gradient-echo imaging. J Magn Reson Imaging 2007;25(3):644–652.
9. Reeder SB, Pineda AR, Wen Z, et al. Iterative decomposition of water and fat with echo asymmetry and least-squares estimation (IDEAL): application with fast spin-echo imaging. Magn Reson Med Wiley Subscription Services, Inc., A Wiley Company; 2005;54(3):636–644.
10. Reeder SB, Wen Z, Yu H, et al. Multicoil Dixon chemical species separation with an iterative least-squares estimation method. Magn Reson Med Wiley Subscription Services, Inc., A Wiley Company; 2004;51(1):35–45.
11. Wood JC, Enriquez C, Ghugre N, et al. MRI R2 and R2* mapping accurately estimates hepatic iron concentration in transfusion-dependent thalassemia and sickle cell disease patients. Blood American Society of Hematology; 2005;106(4):1460–1465.
12. McPherson S, Jonsson JR, Cowin GJ, et al. Magnetic resonance imaging and spectroscopy accurately estimate the severity of steatosis provided the stage of fibrosis is considered. Journal of Hepatology 2009;51(2):389–397.
13. Friedrich-Rust M, Müller C, Winckler A, et al. Assessment of liver fibrosis and steatosis in PBC with FibroScan, MRI, MR-spectroscopy, and serum markers. Journal of Clinical Gastroenterology 2010;44(1):58–65.
Figures