3539
Non-Central Chi to Gaussian Transformation of Diffusion MRI Signals Improves Estimation of Fiber ODFs1Department of Radiology and BRIC, University of North Carolina at Chapel Hill, Chapel Hill, NC, United States
Synopsis
Many existing algorithms for estimation of the fiber orientation distribution function (ODF) inherently assume Gaussian noise distribution. Against this assumption, the non-central chi noise distribution of diffusion signals causes bias in fiber ODF estimation. In this work, we introduce a means of transforming the diffusion-weighted signals to have a Gaussian noise distribution with the help of the recently introduced x-q space non-local means (XQ-NLM) algorithm. We show that this signal mapping improves estimation of fiber ODFs.
Purpose
Diffusion MRI (dMRI) harnesses the diffusion patterns of water molecules to produce estimates of fiber orientation distribution functions (ODFs). The accuracy of fiber ODFs has direct bearing on tractography outcome. Most ODF estimation algorithms1-3 inherently assume that the noise distribution of diffusion-weighted signals is Gaussian, when it is actually non-central chi (NCC)4,5, leading to biased results. In this work, we employ the recently introduced x-q space non-local means (XQ-NLM)6 algorithm for estimating the location parameter of the NCC distribution so that signal mapping to Gaussian distribution can be performed. We then show that, using the transformed signals with Gaussian noise distribution, the fiber ODFs can be estimated more accurately.Methods
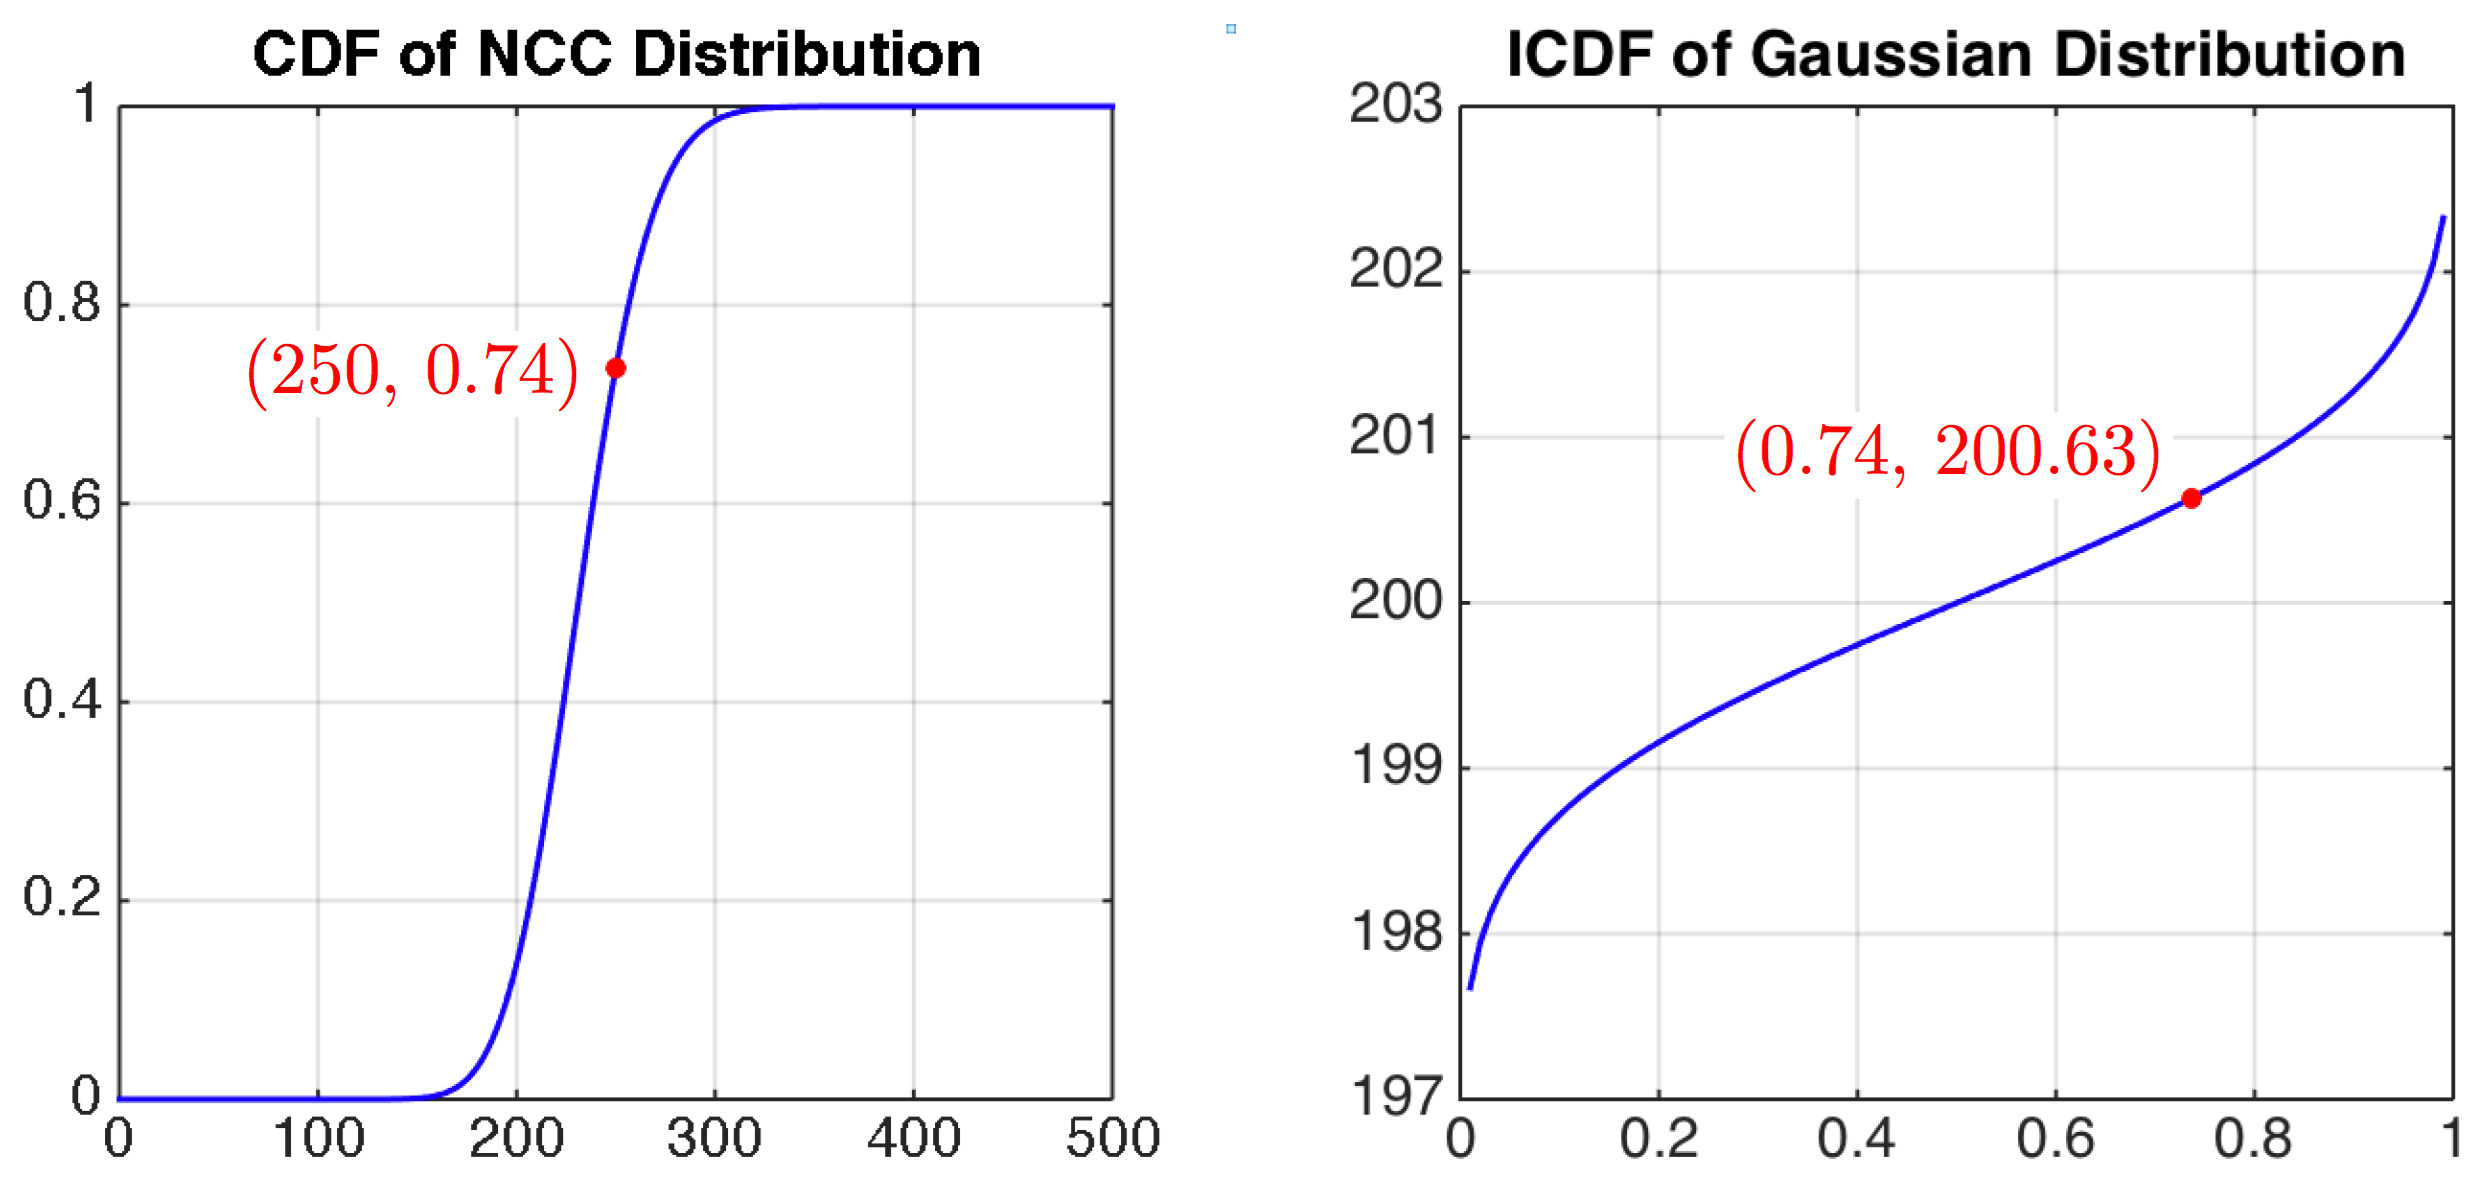
Following Koay et al.’s work5, we utilize the cumulative distribution function (CDF) $$$P_{\chi}$$$ of a non-central chi random variable $$$m$$$ and the inverse cumulative distribution function (ICDF) $$$P^{−1}_{G}$$$ of a Gaussian random variable $$$x$$$ for signal mapping. Given $$$m$$$, the Gaussian counterpart is
$$x=P^{-1}_{G}(P_{\chi}(m|\eta,\sigma,N)|\eta,\sigma),~~~~~~(1)$$
where $$$\eta$$$ is the location parameter, $$$\sigma$$$ is the scale parameter, and $$$N$$$ is the number of receiver coils. We estimate $$$\sigma$$$ from image background7 and $$$\eta$$$, the actual noise-free signal using XQ-NLM6. With these estimated parameter values, signal mapping is performed using (1).
Results
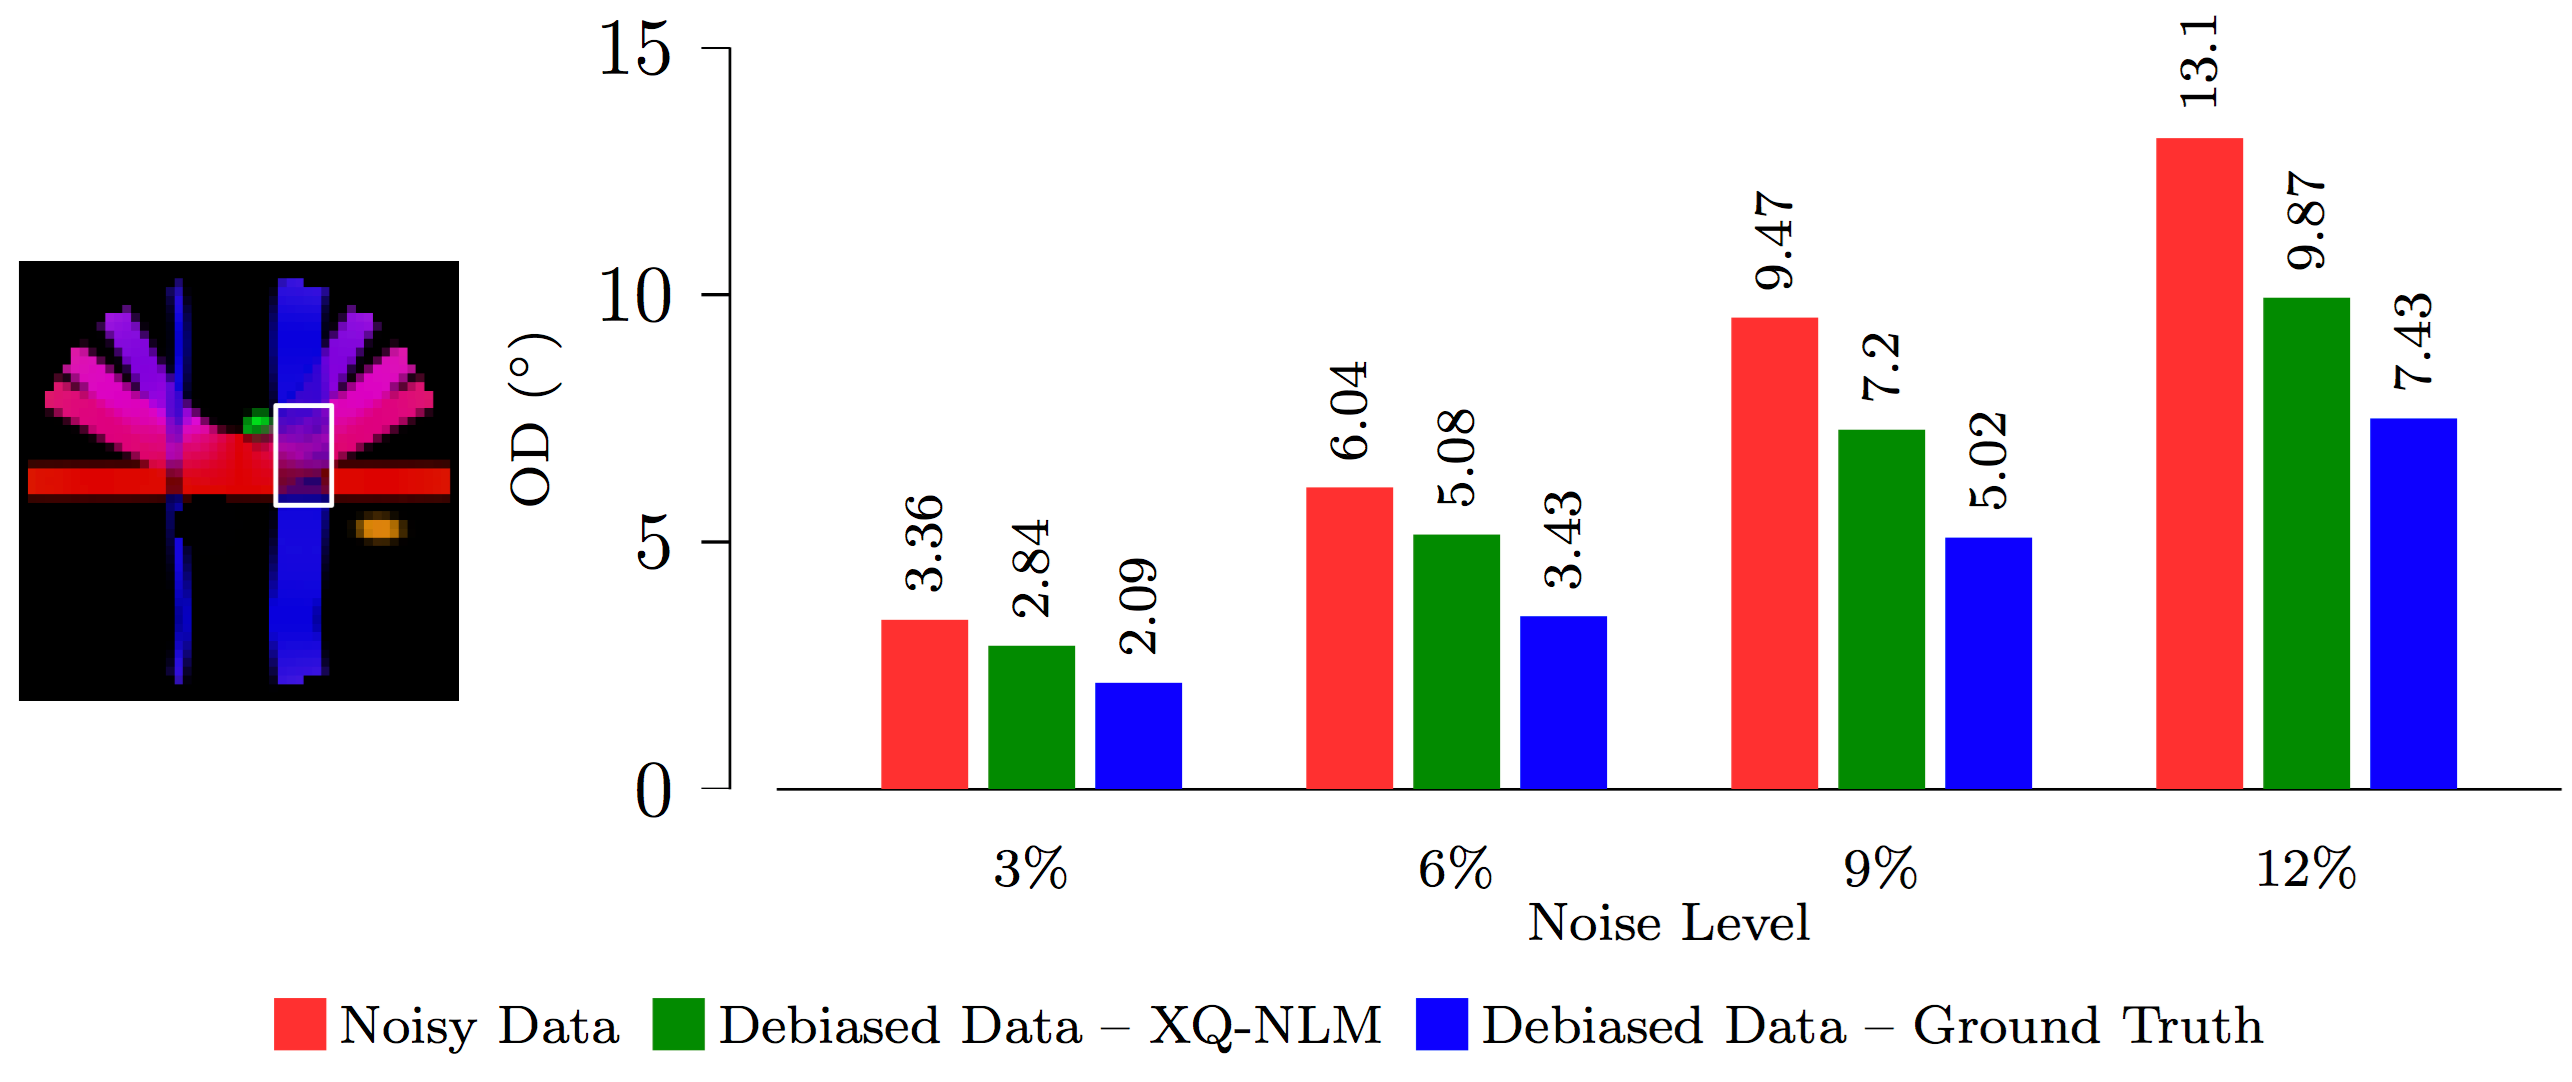
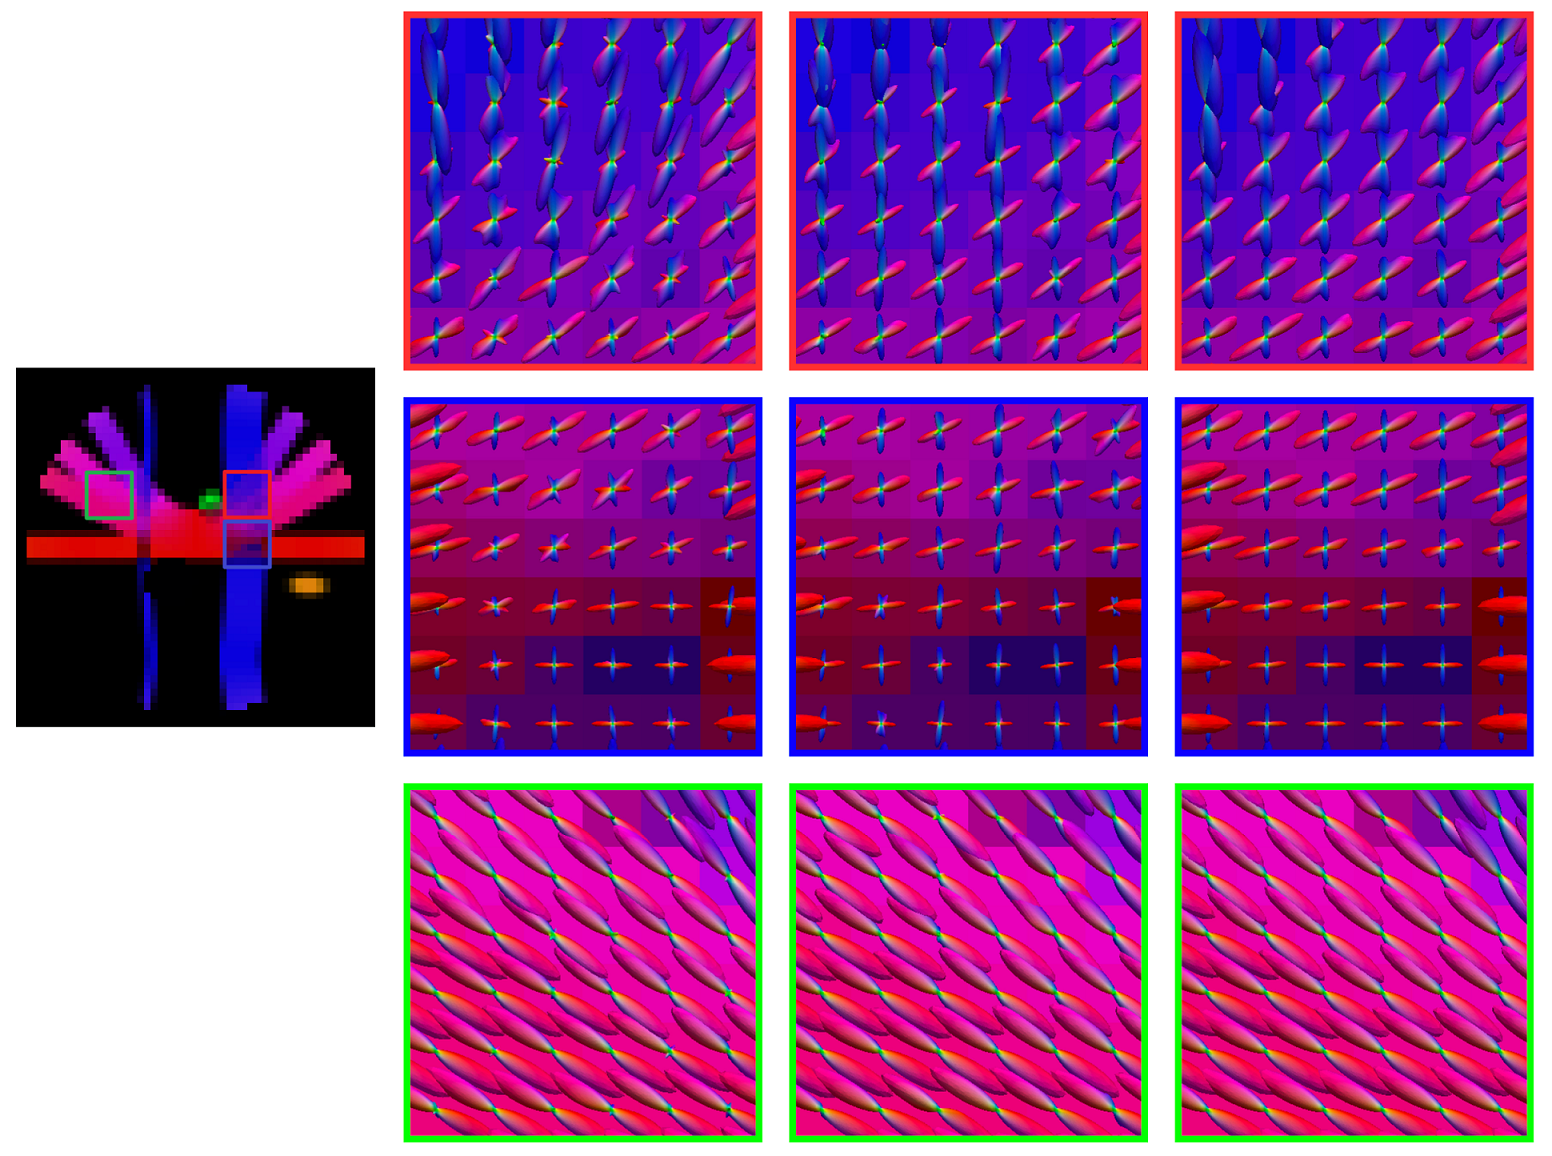
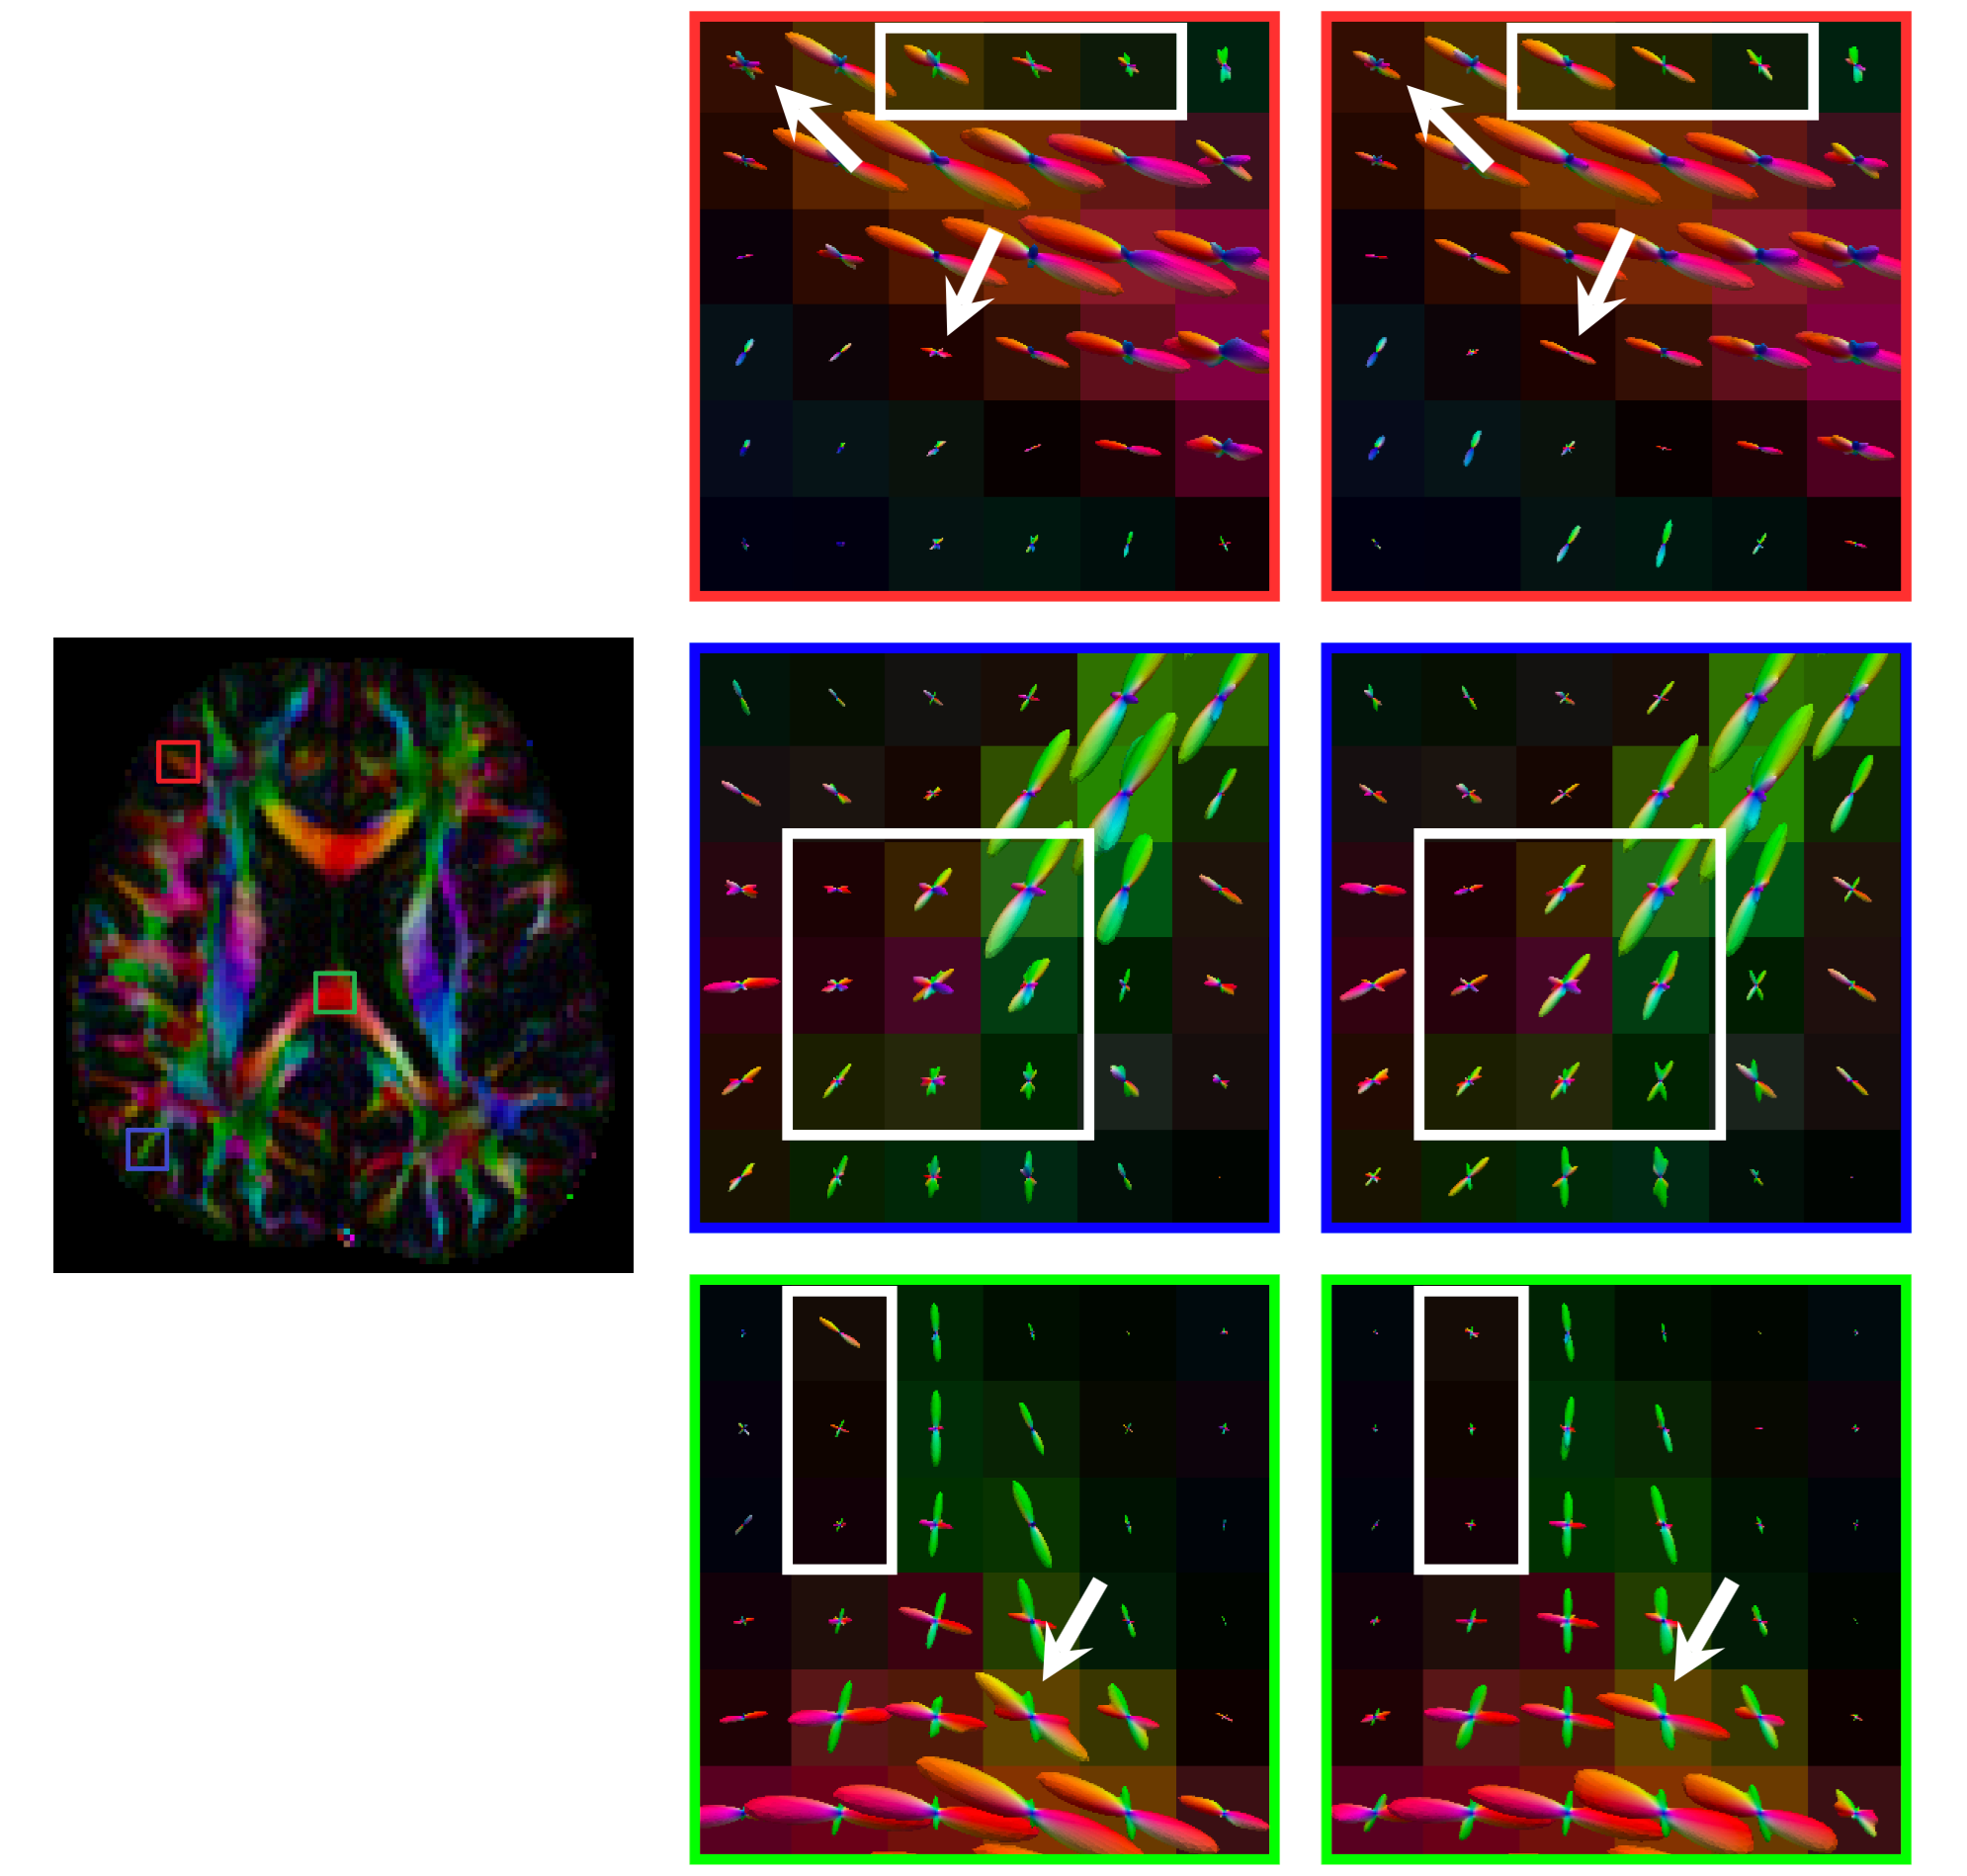
We evaluated how the signal mapping affects the estimation of fiber ODFs. We first generated a synthetic dataset using phantomas8 with parameters: b=500,1000,1500,2000,2500,3000 s/mm2 and 9,12,17,24,34,48 non-collinear gradient directions, respectively. We then added four levels of NCC noise (3%, 6%, 9% and 12%). Using the same b-values and gradient directions, we acquired a set of diffusion-weighted images of an adult subject. For the synthetic dataset, we use orientational discrepancy (OD)9 to measure the angular difference between the peaks given by the estimated fiber ODFs. The results, shown in Fig. 2, indicate that, compared with estimation using the NCC noisy data, the debiased data result in significantly lower OD values. As reference, we show in the figure the results produced by substituting for $$$\eta$$$ the ground truth values, instead of those generated by XQ-NLM. It is interesting to note that when the noise level increases, the degree of reduction in OD increases, achieving the largest value of $$$3.23^\circ$$$ for 12% noise. Note that we used an ROI to restrict the evaluation to a fiber crossing region, where estimation of fiber ODFs is more challenging. Consistent conclusions can be obtained by visual inspection of the fiber ODFs, as shown in Fig. 3. The debiased data produce cleaner ODFs which resemble the ground truth. The NCC data produce more spurious peaks. The visual results for the real data are shown in Fig. 4. The debiased data produce fiber ODFs that are more coherent and have less false-positive peaks.
Conclusion
We have shown that NCC-to-Gaussian transformation of diffusion-weighted signals improves estimation of fiber ODFs.Acknowledgements
This work was supported in part by NIH grants (NS093842, EB022880, EB006733, EB009634, AG041721, MH100217, and AA012388).References
1. Yap P-T, Zhang Y, Shen D-G. Multi-tissue decomposition of diffusion MRI signals via l0 sparse-group estimation. IEEE Transactions on Image Processing. 2016;25(9):4340–4353.
2. Yap P-T, Shen D-G, et al. Spatial transformation of DWI data using non-negative sparse representation. IEEE transactions on medical imaging. 2012;31(11):2035.
3. Tuch D-S. Q-ball imaging. Magnetic Resonance in Medicine. 2004;52(6):1358–1372.
4. Sotiropoulos S, Moeller S, Jbabdi S, Xu J, Andersson J, Auerbach E, Yacoub E, Feinberg D, Setsompop K, Wald L, et al. Effects of image reconstruction on fiber orientation mapping from multichannel diffusion MRI: reducing the noise floor using SENSE. Magnetic resonance in medicine. 2013;70(6):1682–1689.
5. Koay C-G, Özarslan E, Basser P-J. A signal transformational framework for breaking the noise floor and its applications in MRI. Journal of Magnetic Resonance. 2009;197(2):108–119.
6. Chen G, Wu Y-F, Shen D-G, Yap P-T. XQ-NLM: Denoising diffusion MRI data via x-q space non-local patch matching. In International Conference on Medical Image Computing and Computer-Assisted Intervention-MICCAI 2016. pages 587–595. Springer.
7. Manjón J-V, Carbonell-Caballero J, Lull J-J, García-Martí G, Martí-Bonmatí L, Robles M. MRI denoising using non-local means. Medical image analysis. 2008;12(4):514–523.
8. Caruyer E, Daducci A, Descoteaux M, Houde J-C, Thiran J-P, Verma R. Phantomas: a flexible software library to simulate diffusion MR phantoms. In ISMRM 2014.
9. Yap P-T, Chen Y, An H, Yang Y, Gilmore J-H, Lin W-L, and Shen D-G. SPHERE: SPherical Harmonic Elastic REgistration of HARDI data. 2011;NeuroImage. 55(2):545–556.
Figures