3538
A fingerprinting approach to identifying fiber directions in Orientation Distribution Functions for Higher Order Diffusion MRI1Center for Advanced Imaging Innovation and Research (CAI2R), NYU School Of Medicine, New York, NY, United States, 2Center for Biomedical Imaging, Dept of Radiology, NYU School Of Medicine, New York, NY, United States
Synopsis
Purpose
Higher Angular Resolution Diffusion Imaging (HARDI) methods, such as Diffusion Spectrum Imaging (DSI[1]) and multishell Q-ball imaging[2] are robust tools for non-invasive imaging of in vivo white matter architecture. These methods capture the complex intravoxel crossings [1,3] in Orientation Distribution Functions (ODFs). A key step to use these ODFs in tractography algorithms is the correct identification of the fiber directions in each voxel. Limited angular resolution of the acquisition and intrinsic ODF peak width [4] make it however difficult to correctly estimate fiber directions accurately in the case of small crossing angles [5,6]. Most proposed methods fail to detect crossing angles less than 40° [5,6]. Even deconvolving the ODFs with a Fiber Response Function fails to reliably detect crossing angles smaller than 30°[7].
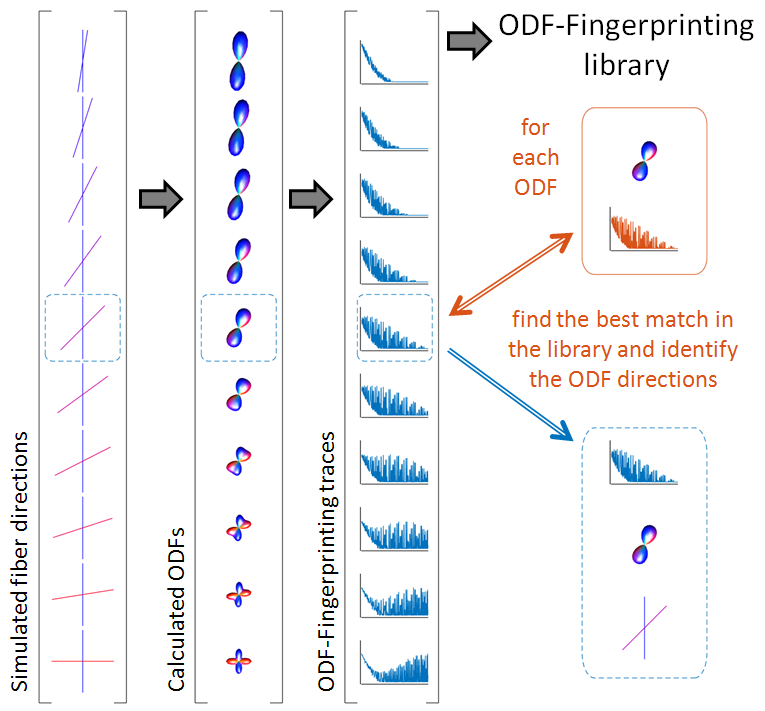
Here we propose a new approach inspired by the recent success of fingerprinting approaches in quantitative MRI imaging[8,9]. We generate a library of ODF-fingerprints and identify the fiber directions of ODFs by assessing similarity with the library of fingerprints (Figure 1). We demonstrate this method on both simulated and in vivo measured ODFs.
Methods
A library of ODF-fingerprints is generated by first simulating diffusion weighted signals for a number of possible fiber combinations (up to 2 fibers; main fiber along the Z-axis, angles of subsequent fibers sampled on a 642-point tessellation of the unit sphere; fiber FA ranging from 0.4 to 0.8 in steps of 0.1; assumption of cylindrical fibers ($$$\lambda_2=\lambda_3$$$) with a simple diffusion tensor model; fiber bundle volume relative to the voxel size ranging from 0 to (1-water component) in steps of 0.1; 10% water component; ADC=1.0mm$$$^2$$$/s) on a Radial Diffusion Spectrum Imaging grid (236 q-space samples on four shells, b=1000,2000,3000,4000s/mm$$$^2$$$ (simulations), and b=200,1500,2750,4000s/mm$$$^2$$$ (in vivo)[10]). The ODF-fingerprints are then subsequently calculated from the simulated diffusion weighted signals. For each measured ODF-trace, we find the matching ODF-fingerprint by searching for the ODF-fingerprint with the largest dot-product[8,9]. The size of the fingerprint-library is reduced by rotating the maximum value of ODF-traces to the Z-axis before matching.
In an in-house simulation, ODF-samples are simulated as above, but with random fiber directions. Rician noise is added where necessary. Additionally, a crossing fiber-phantom is simulated with the Phantomas-software[11] (composite hindered and restricted diffusion model[12]). In vivo DSI acquisitions are acquired on a 3T clinical scanner (Prisma, Siemens, Erlangen; 20ch head coil; bmax=4000, TR/TE=2600/114ms, 60 slices, 220mm FoV, 2.2x2.2x2.2mm resolution, 2x in slice GRAPPA, PF6/8, SMS4; healthy male volunteer, 29 y/o). The images are denoised [13] and corrected for susceptibility, eddy currents and subject motion using eddy from the FSL Library [14]. RDSI reconstructions, incorporating variable sample density correction, were performed offline using custom-made software (Matlab, Mathworks) and displayed with DSIStudio [15].
Results and Discussion
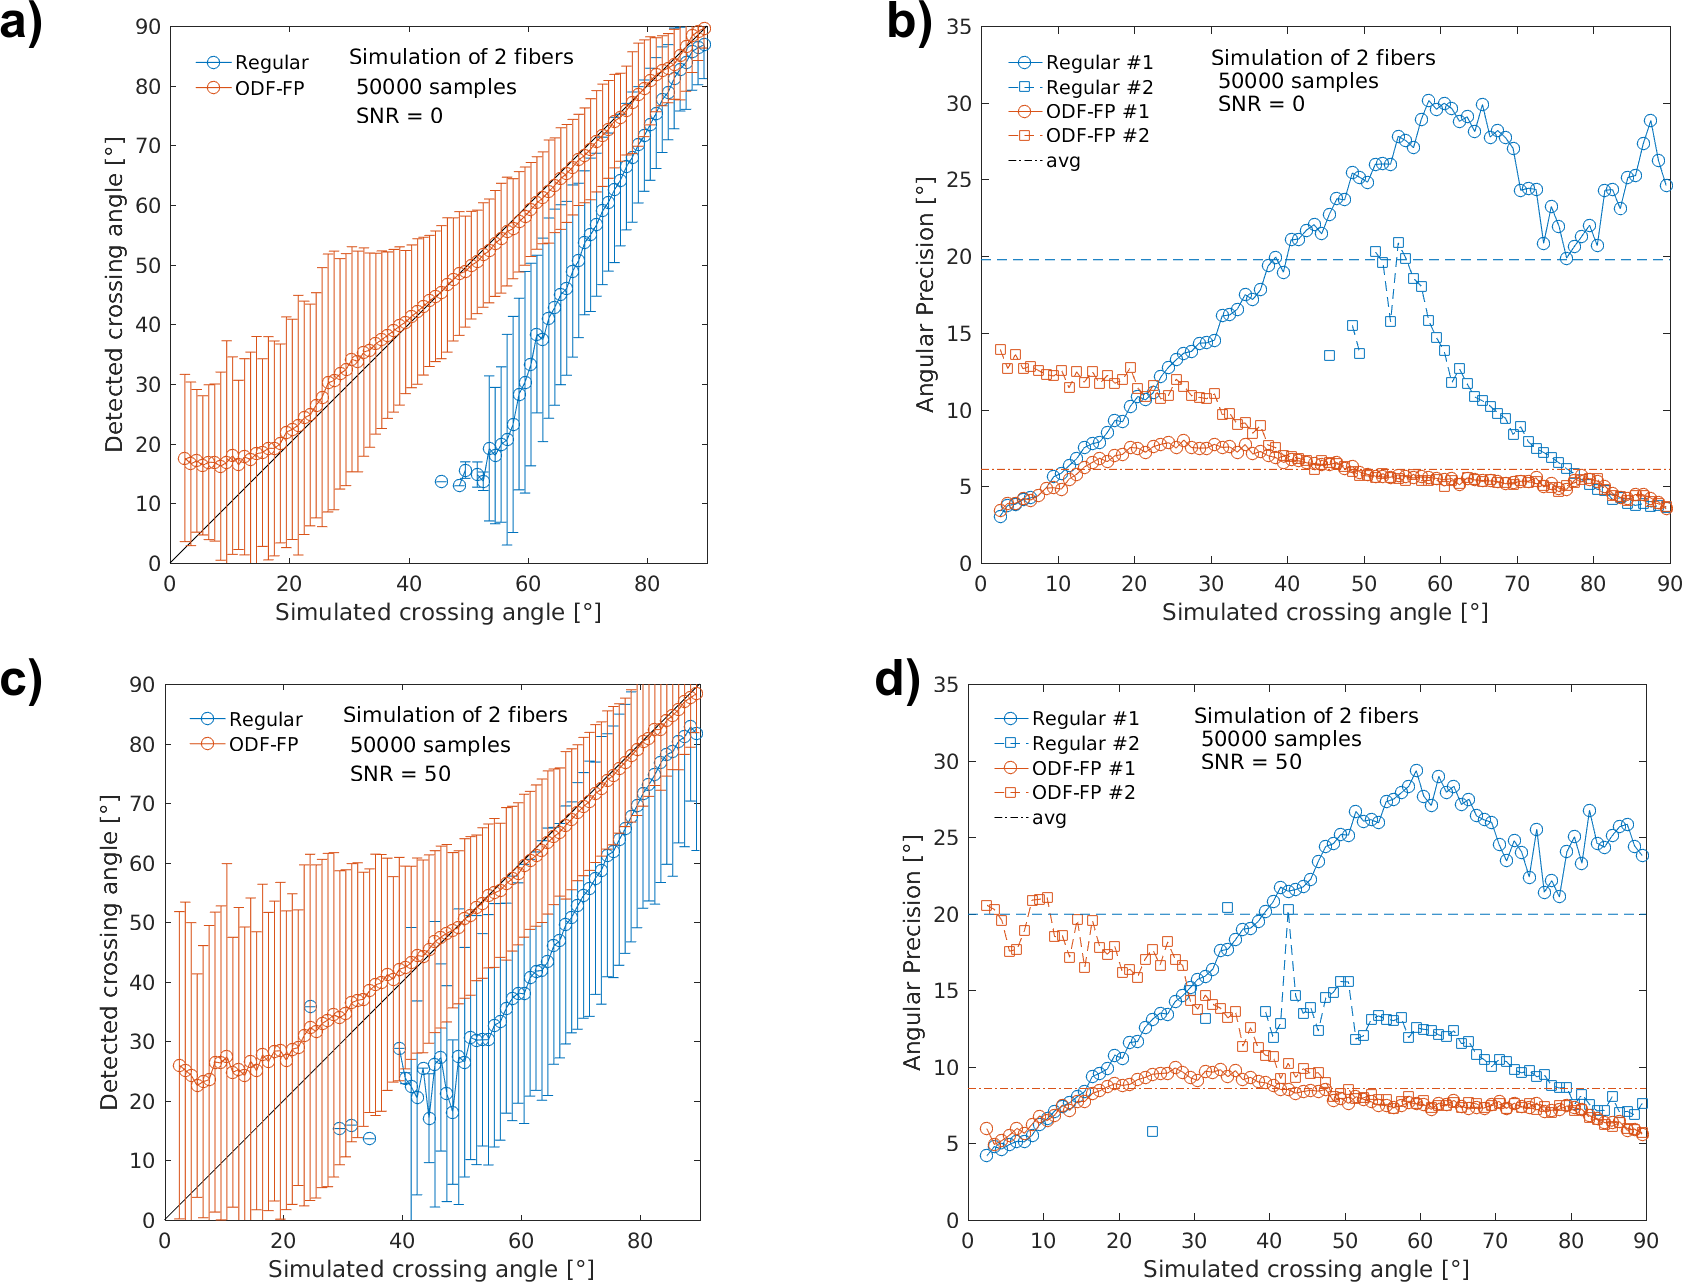
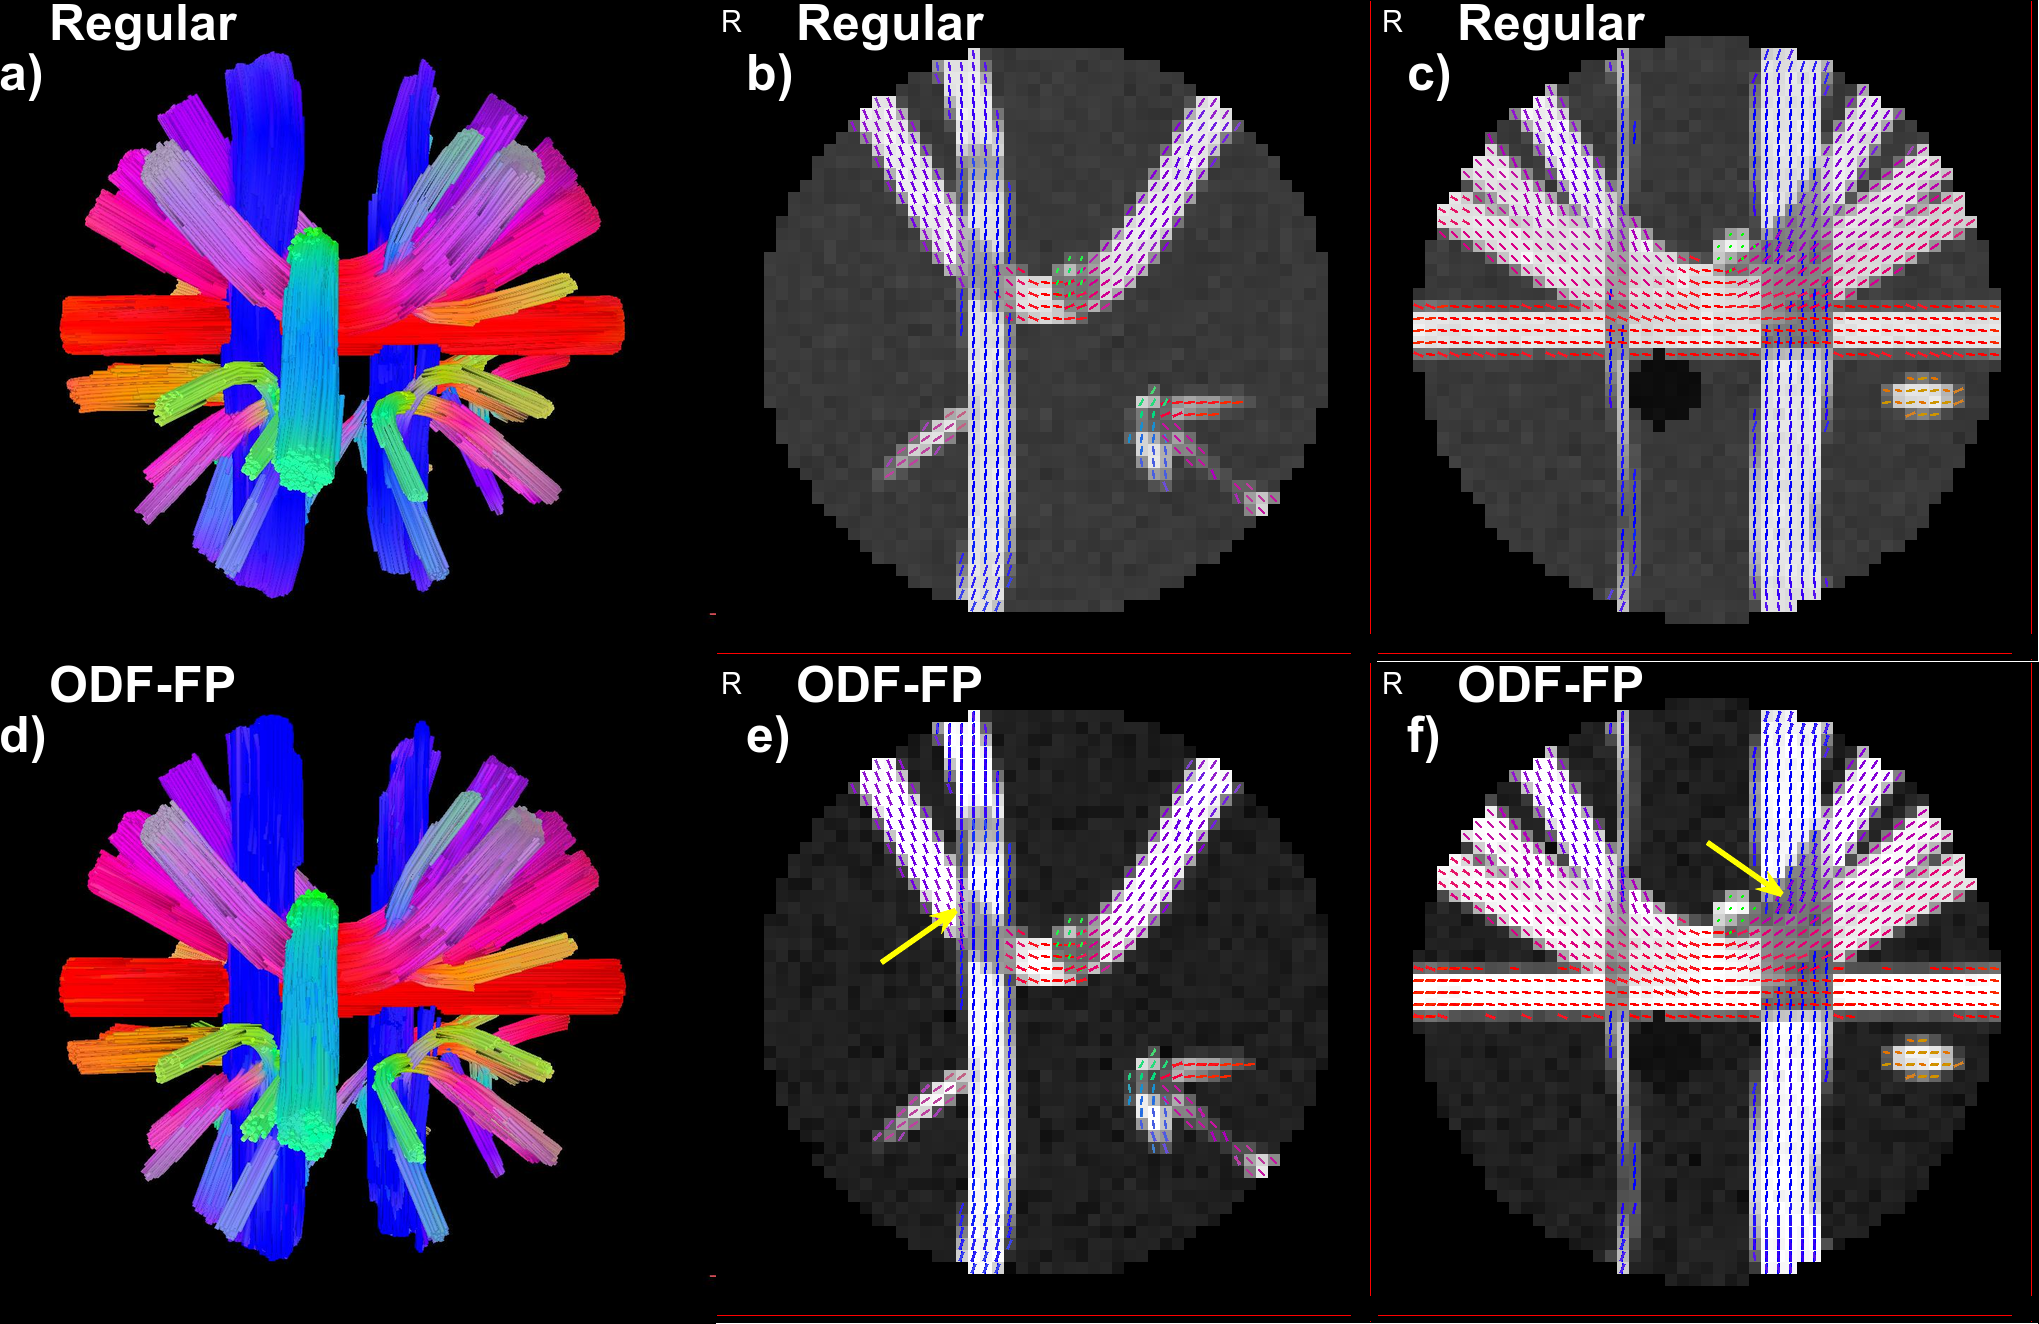
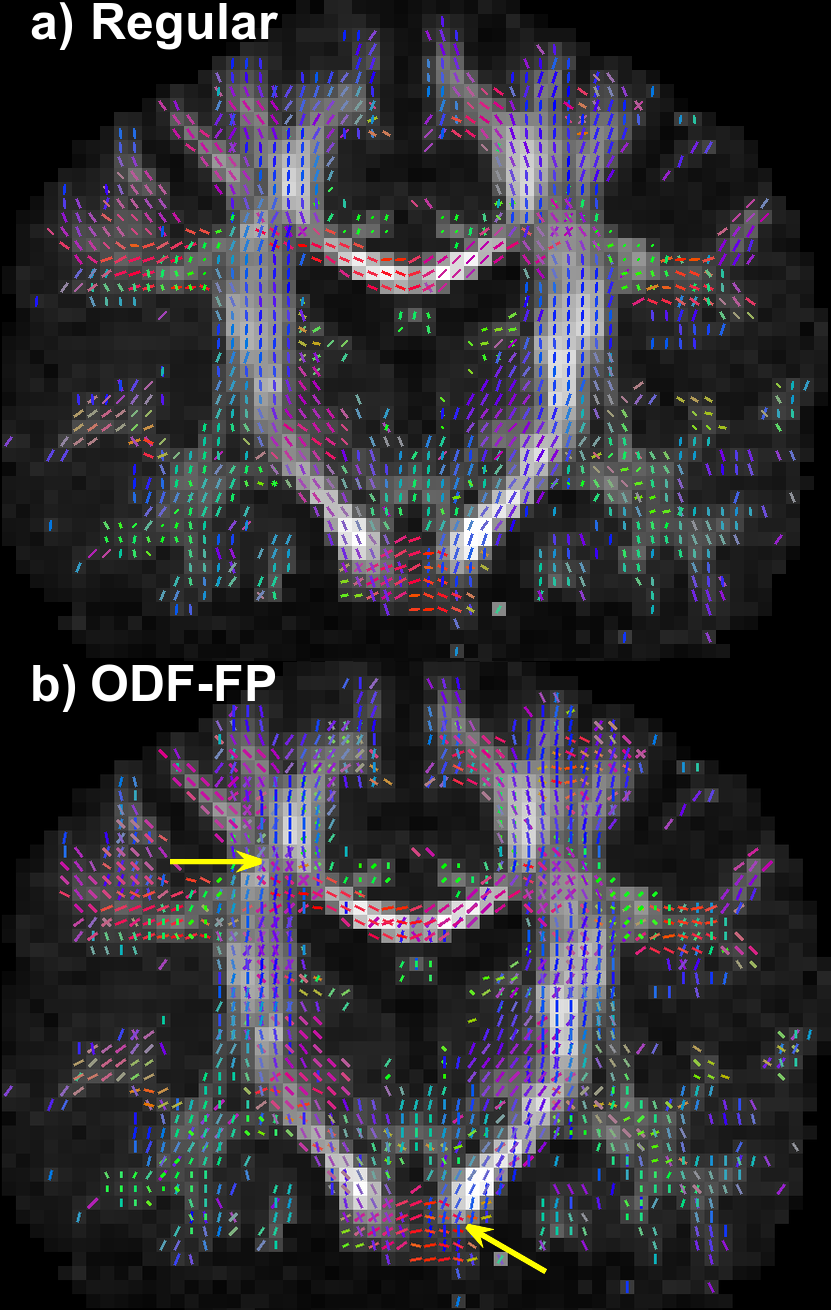
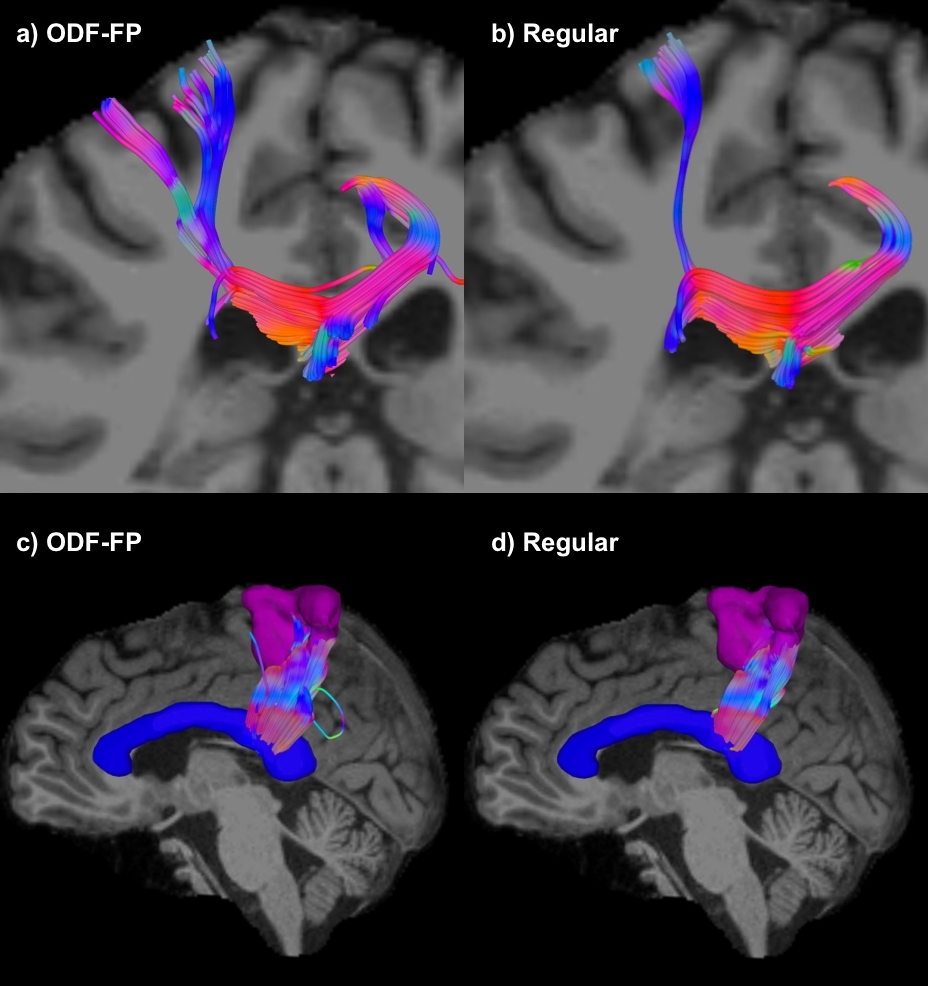
The fingerprinting approach to finding fiber directions from ODFs is able to more accurately identify smaller crossing angles (Figure 2a,b). At the same time, it retains similar precision the fiber direction (Figure 2 for two fibers, for a single fiber 5.1° for no added noise and 3.5° for SNR 50). Improvements in angular precision relative to the regular method are seen at higher crossing angles due to the better detection of crossing fibers (Figure 2b,d). These results are consistent when the method is applied to ODFs simulated with the same diffusion model as the ODF-library (Figure 2) and, more importantly, when it is applied to ODFs simulated with a different diffusion model (Phantomas-software, Figure 3). Although a gold standard is absent in the in vivo dataset, it is still evident that smaller crossing angles are being identified (Figure 4) and that this aids the tractography algorithms (Figure 5).Conclusion
A fingerprinting-based methodology for identifying fiber directions in ODFs improves the detection of fiber pairs with small crossing angles whilst maintaining fiber direction precision. This improvement will aid fiber tracking algorithms in accurately displaying neuronal tracts and calculating brain connectivity. Future work will focus on using more detailed diffusion models and on verifying the method in fiber phantoms.Acknowledgements
This project is supported in part by PHS Grants R01CA111996, R01NS082436 and R01MH00380.References
[1] Wedeen, V.J. (2012), ‘The geometric structure of the brain fiber pathways’, Science, vol. 335, pp. 1628-34.
[2] Tuch, D.S. (2004), ‘Q-ball imaging’, Magn. Reson. Med., vol. 52, pp. 1358-72.
[3] Fernandez-Miranda, J.C. (2012), 'High-Definition Fiber Tractography of the Human Brain: Neuroanatomical Validation and Neurosurgical applications', Neurosurgery, vol. 71, pp. 430-453.
[4] Barnett, A. (2009), ‘Theory of Q-ball Imaging Redux: Implications for Fiber Tracking’, Magn. Reson. Med., vol 62, pp 910-923.
[5] Kuo, L.-W. (2008), ‘Optimization of diffusion spectrum imaging and q-ball imaging on clinical MRI system’, NeuroImage, vol 41, pp 7-18.
[6] Jeurissen, B. (2013), ‘Investigating the Prevalence of Complex Fiber Configurations in White Matter Tissue with Diffusion Magnetic Resonance Imaging’, Human Brain Mapping, vol. 34, pp. 2747-66.
[7] Tournier, J.-D. (2008), ‘Resolving crossing fiberes using constrained spherical deconvolution: Validation using diffusion-weighted imaging phantom data’, NeuroImage, vol 42., pp. 617-25.
[8] Ma, D. (2013), ‘Magnetic Resonance Fingerprinting’, Nature, vol 495, pp. 187.
[9] Cloos, M. (2016), ‘Multiparametric imaging with heterogeneous radiofrequency fields’, Nature communications, pp. 12445.
[10] Baete, S. (2016), ‘Radial q-Space Sampling for DSI’, Magn. Reson. Med. vol 76, pp. 769-780.
[11] Caruyer, E. (2014), ‘Phantomas: a flexible software library to simulate diffusion MR phantoms’, Proc. Intl. Soc. Magn. Reson. Med., vol 21.
[12] Assaf, Y. (2005), ‘Composite hindered and restricted model of diffusion (CHARMED) MR imaging of the human brain’, Neuroimage, vol 27, pp. 48-58.
[13] Veraart J. (2016), ‘Denoising of diffusion MRI data using Random Matrix Theory’, NeuroImage, vol 142, pp. 394–406.
[14] Jenkinson, M., ‘FSL.’, NeuroImage, vol 62, pp. 782-90.
[15] Veraart J. (2016), ‘Denoising of diffusion MRI data using Random Matrix Theory’, NeuroImage, vol 142, pp. 394–406.
Figures