3535
MuSHER: Multi-shell Spherical Harmonic Error Rejection1Cardiff University, Cardiff, United Kingdom
Synopsis
Diffusion weighted imaging is prone to artefacts. Sources including hardware instability, bulk motion and cardiac pulsation can all induce spurious signal intensities (i.e. corruption) which negatively affect derived measurements. To combat this an additional processing step may be added to detect (and subsequently reject) such corrupted data points; however, with the increasing use of multi-shell acquisitions a number of existing approaches (constrained to a single b-value shell and/or unsuitable diffusion tensor models) are no longer applicable, limiting available choices. With this abstract we propose a new multi-shell detection algorithm and provide preliminary experimental results.
Purpose
To demonstrate and evaluate a method for voxel specific outlier
detection within multi-shell DW-MRI data.Methods
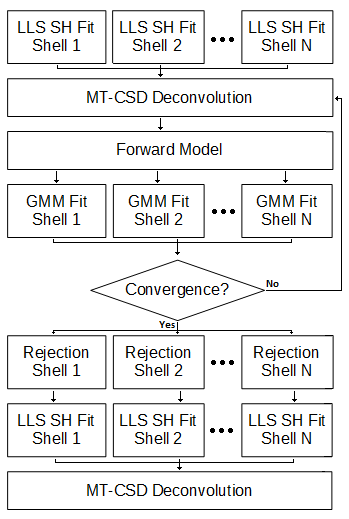
Implementation: The proposed method is based on multi-tissue constrained spherical deconvolution (MT-CSD)1. Relevant features of MT-CSD here are: (a) the DW-MRI signals in each shell are represented by a set of spherical harmonic (SH) coefficients that are fit both independently (SH fit to one shell does not influence any other) and fit using a simple linear least squares method; and (b) convolving the derived fibre orientation density function (fODF) with MT-CSD's multi-shell convolution kernels naturally provides a forward estimate of the expected DW-MRI signals. Detecting corruption within any given voxel involves the following steps. Following an initial MT-CSD deconvolution we use the fODF-driven preductions to calculate residuals with respect to the real DW-MRI data, which are then used to perform a weighted linear re-fit (with weights specified by the Geman McClure M-estimator2) of each shell's spherical harmonics. We then re-run MT-CSD and arrive at a revised fODF estimate. This process is iterated until the solution converges. Following convergence, rejection is performed on a shell-by-shell basis by eliminating data points with absolute residuals exceeding some multiple, k, of 1.4826 * median absolute deviation of residuals within that shell. Figure 1 shows a schematic for this process, the MT-CSD step (and all supporting operations not discussed here) is performed exactly as described in1.
We call this method 'Multi-shell Spherical Harmonic Error Rejection' (MuSHER).
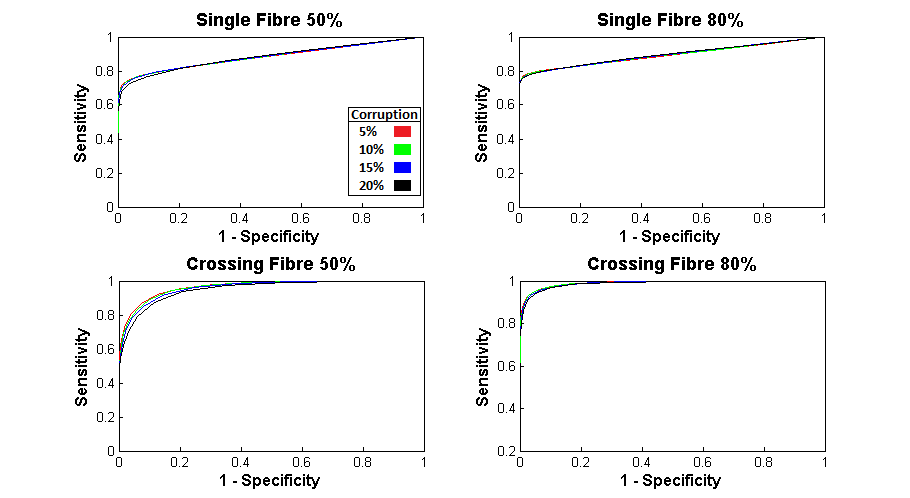
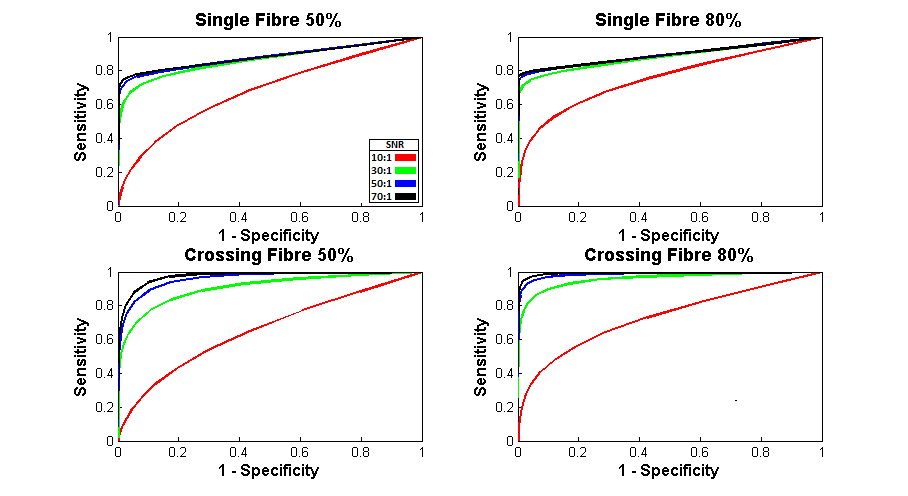
Simulation 1: DW-MRI signal data were simulated in two configurations; a single coherently oriented fibre bundle and two fibre bundles crossing at 90o. Three shells of b = 1000 s/mm2, 2000 s/mm2 and 3000 s/mm2 were used with 60 directions per shell and, in both cases, the (single fibre) responses matched those observed in the body of the corpus callosum (FA=0.79, MD=0.90x10⁻³ mm2/s). Data were then corrupted by selecting a random subsample (5/10/15/20%) of datapoints within each shell and, randomly, either increasing or decreasing their intensities by factors of 50% and 80%. Ten thousand random initialisations were generated for each configuration and Rician noise added to achieve b=0s/mm2 SNRs of 10:1, 30:1, 50:1 and 70:1.
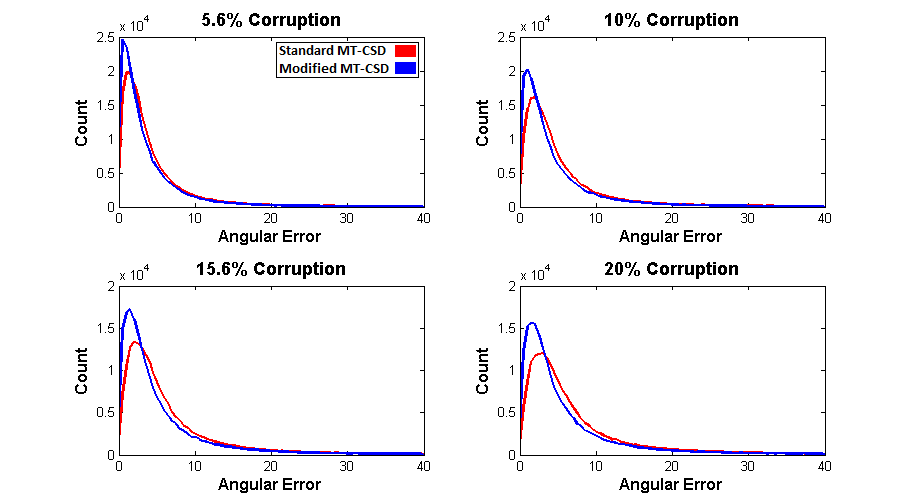
Simulation 2: A sample image was selected at random from the Human Connectome Project dataset and, through visual inspection, confirmed to be free of major artefacts. We then identified all voxels with >50% probability of containing white matter (approximately 200000 in total) and, within those voxels, randomly selected subsets of 5.6/10/15.6/20% of the datapoints within each shell to be corrupted by random intensity increases/decreases of 50%. We then compared the dominant fODF peak acquired using (a) fODF estimates derived from unmodified MT-CSD and (b) fODF estimates derived from MuSHER to “gold standard” orientations derived from MT-CSD applied to the uncorrupted image.Results
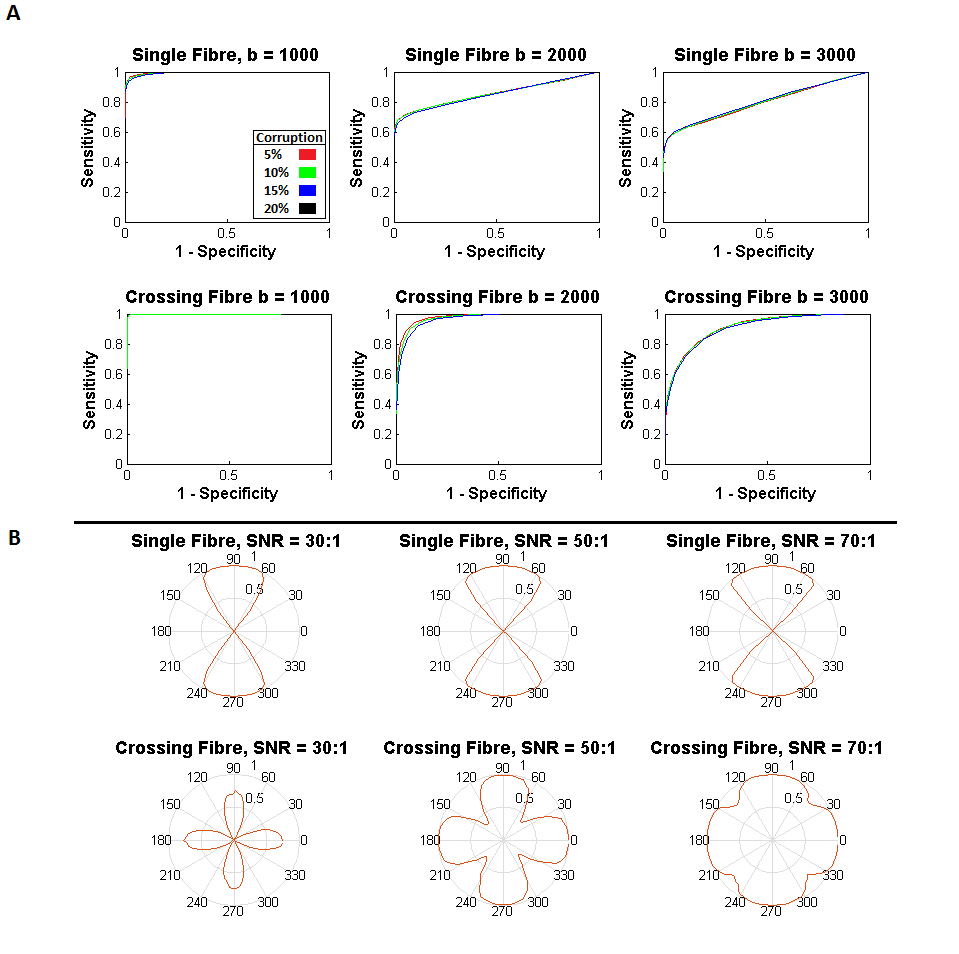
Figure 2 displays characteristic ROC curves with respect to k (k = 0 to 6 at a 0.25 interval) for identification of corruption within simulated data (SNR = 50:1). Figure 3 shows performance with respect to SNR. Figure 4a displays shell-wise ROC curves (SNR=50:1, 50% multiple) while Figure 4b shows the likelihood of correctly identifying corruption with respect to the angle subtended between the gradient and fibre orientations. Finally, Figure 5 plots histograms of error (in degrees) between “gold standard” fODF peaks and those derived from the deliberately corrupted image.Discussion
As shown in Figure 2, the proposed method appears largely insensitive (within explored bounds) to the number of corrupted data points. There are, however, apparent sensitivities to SNR (Figure 3) and fibre configuration (Figure 2 & 3). Figure 4 examines these sensitivities more closely. Note that an optimal value of k (approximately 1.5 in all tested circumstances) allows highly effective classification within the b=1000 s/mm2 shell. However, as b-values increase, sensitivity is lost along gradients co-incident with maxima in the diffusion ODF, i.e. where attenuation is highest. Potential explanations are twofold: (i) in multiplicative corruption schemes the absolute magnitude of the applied corruption depends on the initial magnitude of the uncorrupted signal, thus reducing the “effect size”, and by extension detectability, in areas of high attenuation; and (ii) higher b-values naturally bring intensities closer to the Rician noise floor3 – particularly where diffusivity is high – thus despite deliberately “corrupting” such signals, once noise is applied they may still be indistinguishable from background noise due to interactions with this floor. However, when applied to the deliberately corrupted in vivo data (Figure 5), the modified MT-CSD algorithm nevertheless produces improvements in orientation accuracy, an important outcome given the impact of cumulative errors in tractography4.Acknowledgements
Data were provided in part by the Human Connectome Project, WU-Minn Consortium (Principal Investigators: David Van Essen and Kamil Ugurbil; 1U54MH091657) funded by the 16 NIH Institutes and Centers that support the NIH Blueprint for Neuroscience Research; and by the McDonnell Center for Systems Neuroscience at Washington University.References
1. Jeurissen B., J.D. Tournier, T. Dhollander, A. Connelly and J. Sibers. Multi-tissue constrained spherical deconvolution for improved analysis of multi-shell diffusion MRI data. NeuroImage. 2014;103:411-426.
2. Geman S. and D.E. McClure. Statistical methods for tomographic image reconstruction. Bull Int Stat Inst. 1987;52:5–21.
3. Jones D.K. and P.J. Basser. “Squashing Peanuts and Smashing Pumpkins”: How noise distorts diffusion weighted MR data. Magnetic Resonance in Medicine. 2004;52:979-993.
4.
Lazar M and
A.L. Alexander. An error analysis of white matter tractography
methods: synthetic diffusion tensor field simulations. NeuroImage,
2003;20(2):1140-53.
Figures