3534
Investigating the adverse effect of gradient nonuniformities on diffusion MRI measures: Do we need to worry?1Image Sciences Institute, University Medical Center Utrecht, Utrecht, Netherlands, 2Department of Radiology, University Medical Center Utrecht, Utrecht, Netherlands
Synopsis
Nonuniformities of gradient magnetic fields in diffusion-weighted MRI can introduce systematic errors in estimates of diffusion measures. While there are correction methods that can compensate for these errors, as presented in the Human Connectome Project, such non-linear effects are assumed to be negligible for typical applications and, hence, gradient nonuniformities are mostly left uncorrected. In this work, we evaluated the effect of ignoring such diffusion gradient nonuniformities on measures derived from diffusion tensor imaging. In particular, we simulated deviations from the ground-truth in terms of b-value and diffusion gradient orientation and investigated the resulting bias in fractional anisotropy and orientation of the first eigenvector. Our results demonstrate that not including a correction strategy to mitigate diffusion gradient imperfections especially for high quality data may lead to a significant bias for diffusion measure estimates.
TARGET AUDIENCE
Researchers with an interest in using diffusion-weighted imaging for biomedical and clinical applications.BACKGROUND AND PURPOSE
Nonuniformities of the magnetic field gradients in diffusion-weighted MRI (DWI) can introduce systematic errors in diffusion estimates and, consequently, fiber tractography [1-4]. Despite previous reviews about the effects of gradient nonuniformities and proposed solutions to eliminate the errors [3–6], these effects are usually deemed insignificant and the correction techniques are not implemented. In this work, we investigate the bias in fractional anisotropy (FA) and orientation of the first eigenvector (FE) due to gradient nonuniformities. To this end, we simulate deviations from the ground-truth in terms of b-value and diffusion gradient orientation. Our results indicate that ignoring the adverse effect of gradient nonuniformities especially for high quality data may result in a significant bias for diffusion measure estimates.METHODS
The nonuniformities of gradient magnetic fields result in deviations in the applied gradients [2]. This deviation in the diffusion gradients is decomposed into its angular (α) and magnitude, i.e., b-value, (β) components, i.e.,
$$\alpha=arccos \bigg(\frac{\textbf{g}^T_{nom}(\textbf{r})\textbf{g}_{act}(\textbf{r})}{|\textbf{g}_{nom}(\textbf{r})||\textbf{g}_{act}(\textbf{r})|}\bigg)$$and$$\beta=\big(\frac{|\textbf{g}_{nom}(\textbf{r})|}{|\textbf{g}_{act}(\textbf{r})|} -1\big)×100 $$where $$$\textbf{g}_{act}(\textbf{r})$$$ and $$$\textbf{g}_{nom}(\textbf{r})$$$ represent the actual and nominal gradients at position $$$\textbf{r}$$$, respectively. $$$|\textbf{g}|$$$ denotes the b-value. In this work, we use the methodology presented in [2] to model the nonuniformities in the magnetic field gradient, i.e.,$$\textbf{g}_{act}(\textbf{r})=\textbf{L}(\textbf{r}) \textbf{g}_{nom}(\textbf{r})$$ Here, $$$\textbf{L}(\textbf{r})$$$ denotes the gradient coil tensor at position $$$\textbf{r}$$$, which can be used to calculate the actual gradient vector for each voxel. Figs.1(a-b) show the histograms and spatial variations of the gradient magnitude and angular deviations of the gradient orientation in an example DWI dataset from the Human Connectome Project (HCP) [7]. In order to investigate how the deviations in the gradients propagate into the variations in diffusion estimates, we perform Monte-Carlo simulations from diffusion tensor model [8] with the following parameter settings which are in line with configurations observed in the HCP data set (see Figs.1(a-b)): mean diffusivity (MD)=0.7×10⁻³ mm2/s; FA=0.2, 0.8; SNR=10, 30, $$$\infty$$$ (Noiseless); b=1000 s/mm2; number of gradient directions=60 (distributed uniformly on the unit half-sphere [9]) and the number of non-diffusion weighted images=6. α is changed between 0º and 5º, and β is changed between -10% and 10%. The signals are simulated using the DTI model. The percentage difference in FA $$$(PD_{FA})$$$ and the orientation difference in FE $$$(OD_{FE})$$$ is used to measure the variations.RESULTS
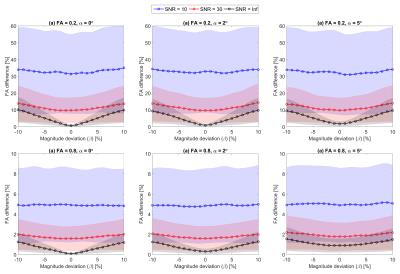
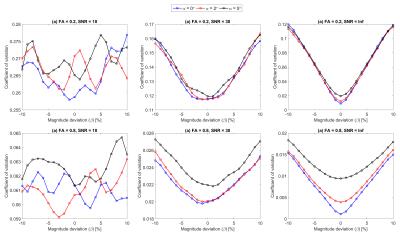
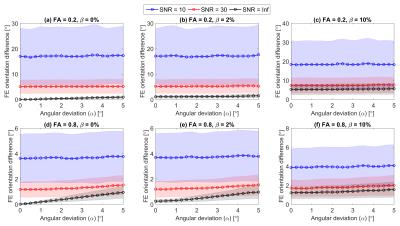
Figs.1(c-d) depict the histograms of the resulting variations in $$$PD_{FA}$$$ and $$$OD_{FE}$$$ for the same dataset as in Figs.1(a-b). Fig.2 shows $$$PD_{FA}$$$ as a function of β at three SNR levels for different combinations of FA and α. It can be inferred from Fig.2 that (i) $$$PD_{FA}$$$ is higher at lower FA values; (ii) $$$PD_{FA}$$$ is higher at lower SNR levels; (iii) there is an offset in $$$PD_{FA}$$$ due to α which is more observable at higher SNR levels or higher FA values; (iv) the increase in the bias and uncertainty due to β is less pronounced at lower SNR levels, for instance the mean $$$PD_{FA}$$$ due to β=5% at FA=0.2 and α=0 has increased by 1.41% (from β=0 reference) at SNR=30 while it has increased by 4.43% for the noise-free case. To emphasize this effect, Fig.3 shows the coefficient of variation for FA as a function of β for different combinations of SNR and α, indicating that the dispersion in FA increases as |β| and α increase. However, the effect of α and β is suppressed by noise at lower SNR levels. Fig.4 depicts $$$OD_{FE}$$$ at three SNR levels for different combinations of FA and β illustrating that the effect of β dominates the effect of α at lower FA values.DISCUSSION AND CONCLUSION
We performed a systematic analysis to investigate the effects of gradient nonuniformities on diffusion measures from DTI model by decomposing the deviations into α and β components. Our results demonstrated that the effect of gradient nonuniformities is more pronounced at higher SNR levels (Figs.2,4) and the dispersion in FA is higher for lower FA values (Fig.3). Moreover, the study of the interaction between α and β (Figs.3,4) indicated that the effect of β is dominant over the effect of α at lower FA values. Our findings imply that ignoring the effect of gradient imperfections is more problematic for high SNR acquisition systems and high quality data. The gradient nonuniformities may be ignored for typical datasets because the effect of these imperfections are swamped by noise. However, as the acquisition strategies/hardware improve and high quality data become more accessible (e.g. HCP), correcting for these effects becomes more significant to avoid the confounding bias in scientific findings.Acknowledgements
This research is supported by VIDI Grant 639.072.411 from the Netherlands Organisation for Scientific Research (NWO).References
[1] Conturo, T.E., McKinstry, R.C., Aronovitz, J.A., Neil, J.J.: ‘Diffusion MRI: Precision, accuracy and flow effects’NMR Biomed., 1995, 8, (7), pp. 307–332.
[2] Bammer, R., Markl, M., Barnett, A., et al.: ‘Analysis and generalized correction of the effect of spatial gradient field distortions in diffusion-weighted imaging’Magn. Reson. Med., 2003, 50, (3), pp. 560–569.
[3] Sotiropoulos, S.N., Jbabdi, S., Xu, J., et al.: ‘Advances in diffusion MRI acquisition and processing in the Human Connectome Project’Neuroimage, 2013, 80, pp. 125–143.
[4] Borkowski, K., Klodowski, K., Figiel, H., Krzyzak, A.T.: ‘A theoretical validation of the B-matrix Spatial Distribution approach to Diffusion Tensor Imaging’Magn. Reson. Imaging, 2016.
[5] Janke, A., Zhao, H., Cowin, G.J., Galloway, G.J., Doddrell, D.M.: ‘Use of spherical harmonic deconvolution methods to compensate for nonlinear gradient effects on MRI images’Magn. Reson. Med., 2004, 52, (1), pp. 115–122.
[6] Malyarenko, D.I., Ross, B.D., Chenevert, T.L.: ‘Analysis and correction of gradient nonlinearity bias in apparent diffusion coefficient measurements’Magn. Reson. Med., 2014, 71, (3), pp. 1312–1323.
[7] Van Essen, D.C., Ugurbil, K., Auerbach, E., et al.: ‘The Human Connectome Project: A data acquisition perspective’Neuroimage, 2012, 62, (4), pp. 2222–2231.
[8] Basser, P.J., Mattiello, J., LeBihan, D.: ‘MR diffusion tensor spectroscopy and imaging.’Biophys J, 1994, 66, (1), pp. 259–267.
[9] Jones, D.K., Horsfield, M.A., Simmons, A.: ‘Optimal strategies for measuring diffusion in anisotropic systems by magnetic resonance imaging.’Magn. Reson. Med., 1999, 42, (3), pp. 515–25.
Figures


