3532
Prediction of the cognitive performance among Type 2 diabetes mellitus patients: a multivariable pattern analysis of Diffusion Tensor Imaging data1School of Mechanical, Electrical & Information Engineering, Shandong University (Weihai), Weihai, People's Republic of China, 2Key Laboratory of Molecular Imaging, Institute of Automation, Chinese Academy of Sciences, Beijing, People's Republic of China, 3Cooperative Innovation Center of Internet Healthcare, Zhengzhou University, Zhengzhou, People's Republic of China
Synopsis
In the current study, we employed multivariate pattern analysis method together with Diffusion Tensor Imaging measures to make prediction on the cognitive performance of Type 2 diabetes mellitus (T2DM) patients, and explore the white matter tracts associated with cognitive changes in T2DM. The prediction model obtained relatively satisfying performance in the Montreal Cognitive Assessment (MoCA) scores estimation among T2DM patients, suggesting the effectiveness of the multivariable analysis method. The white matter identified in the current study mainly concerned the tracts closely related with cognitive function and memory performance, which were consistent with the finding of previous T2DM cognitive studies.
Purpose
To construct a prediction model of the cognitive performance among Type 2 diabetes mellitus patients with the Diffusion Tensor Imaging parameters, and identify the white matter tracts relevant to cognitive changes.Introduction
Type 2 diabetes mellitus (T2DM) is associated with cognitive decline and a twofold increased risk of dementia. Early detection of the cognitive decline would help to identify the T2DM patients with high risk of dementia and improve the treatment and prognosis. It had been reported that the cognitive dysfunction in T2DM was closely related with the white matter impairments in the external capsule, internal capsule, sagittal striatum, and uncinate fasciculus1,2. Previous study also found that the DTI measures in the cingulum of the hippocampus regions were directly associated with the cognitive status of T2DM patients3. In the current study, we utilized multivariate pattern analysis method together with Diffusion Tensor Imaging (DTI) to make prediction on the cognitive performance of T2DM patients, and explore the white matter tracts associated with cognitive changes in T2DM.Methods
93 T2DM patients from Henan Provincial People’s Hospital were recruited in the current study. All the patients were treated with regular hypoglycemic agents and were exclusive of history of alcohol or substance abuse. Demographic and clinical characteristics, including age, Body Mass Index (BMI), Fasting Glucose (FG), Hemoglobin A1c (HbA1c), disease duration and education-adjusted Montreal Cognitive Assessment (MoCA) scores were obtained for each subject. MoCA test was used to assess the general cognitive performance of the patients. All the MRI scans, including structural T1 imaging and Diffusion Tensor Imaging, were obtained on a Magnetom Trio 3.0T scanner. We carried out the following analysis to construct a cognitive performance prediction model and investigate the white matter tracts related to the cognitive performance of T2DM patients. For each subjects, the averaged Fractional Anisotropy (FA), Axial Diffusivity (AD), Radius Diffusivity (RD), Mean Diffusivity (MD) values were calculated in the 50 white matter tracts defined in the International Consortium for Brain Mapping DTI-81 (ICBM DTI-81) white matter labels atlas4. The FMRIB Software Library (FSL, FMRIB, Oxford, UK)5-7 was used in the DTI data processing. Then, we construct a linear model to estimate the individual MoCA scores. 200 Diffusion measures, age, BMI, FG, HbA1c and disease duration were fed into the model as features. Feature selection and model coefficient estimation were achieved by the Elastic-Net penalty and penalized least squares approach, which was built in Glmnet8. The features contributing to MoCA score estimation would be selected in the model. The MoCA scores estimation were obtained by 10 folds cross-validation. The performance of the model was assessed by the Pearson Correlation Coefficients and the mean absolute error (MAE) between the actual and estimated MoCA Scores. We also carried out a permutation test to estimate the significance of the model performance.Results
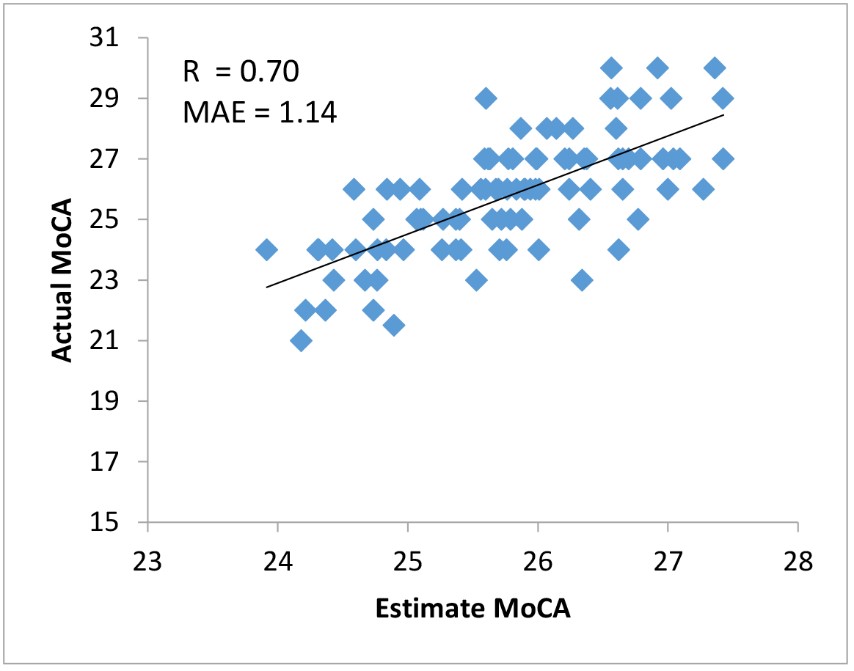
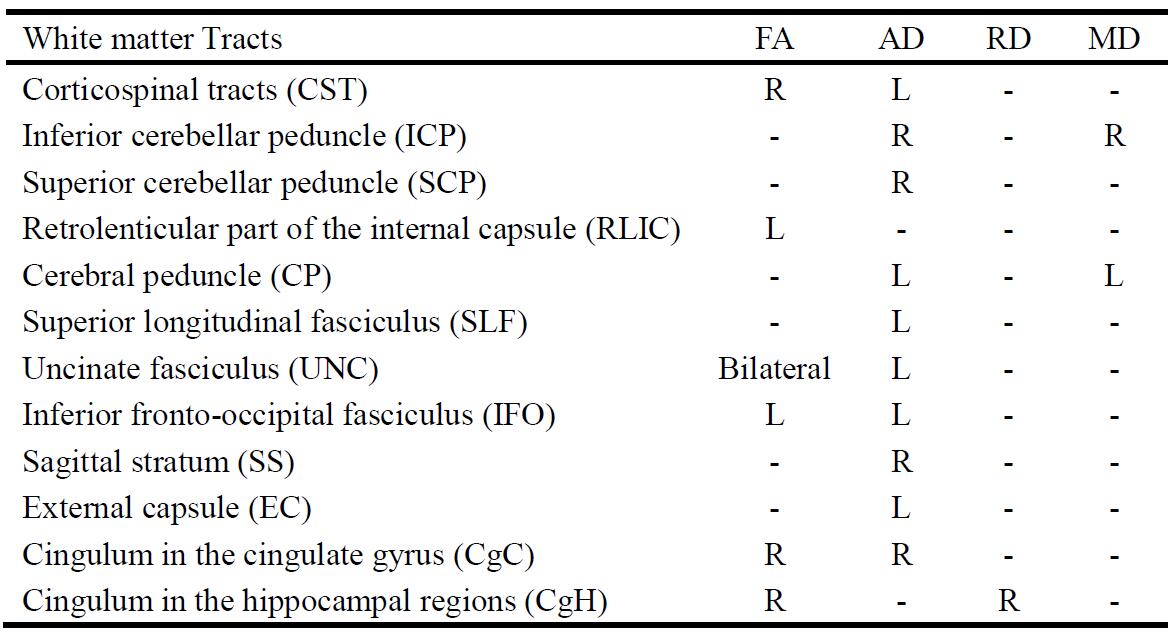
The prediction model obtained relatively satisfying performance in the MoCA estimation. The Pearson Correlation coefficients between the estimated and actual MoCA were 0.70 (P=0.002), and the MAE was 1.14 (Fig.1). The selected features included age, BMI and 20 Diffusion measures in a variety of white matter tracts. The identified white matter were mainly located in the tracts connecting frontal, temporal and parietal lobes (Table.1).Discussion
In the current study, we aimed to predict the cognitive performance of T2DM patients based on the DTI measures, and identify the white matter tracts associated with cognitive performance in T2DM. The prediction model achieved relatively satisfying performance, indicating the close relationship between the integrity of the selected white matter tracts and the cognitive performance in T2DM. The white matter identified in the current study mainly concerned the tracts closely related with cognitive function and memory performance, which were consistent with the finding of previous T2DM cognitive studies1,9. It suggested the effectiveness of the multivariable analysis method. In addition to the white matter tracts, age and BMI were also found associated with cognitive performance, which might indicate that aging and obesity would exacerbate the cognitive decline of T2DM patients.Conclusions
The relative satisfying prediction performance of the current model indicated that the DTI provided a potential tool to predict the cognitive performance among T2DM patients. The results of the current study also suggested that the integrity of the selected white matter tracts played an important role in the cognitive performance changes of T2DM patients.Acknowledgements
This study was supported by the National Natural Science Foundation of China (Grant No. 81371635, 81501549,81671848), the Key Research Program of the Chinese Academy of Sciences under Grant NO. KGZD-EW-T03, the Natural Science Foundation of Beijing under Grant NO. 7132108, the Beijing Municipal Administration of Hospitals Clinical Medicine Development of Special Funding Support under Grant NO. ZYLX201511, the capital health research and development of special under Grant NO. 2011-2018-01. The authors also would like to express their deep appreciation to all anonymous reviewers for their kind comments.References
1. Reijmer Y D, Brundel M, De Bresser J, et al. Microstructural white matter abnormalities and cognitive functioning in type 2 diabetes A diffusion tensor imaging study. Diabetes care, 2013, 36(1): 137-144.
2. Zhang J, Wang Y, Wang J, et al. White matter integrity disruptions associated with cognitive impairments in type 2 diabetic patients. Diabetes, 2014, 63(11): 3596-3605.
3. Xiong Y, Sui Y, Xu Z, et al. A Diffusion Tensor Imaging Study on White Matter Abnormalities in Patients with Type 2 Diabetes Using Tract-Based Spatial Statistics. American Journal of Neuroradiology, 2016.
4. Mori S, Oishi K, Jiang H, et al. Stereotaxic white matter atlas based on diffusion tensor imaging in an ICBM template. Neuroimage, 2008, 40(2): 570-582.
5. Woolrich M W, Jbabdi S, Patenaude B, et al. Bayesian analysis of neuroimaging data in FSL. Neuroimage, 2009, 45(1): S173-S186.
6. Smith S M, Jenkinson M, Woolrich M W, et al. Advances in functional and structural MR image analysis and implementation as FSL. Neuroimage, 2004, 23: S208-S219.
7. Smith S M. Fast robust automated brain extraction. Human brain mapping, 2002, 17(3): 143-155.
8. Friedman J, Hastie T, Tibshirani R. Regularization paths for generalized linear models via coordinate descent. Journal of statistical software, 2010, 33(1): 1.
9. Van Bloemendaal L, Ijzerman R G, Jennifer S, et al. Alterations in white matter volume and integrity in obesity and type 2 diabetes. Metabolic brain disease, 2016, 31(3): 621-629.
Figures