3531
Reduction of Partial Volume Effects Using Diffusion-Kurtosis-Informed Template Improves the Atlas-Based Between-Group Comparison in Diffusion Kurtosis Imaging1Institute of Neuroscience and Medicine 4, Research Centre Jülich, Jülich, Germany, 2Department of Neurology, Faculty of Medicine, RWTH Aachen University, Aachen, Germany, 3Child Neuropsychology Section, Department of Child and Adolescent Psychiatry and Psychotherapy, RWTH Aachen University, Aachen, Germany, 4Institute of Neuroscience and Medicine 3, Research Centre Jülich, Jülich, Germany, 5Department of Psychiatry, Psychotherapy and Psychosomatics, RWTH Aachen University, Aachen, Germany, 6JARA - BRAIN - Translational Medicine, RWTH Aachen University, Germany
Synopsis
Frequently used methods in between-group comparisons of diffusion tensor and diffusion kurtosis imaging metrics, such as region-of-interest analysis or atlas-based analysis, are subject to errors due to partial volume effects. In this work we demonstrate that the application of a simple diffusion-kurtosis-informed template significantly reduces partial volume effects and, in turn, improves the between-group atlas-based analysis. In particular, a better differentiation of diffusion metrics was achieved in the study of a group of children versus a group of adults.
Purpose
Diffusion tensor (DTI) and diffusion kurtosis (DKI) imaging metrics are influenced by cellular tissue properties and tend to alter significantly during the life span, or as a result of neurodegenerative diseases. Therefore they are often used in between-group comparisons of patients versus control groups and for studying correlations with age. Popular methods for group comparisons include region-of-interest (ROI) analysis1, voxel-based whole brain analysis2, and track-based spatial statistics3 (TBSS). However, each of these methodologies is subject to specific problems reducing its statistical power or sensitivity. In particular, the ROI-based analysis requires manual, and, therefore, user biased time-consuming delineation of the ROIs leading to large inter-subject variability. The atlas-based segmentation attempts to overcome these difficulties by using automatic delineation of the ROIs by means of co-registration of the subject- and atlas-spaces. However, misregistration and various distortions lead to significant partial-volume effects4 (PVE). PVE are especially crucial when white matter (WM) ROIs appear contaminated by voxels belonging to grey matter (GM) or cerebrospinal fluid (CSF). Therefore, automatic atlas-based segmentation is prone to errors diminishing its accuracy. An alternative approach, TBSS, attempts to overcome misregistration problems by skeletonising WM and considering only a small fraction of voxels of the mean fractional anisotropy (FA) skeleton at the price of significant reduction of potentially useful information from other voxels. The purpose of this work was to demonstrate that the application of a simple, robust diffusion-kurtosis-informed template (D-KIT) is able to essentially reduce contamination of WM ROIs by PVE from neighbouring non-WM (GM and CSF) regions at tissue interfaces, and improves atlas-based between-group comparisons. The application is demonstrated in DKI study of a group of children versus a group of adults.Materials and Methods
Two groups of healthy volunteers, 20 children (range, 9-12 years) and 21 adults (range, 38–64 years, middle age) underwent DKI. The measurements were performed with a whole-body 3T Siemens MAGNETOM scanner. Typical DTI/DKI metrics (mean (MD), axial, and radial diffusivity, fractional anisotropy (FA), mean (MK), axial, and radial kurtosis, kurtosis anisotropy) were determined on a voxel-by-voxel basis in the whole brain and averaged over 20 WM anatomic regions provided by John-Hopkins-University (JHU) WM tractography atlas available in FSL. The results of the DKI study before the application of D-KIT have been recently published5.Results and Discussion
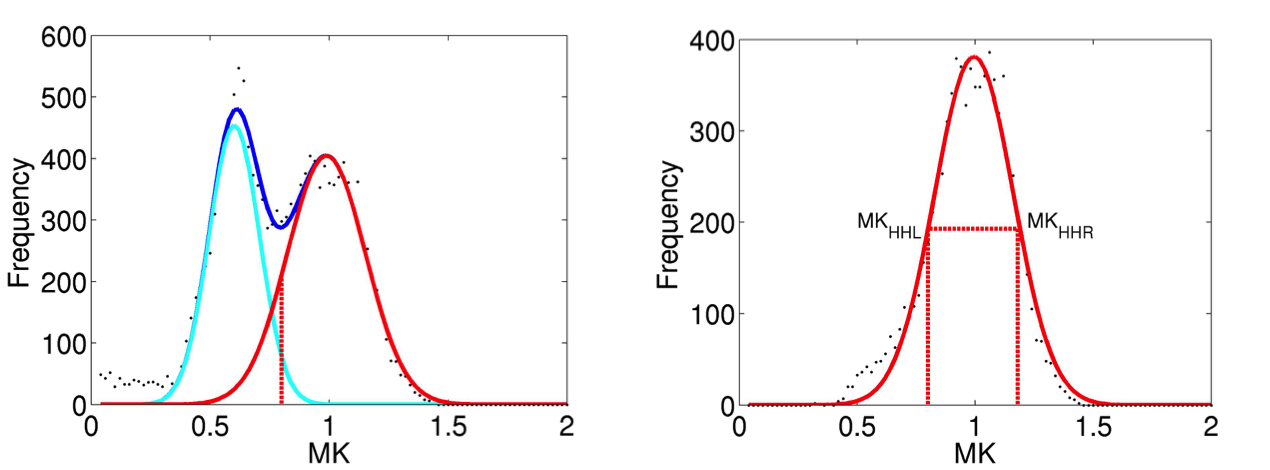
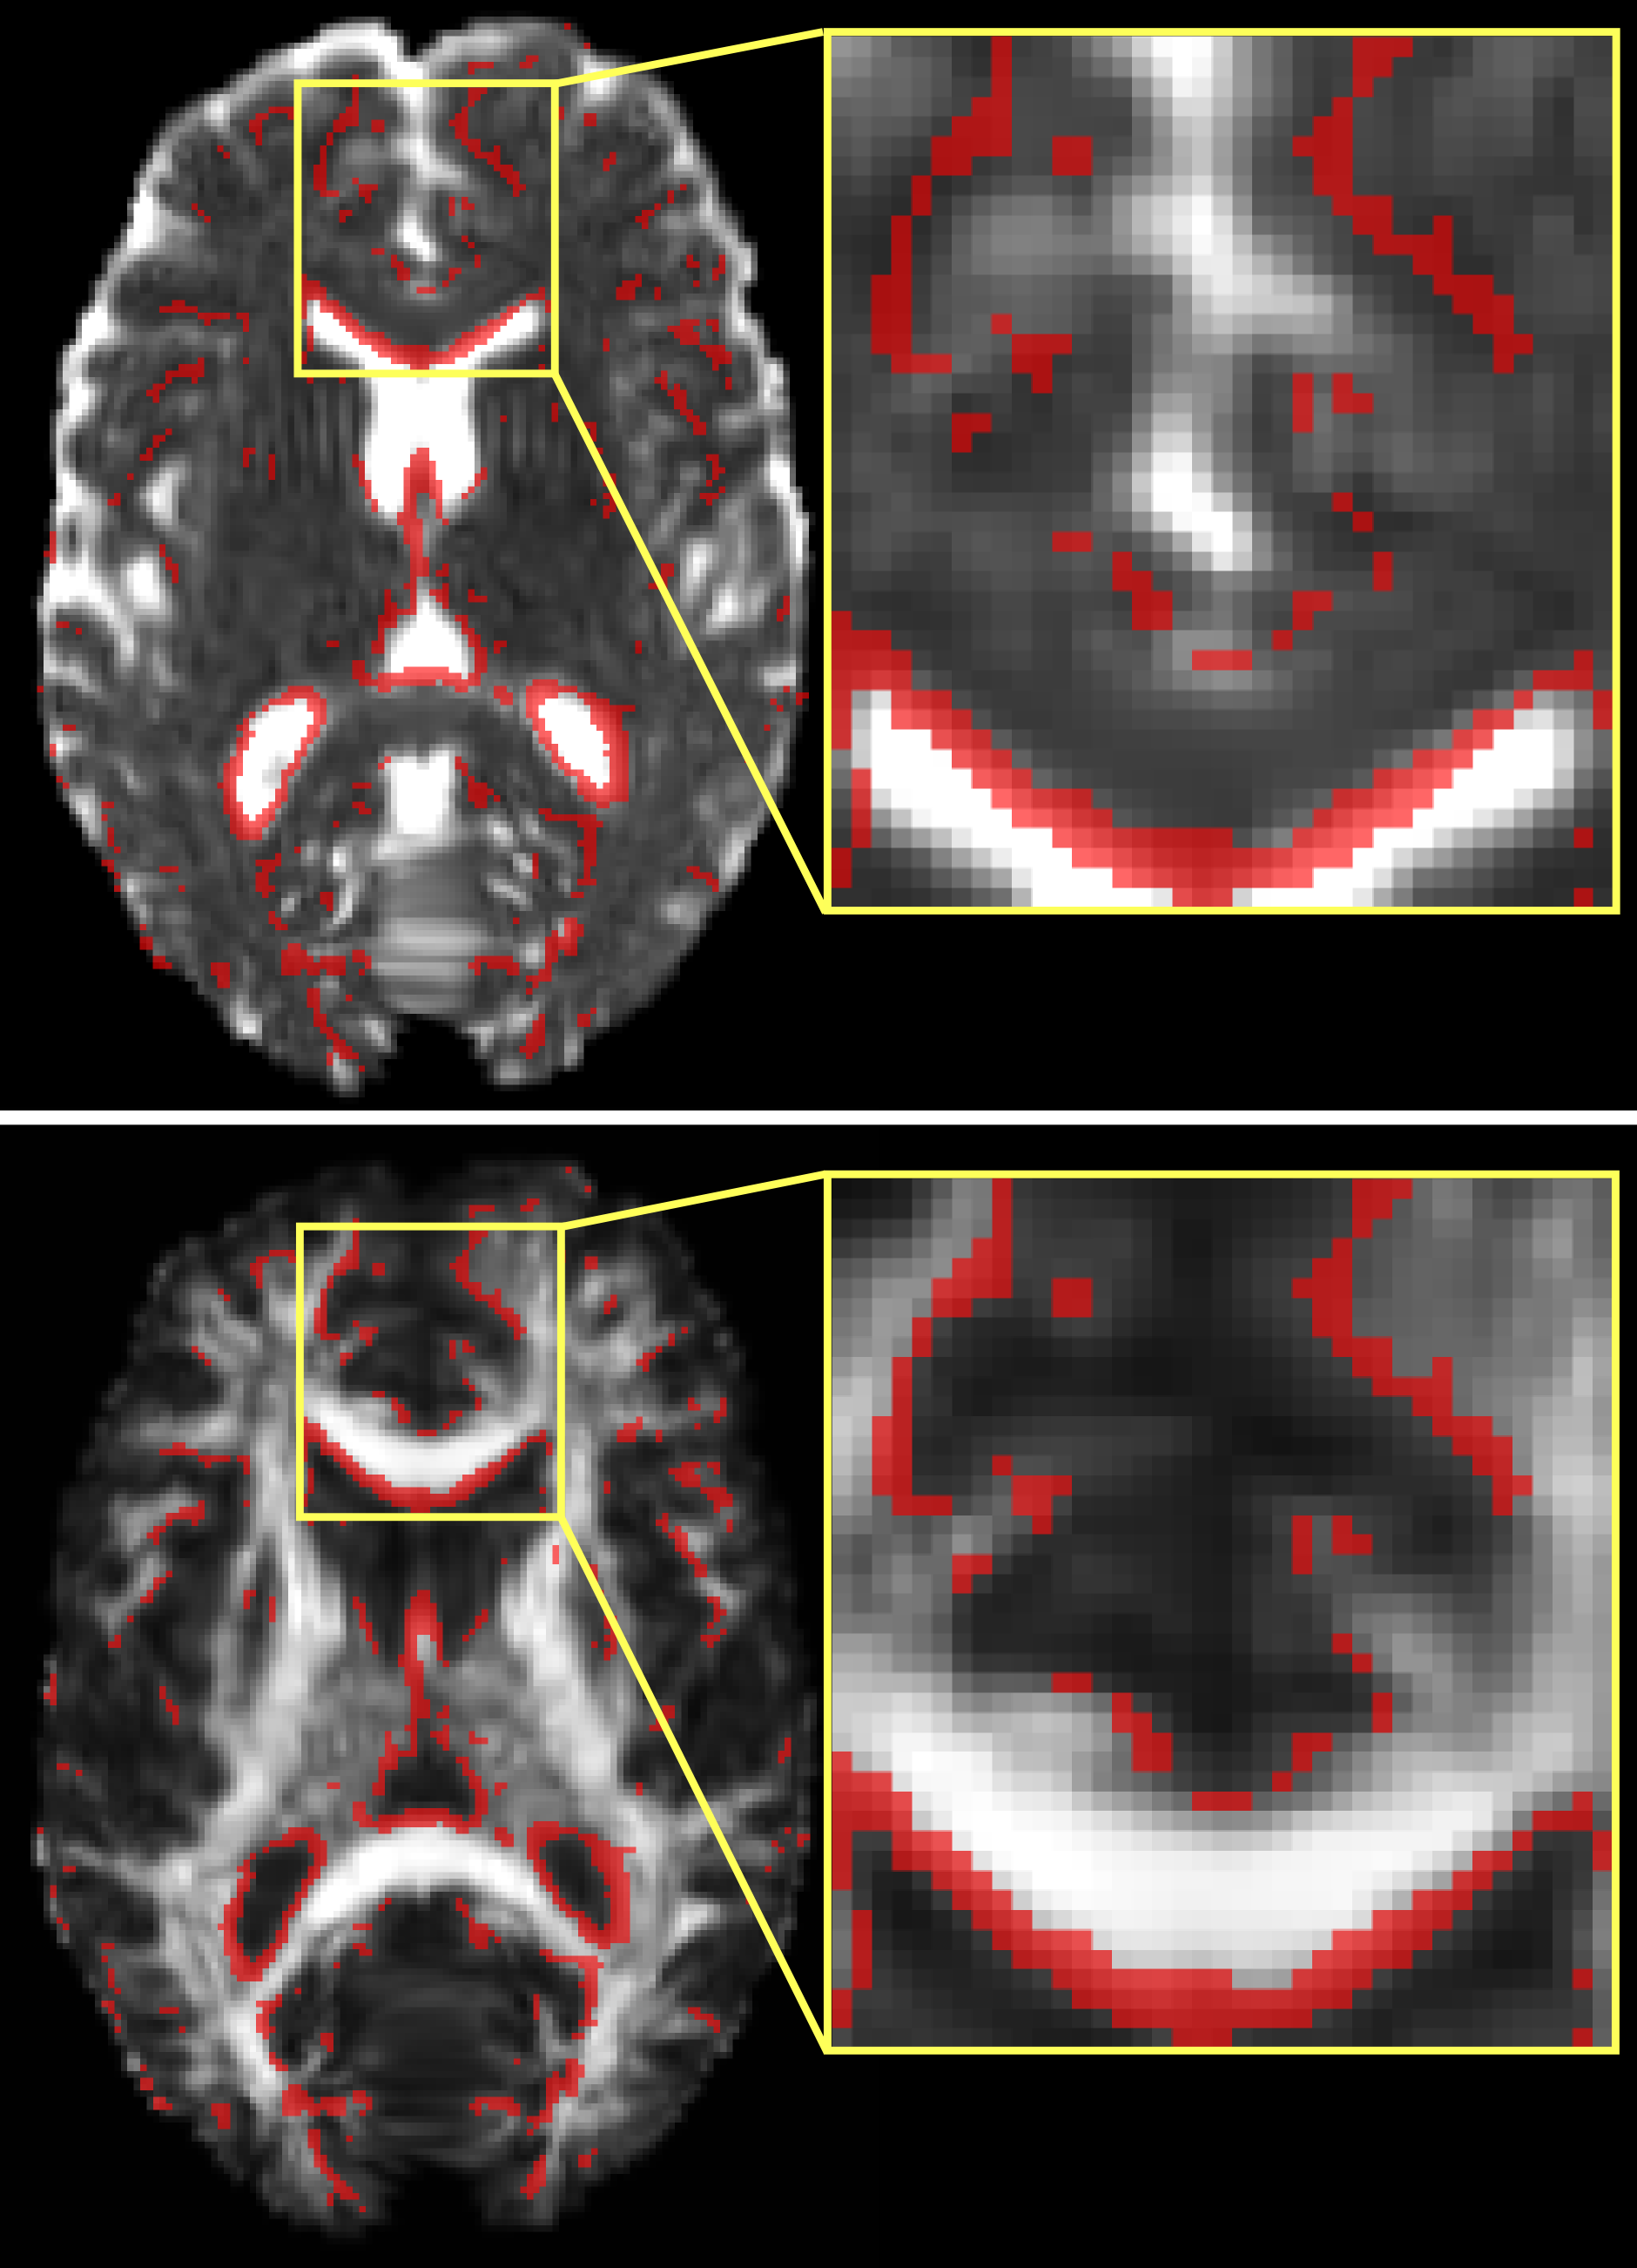
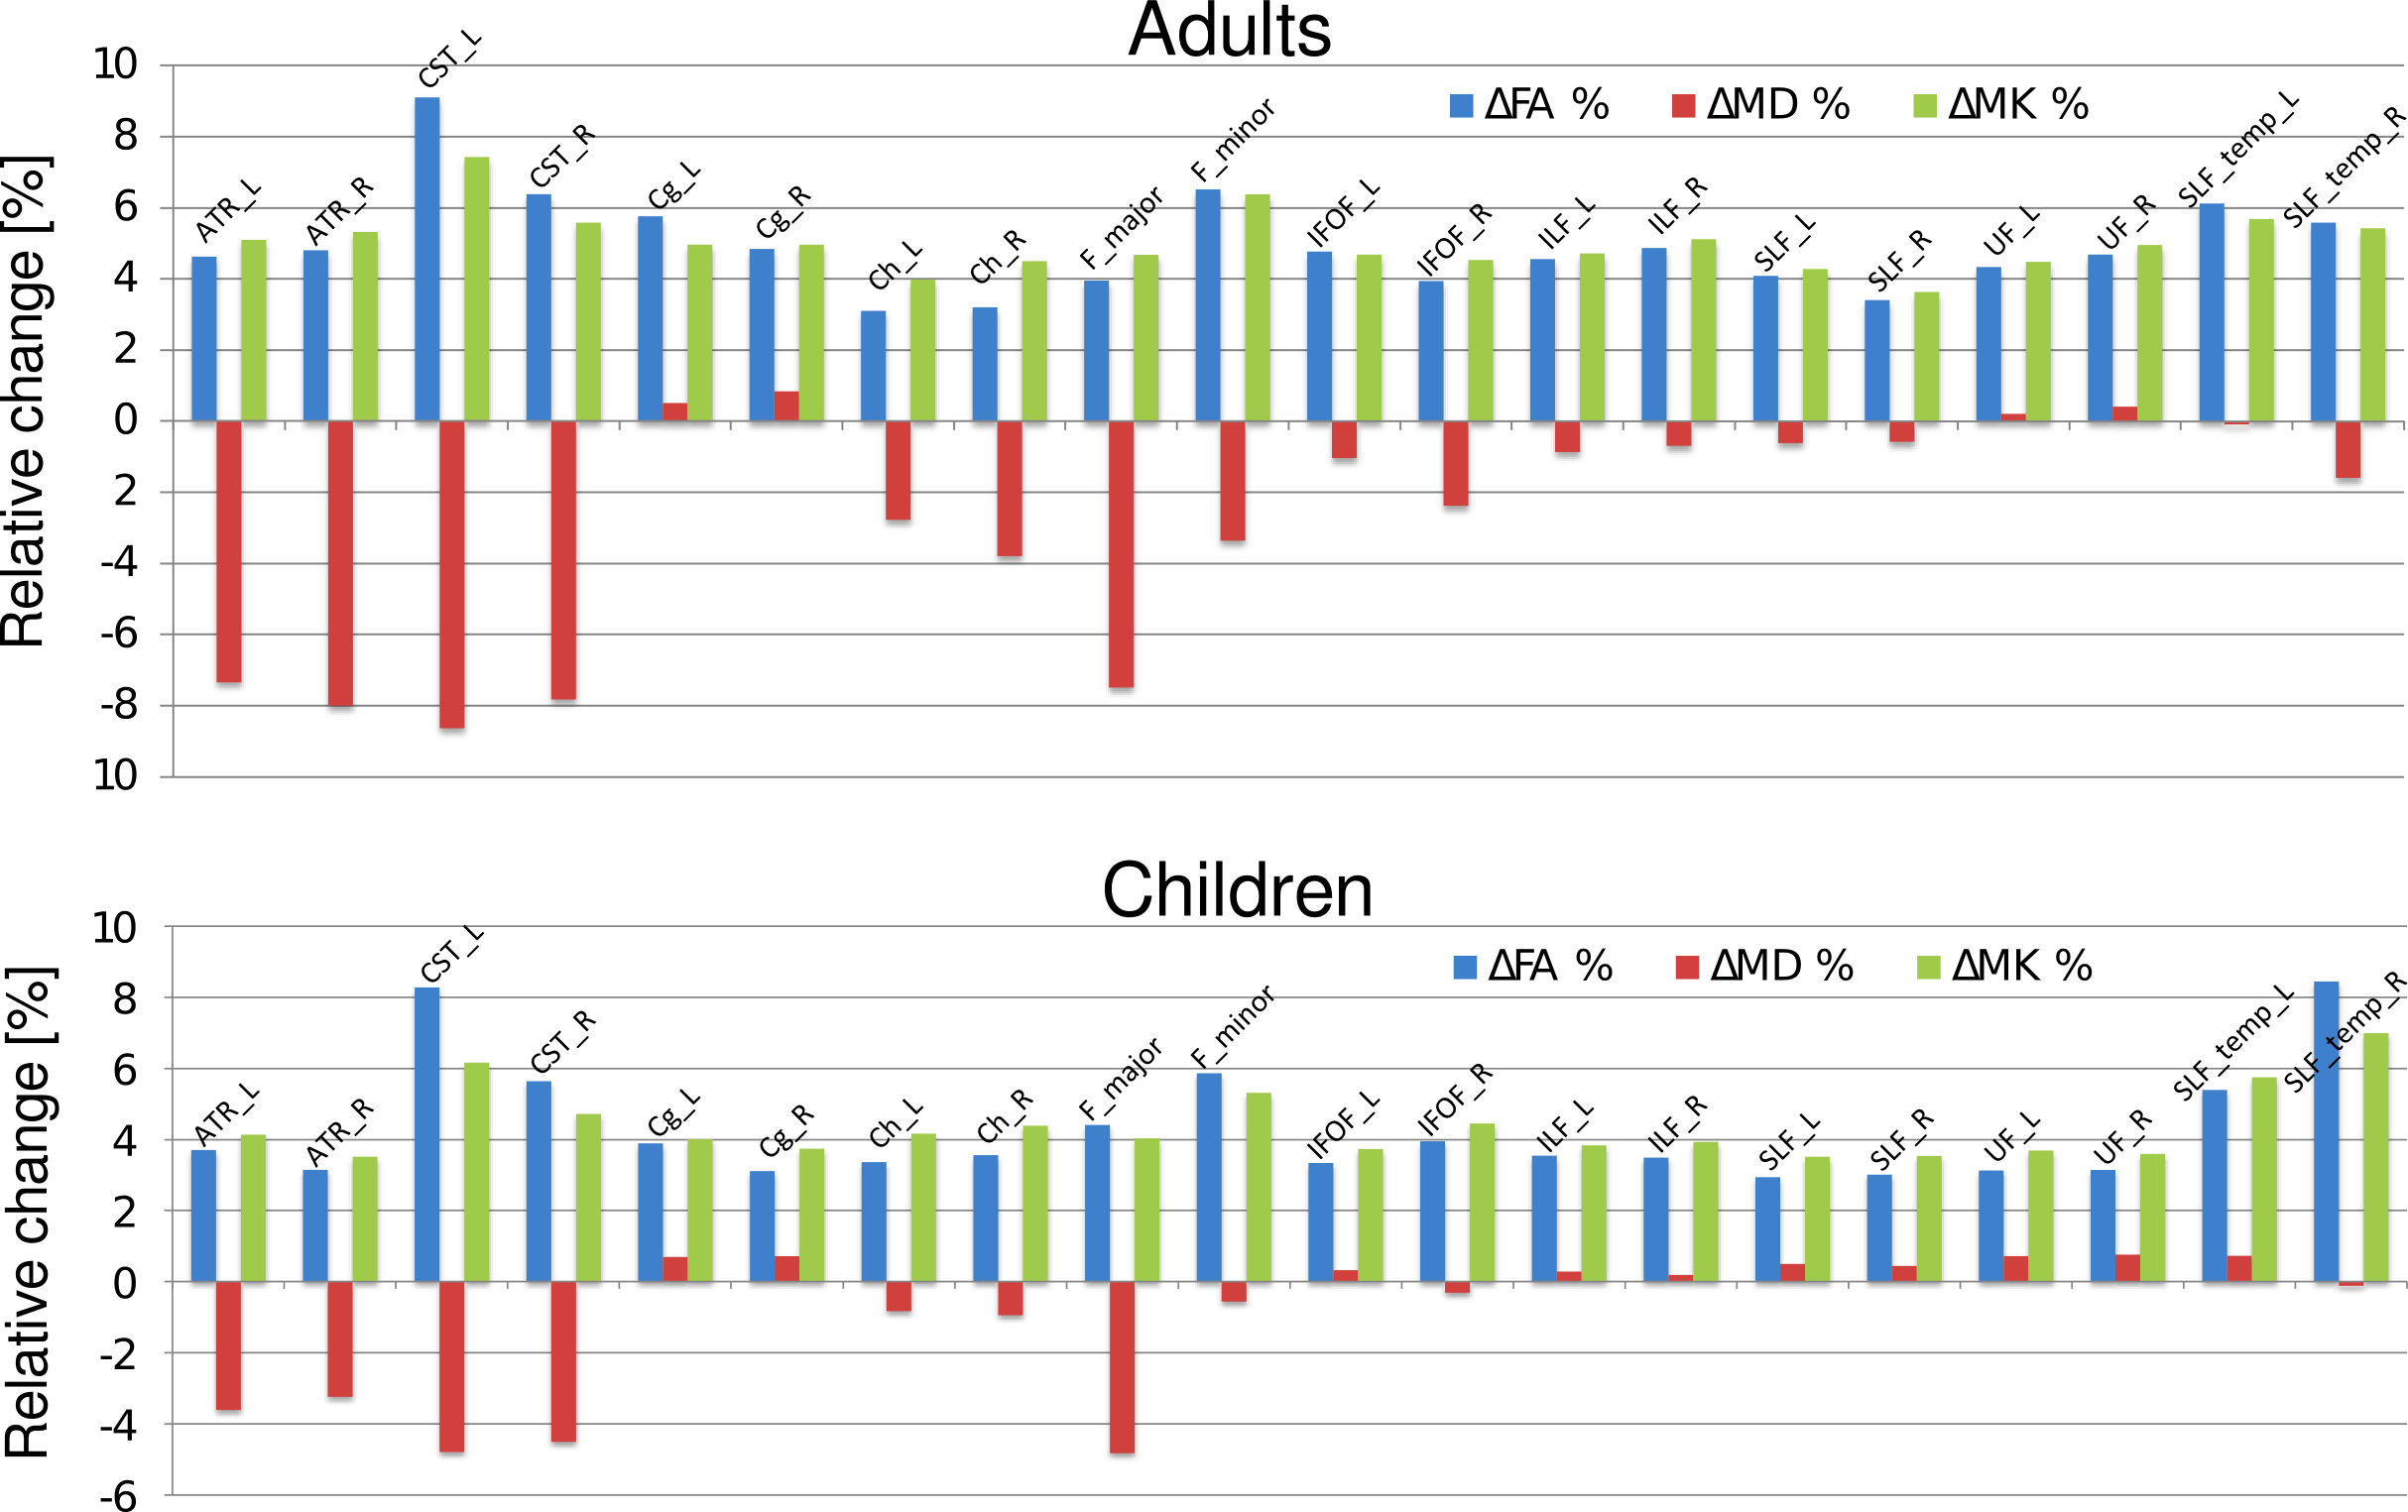
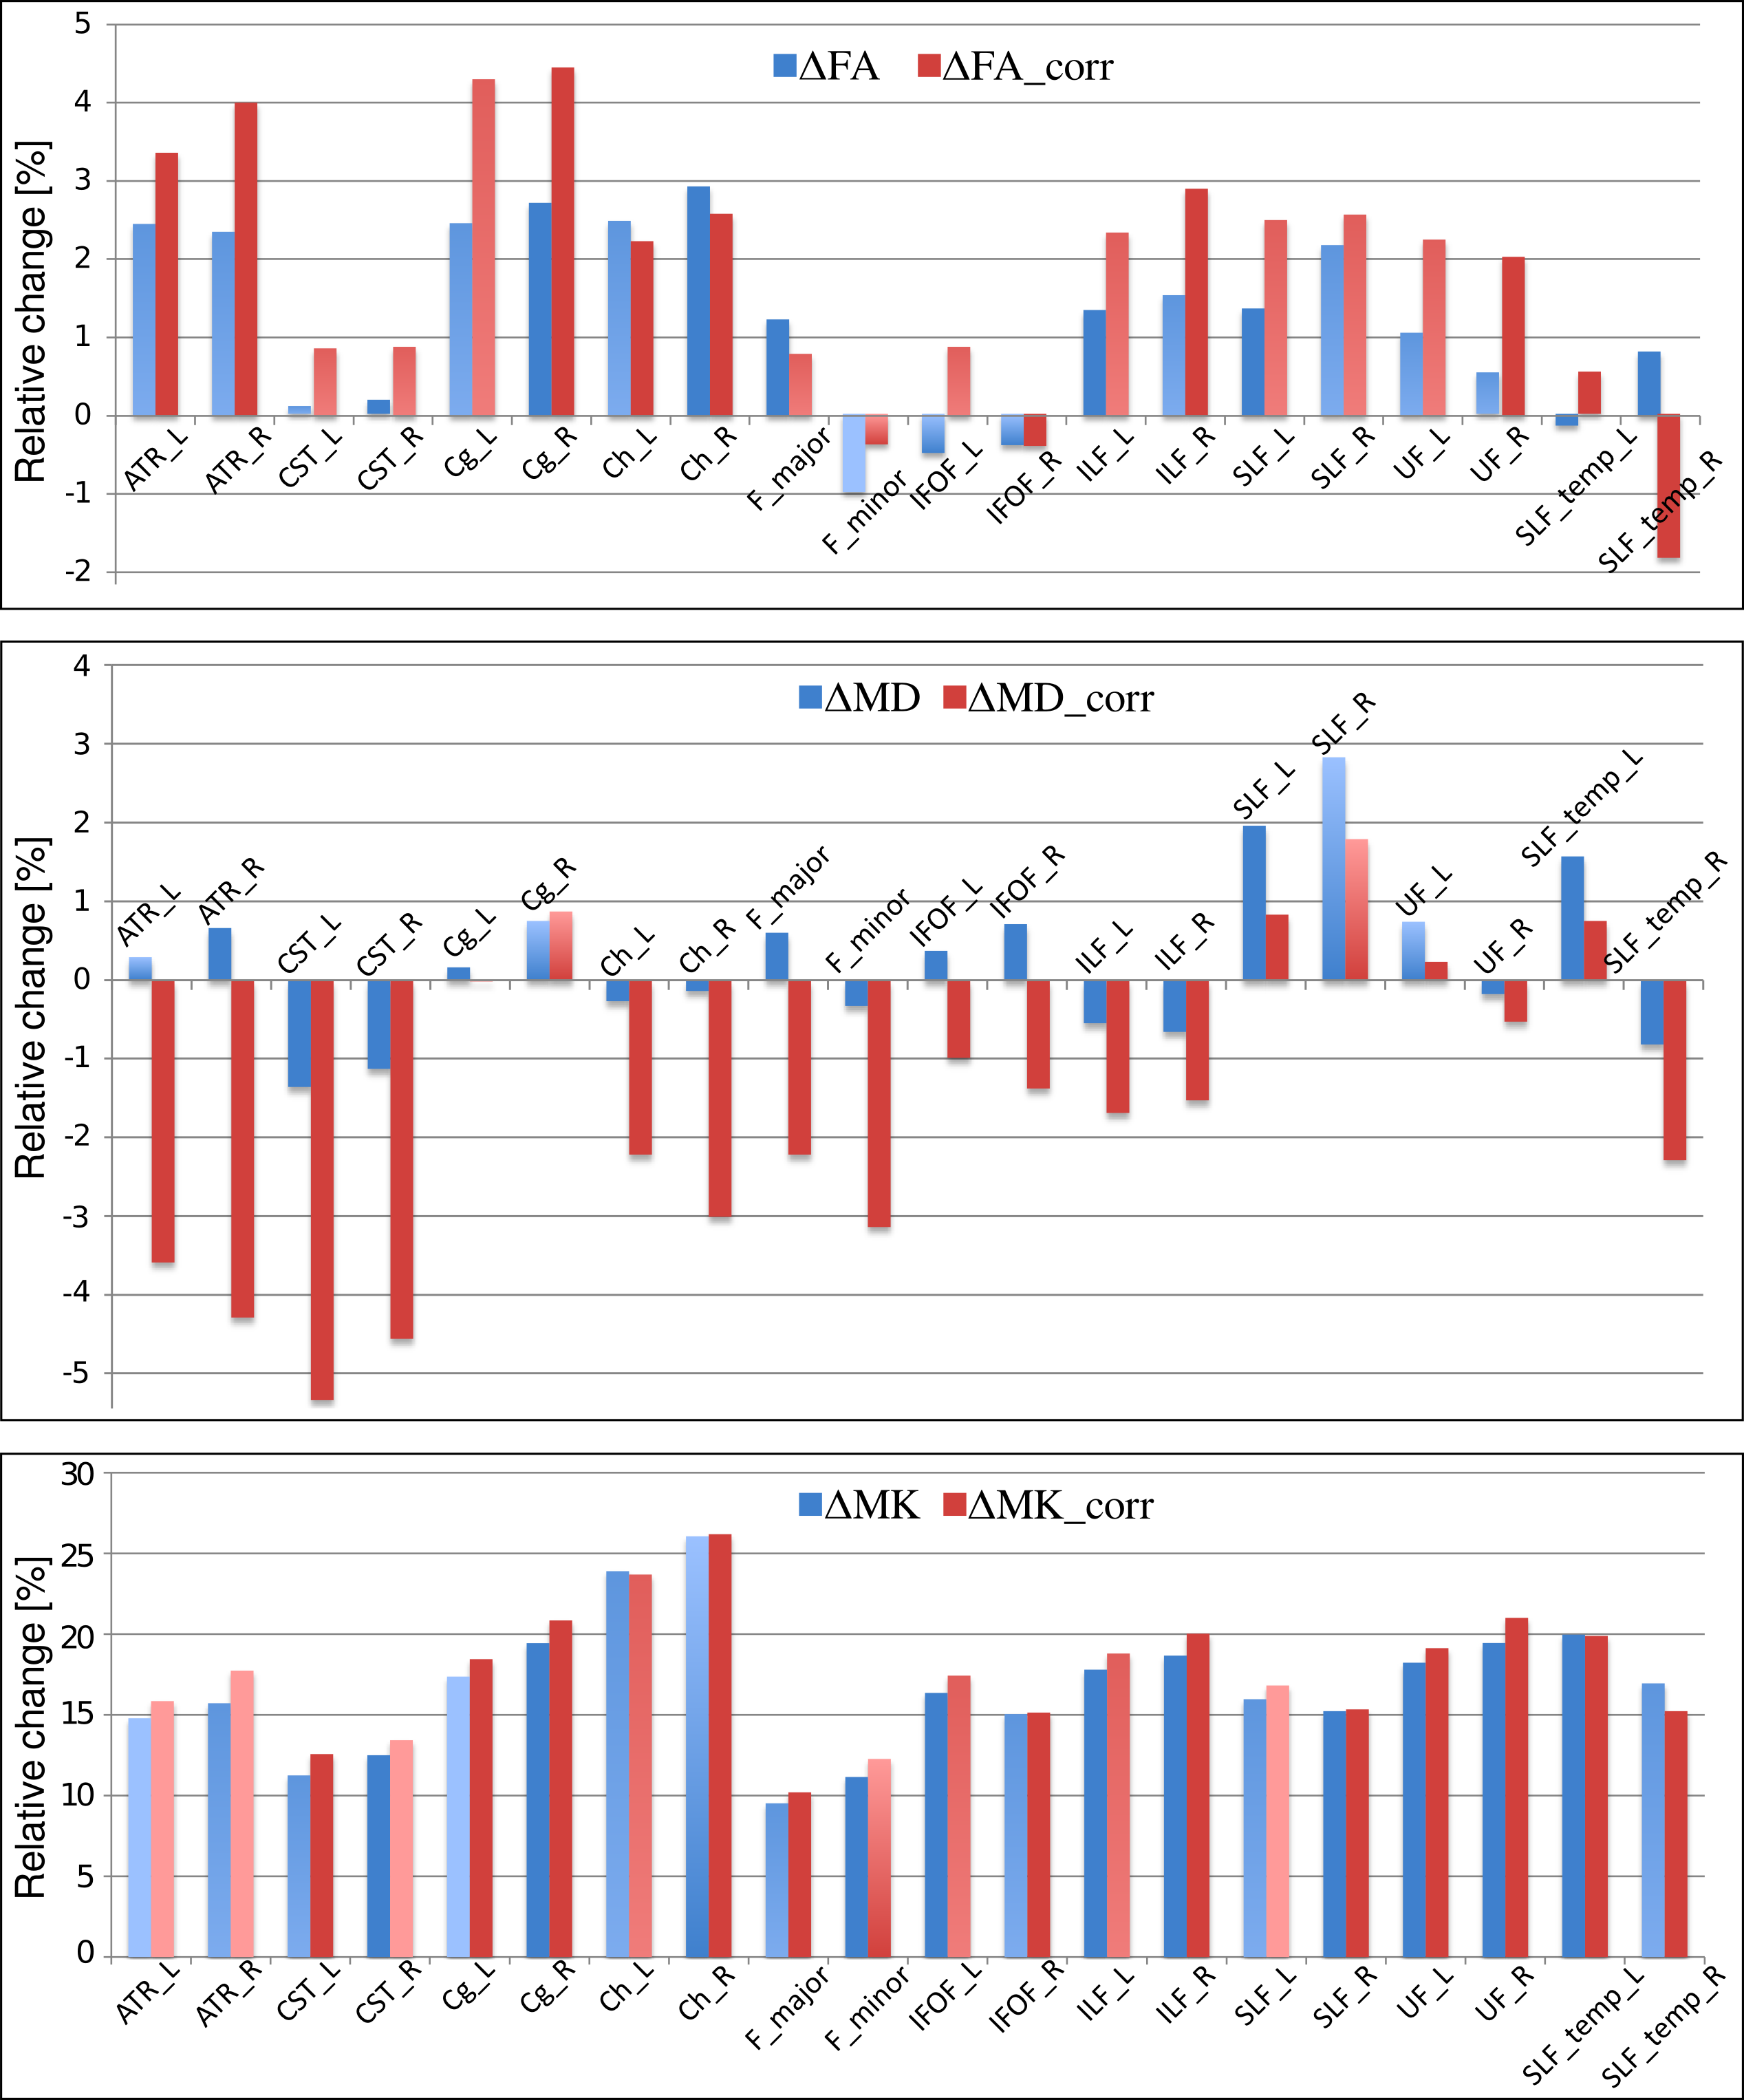
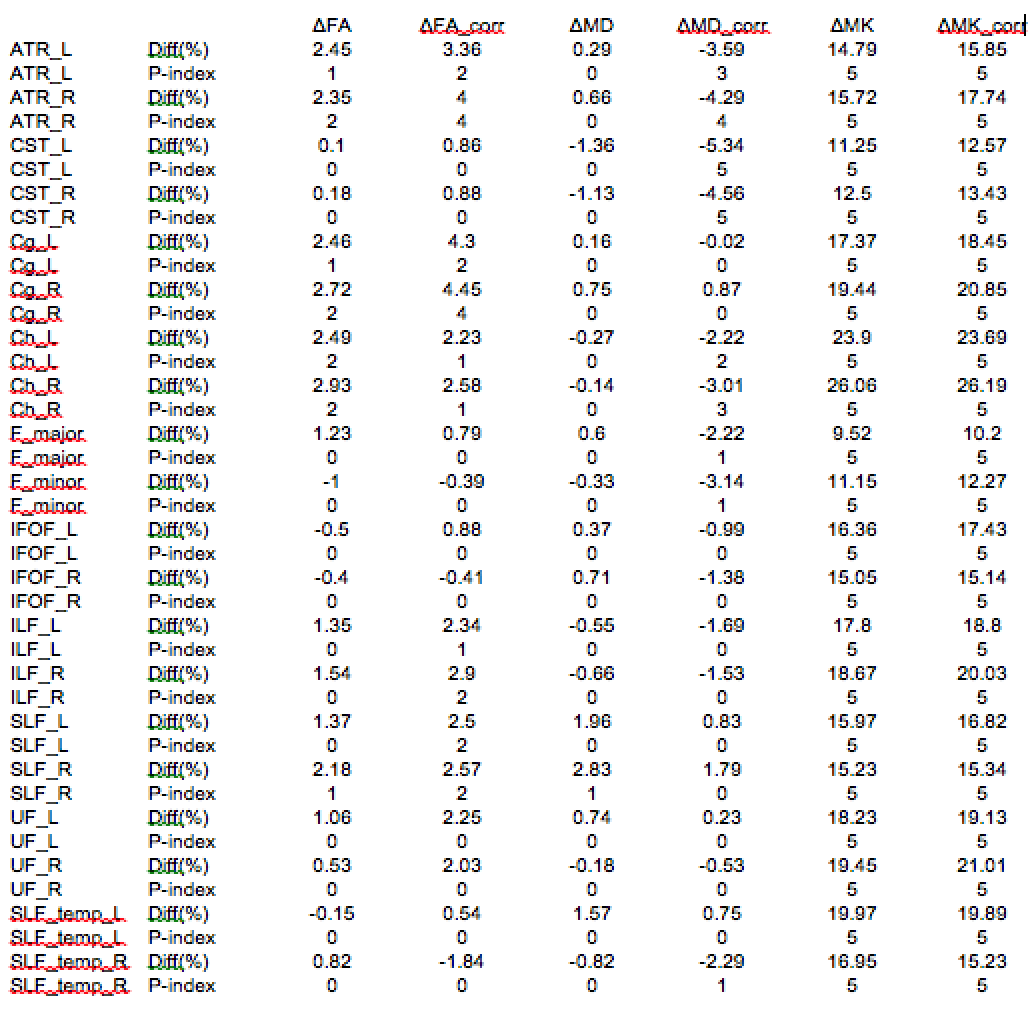
The construction of the D-KIT is based on a combination of the two complementary tresholds: a) FA > FAtresh (conventionally set to 0.2), and b) MK > MKtresh. MKtresh is determined based on MK histograms which, given the mixture of WM and non-WM tissues, exhibit a characteristic double-Gaussian shape6: the low-peak and high-peak components are attributed (predominantly) to non-WM, and WM, respectively. However, the histograms also exhibit the overlap area, which can be representative of both WM and non-WM voxels. The threshold on MK should eliminate such voxels from the analysis. Determination of MKtresh can be formalised as the MK value at the lower half height (MKHHL) of the high-peak component of the double-Gaussian function fitted to the MK histogram, as shown in Figure 1. (Typical examples of MK histograms with fits can also be found in Fig.10 of the Ref.6). The D-KIT is then applied with all parameter maps. Figure 2 illustrates an example of D-KIT application in one individual slice. Clearly, the contours of excluded voxels (highlighted) tend to replicate the boundaries between WM and GM, and the boundaries of the CSF spaces. Elimination of such voxels located at the interfaces of WM and non-WM from the analysis should obviously reduce PV averaging in the WM regions. Indeed, Figure 3 demonstrates how the mean parameter values in 20 WM anatomic regions, averaged over each group, have changed after correction with D-KIT: FA and MK have significantly (p<0.05) increased and MD has decreased (or showed non-significant changes), reflecting reduced contamination by CSF/GM. Figure 4 and Table 1, in turn, demonstrate the results of between-group comparison after corrections with D-KIT. In MK, the differences exhibited large magnitudes (10-25%) and were highly significant (p ≤ 0.00001) before and after correction. In MD and FA, we observed larger magnitude of differences and improved statistical significance in several fibres after correction, especially, regarding MD, which showed significant between-group differences in one anatomy before the D-KIT correction versus nine anatomies thereafter.Conclusion
We demonstrate that a simple, robust template based on diffusion-kurtosis properties of WM and non-WM tissues can efficiently reduce PVE and improve the results of between-group comparisons in the atlas-based analysis. The template is suited for diffusion protocols enabling DKI, but does not require additional measurements.Acknowledgements
No acknowledgement found.References
[1] Snook L., Plewes C., and Beaulieu,C. Neuroimage 2007, 34:243-252.
[2] Li, Z., Zhu H., et al., Proc IEEE Int Symp Biomed Imaging, 2009, 807-810.
[3] Smith S.M., Jenkinson M., et al. Neuroimage 2006, 31:1487–1505.
[4] Vos, S.B., Jones D.K., et al. Neuroimage 2011, 55:1566-1576.
[5] Grinberg, F., Maximov I.I., et al., Neuroimage 2016, doi: 10.1016/j.neuroimage.2016.08.033, epub ahead of print.
[6] Grinberg, F., Farrher E., et al., Neuroimage 2011, 57:1087-1102.
Figures