3530
Brain correlates of apathy in Kleine Levin syndrome: a mean apparent propagator study1Institut Cerveau Moelle – ICM,CENIR, ICM, Inserm – UPMC U1127, CNRS 7225, Paris, France, 2Service des pathologies du sommeil, Hôpital de la Pitié Salpétrière, France, 3Université Côte d'Azur, INRIA, France
Synopsis
Kleine-Levin syndrome (KLS) is a rare neurological disorder characterized by episodes of severe hypersomnia, apathy, cognitive impairment, derealization and behavioral disturbances. Between episodes, patients have normal sleep, mood and behavior. Apathy is a prominent clinical feature of KLS but its pathophysiology is not known. Here we used mean apparent propagator to investigate white matter changes in KLS and correlated diffusion changes with apathy scores. Results showed that the corpus callosum was involved in KLS during episodes and mean RTAP measures in the corpus callosum correlated with apathy scores. Results were in accordance with known motivation-based circuits involving the orbitomedial frontal cortex.
Purpose
Kleine-Levin syndrome (KLS) is a rare neurological disorder that mainly affects adolescents. KLS is characterized by relapsing-remitting episodes of severe hypersomnia, apathy, cognitive impairment, derealization and behavioral disturbances. Between episodes, patients have normal sleep, mood and behavior [1]. Each episode is of brief duration varying from a week to 1-2 months. No definite cause has been identified [1]. Anatomical MRI scan is normal, but brain scintigraphy can be abnormal during and between episodes [2]. Apathy is a prominent clinical feature of KLS [3] but its pathophysiology in the disease remains to be established. The mechanisms responsible for apathy may involve several circuits connecting the frontal lobes to the basal ganglia [4]. Here, we performed TBSS analyses on the return-to-the-axis probability (RTAP) measures that may be linked to apparent axonal diameter and inflammation [5] to analyze the integrity of white matter (WM) microstructure of healthy volunteers (HV) compared to symptomatic (KLS-S) and asymptomatic (KLS-AS) patients.Methods
We prospectively included 20 KLS-AS (mean age: 22.2 ± 8.9 years, 9 males) and 20 HV age and sex- matched one by one. Twelve of these 20 patients were also scanned during episodes (KLS-S). Apathy was assessed using the Starkstein Apathy score [6]. Diffusion-weighted images were acquired using a Siemens Verio 3T with a 12-channel head coil (GRAPPA=2; TR/TE=7.7s/92ms; voxel size: 2.5mm isotropic; 64, 32 and 8 gradient directions for b-values of 1800, 700, and 300 s/mm² respectively) and 8 images without diffusion weighting were also acquired.
We preprocessed the images using FSL (fsl.fmrib.ox.ac.uk/fsl/fslwiki/) and included correction for susceptibility (topup) and for eddy current distortions (eddycor) and creation of a binary mask of the brain (bet). Then, we generated RTAP maps of all subjects [7]. Voxelwise statistical analyses were carried out using TBSS, part of the FSL comparing RTAP maps of HV versus KLS-AS, HV versus KLS-S and KLS-AS versus KLS-S (paired t-test). Finally, in the TBSS-based ROI, we computed correlations between clinical scores (disease duration and apathy scores) and mean RTAP measures in this ROI and performed tractography on one healthy subject to determine its projection fibers. Results were considered significant at p<0.05, fully corrected for multiple comparisons across space.
Results
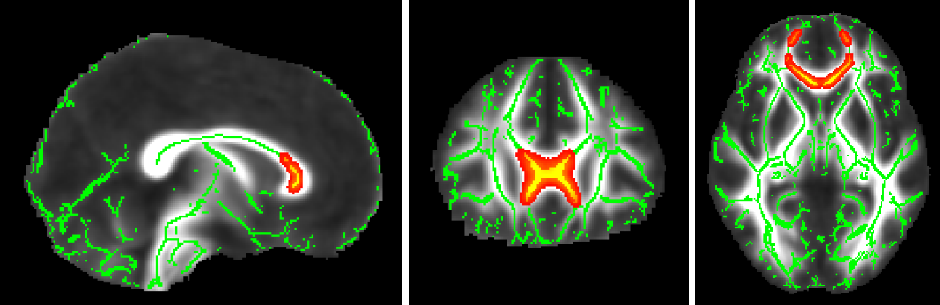
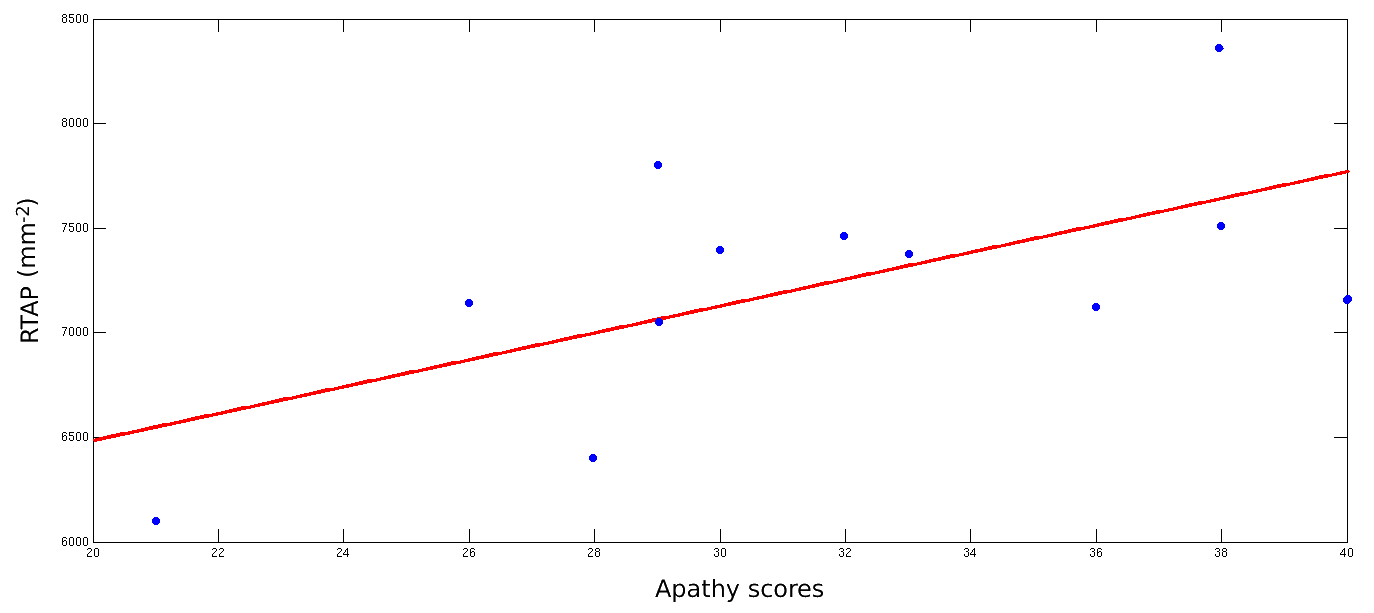
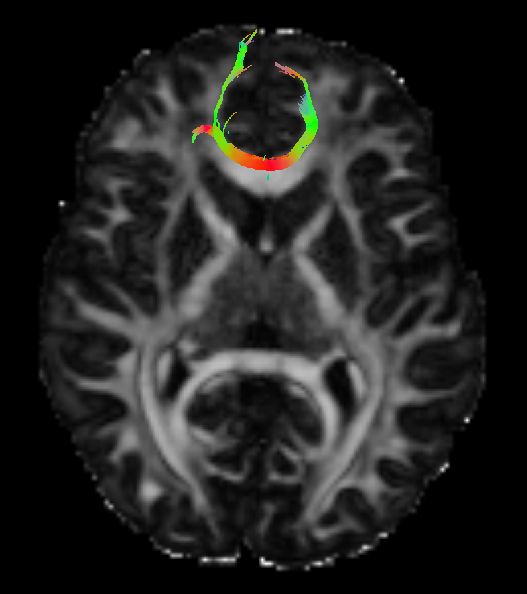
There were no significant differences in RTAP between HV and KLS-AS. In KLS-S compared to KLS-AS, RTAP increased in the corpus callosum (CC). There was a correlation between apathy scores and mean RTAP in the CC of KLS-S (p=0.03, r=0.61) (see Figure 2). There were no other correlations with clinical scores in KLS-AS as well as in KLS-S. Using the TBSS-ROI as a seed for tractography, fibers passing through the CC with abnormal RTAP measures projected to medial orbitofrontal cortex (see Figure 3).Discussion and conclusion
The results highlight the presence of structural changes correlated to the apathy score in the anterior portion of the CC during episodes, a region where fibers project onto the medial orbitofrontal cortex. As, these prefrontal regions are involved in motivation processes [4], this suggests that apathy in KLS could result from difficulties to provide the affective/motivational value of a given behavioral context.Acknowledgements
The research leading to these results received funding from the programs 'Institut des neurosciences translationnelle' ANR-10-IAIHU-06 and 'Infrastructure d’avenir en Biologie Santé' ANR-11-INBS-0006.References
[1] Arnulf, I., Rico, T. J., & Mignot, E. (2012). Diagnosis, disease course, and management of patients with Kleine-Levin syndrome. The Lancet Neurology, 11(10), 918-928.
[2] Kas, A., Lavault, S., Habert, M. O., & Arnulf, I. (2014). Feeling unreal: a functional imaging study in patients with Kleine-Levin syndrome. Brain 2014 ; 137 : 2077-87.
[3] Lavault, S., Golmard, J. L., Groos, E., Brion, A., Dauvilliers, Y., Lecendreux, M., et al. Kleine-Levin syndrome in 120 patients : Differential diagnosis and long episodes. Annals of neurology 2015 ; 77 : 529-40.
[4] Levy, R. (2012). Apathy: a pathology of goal-directed behaviour. A new concept of the clinic and pathophysiology of apathy. Revue neurologique, 168(8), 585-597.
[5] Özarslan E, Koay CG, Shepherd TM, Komlosh ME, Irfanoglu MO, Pierpaoli C, Basser PJ (2013) Mean apparent propagator (MAP) MRI: A novel diffusion imaging method for mapping tissue microstructure. NImg 78:16–32. doi: 10.1016/j.neuroimage.2013.04.016
[6] Starkstein, S. E., Mayberg, H. S., Preziosi, T. J., Andrezejewski, P., Leiguarda, R., Robinson, R. G. Reliability, validity, and clinical correlates of apathy in Parkinson’s disease. J Neuropsychiatry Clin Neurosci 1992 ; 4 : 134-9.
[7] Fick, R. H., Wassermann, D., Caruyer, E., & Deriche, R. (2016). MAPL: Tissue microstructure estimation using Laplacian-regularized MAP-MRI and its application to HCP data. NeuroImage, 134, 365-385.
Figures