3529
Statistical power and confounds for diffusion MRI microstructure modeling1Maastricht University, Maastricht, Netherlands, 2Brain Innovation, Maastricht, Netherlands
Synopsis
Using high resolution HCP WU-Minn data and GPU accelerated software (MDT; https://github.com/cbclab), the aims of this study were to evaluate dMRI microstructure indices over white matter tracts, evaluate the effect sizes between tracts as an upper limit for effect size of diffusion microstructure indices between subjects and finally the influence of possible confounds on those other aims. We report sizeable effects between tracts within subjects for several indices. Also, two clear confounds for diffusion microstructure studies where identified, first, partial volume effects in small and large cross-section tracts, second, model selection on the number of intra-axonal model compartments.
Introduction
Statistical power in neuroscience studies is often limited, leading to, among others, overestimates of effect size in studies with low subject numbers, low reproducibility of results, and a reduced likelihood that a statistically significant result reflects a true effect. Estimating the power of a prospective study requires an estimate of the effect size of the sought effect. In diffusion MRI (dMRI) analysis, estimating effect sizes is made difficult by two challenges. First, it is often infeasible to scan a large number of subjects, essential for a reasonable effect size estimate. Here, we used the publicly available 3T three-shell HARDI data of 490 quality controlled subjects from the HCP WU-Minn Consortium1 s500 release. Second, dMRI image analysis can require substantial computing time, especially when using parametric biophysical compartment dMRI models like CHARMED2 and NODDI3 that can have higher specificity than diffusion tensor imaging (DTI). We used the open source Maastricht Diffusion Toolbox (MDT, https://github.com/cbclab) to overcome prohibitive computing times. Using this data and these tools, the aims of this study were to evaluate 1) the spread of values for various dMRI microstructure indices over white matter tracts, 2) the effect sizes of differences between tracts as an upper limit for effect size of diffusion microstructure indices between subjects and 3) the influence of possible confounds on the other aims.Methods
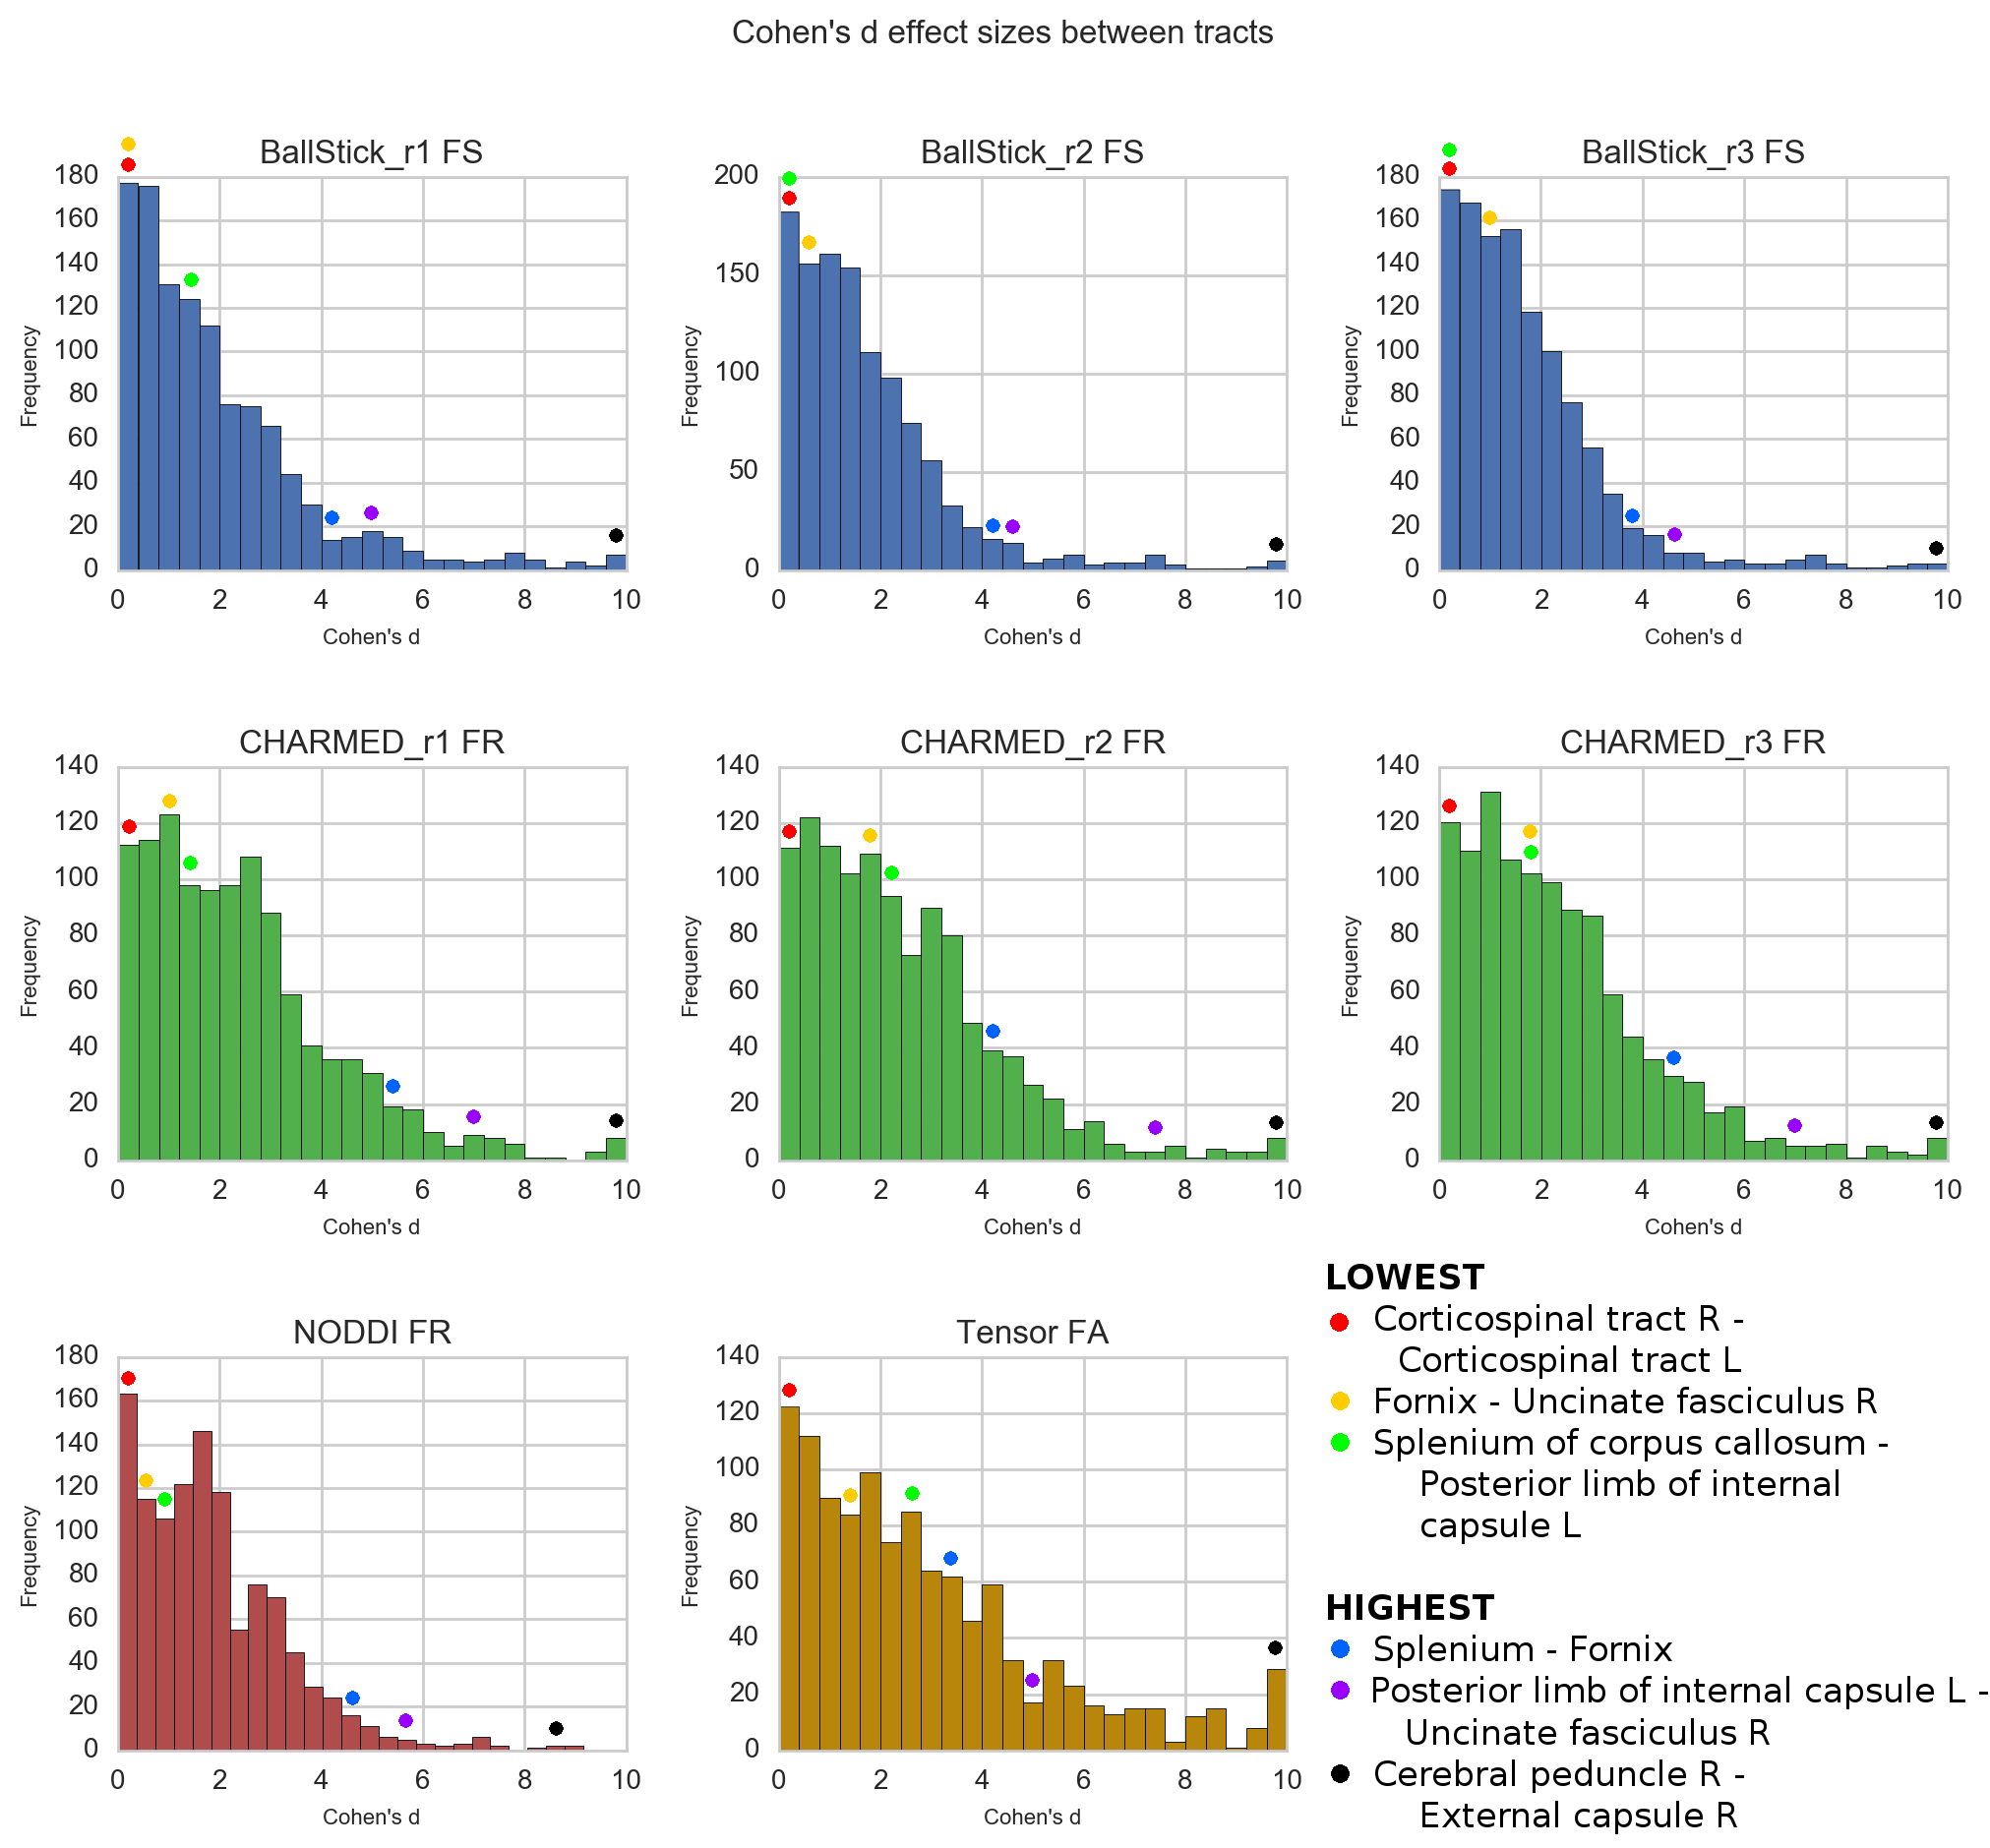
From the WU-Minn Consortium HCP s5001, the 3T diffusion MRI data of 490 quality controlled subjects (1.25mm isotropic, three shells of b=1000, 2000, 3000 s/mm^2, 90 directions each and 18 b0 volumes) were used for analysis in their pre-processed form4. Each dataset was fitted with the following models using MDT5: Tensor6, Ball&Stick_r[n]7, NODDI3 and CHARMED_r[n]2 where n ranged from one to three Stick and CHARMED restricted compartments (respectively), all using the Cascade Fixed method5. A white matter skeleton was created from the average DTI FA map in MNI-152 space using the standard TBSS8 pipeline and the following parameter maps were projected to this skeleton: FA (Tensor), FS (Fraction of Sticks; Ball&Stick), FR (Fraction of Restricted compartment; CHARMED) and FR (Fraction of Restricted; NODDI). We then aligned the JHU-ICBM-FA Mori9 white matter atlas to the skeleton and applied the skeleton mask to arrive at a white matter tracts parcellation map. Using this parcellation map we extracted for each parameter map and for each subject the mean voxel value of each white matter tract. These mean voxel values where then averaged over subjects to get the mean tract ROI values. To estimate the effect sizes between tracts, the Cohen's d factor ($$$d=(\bar{x}_1 - \bar{x}_2)/s$$$; s = pooled standard deviation10) was calculated between every tract combination.Results & Discussion
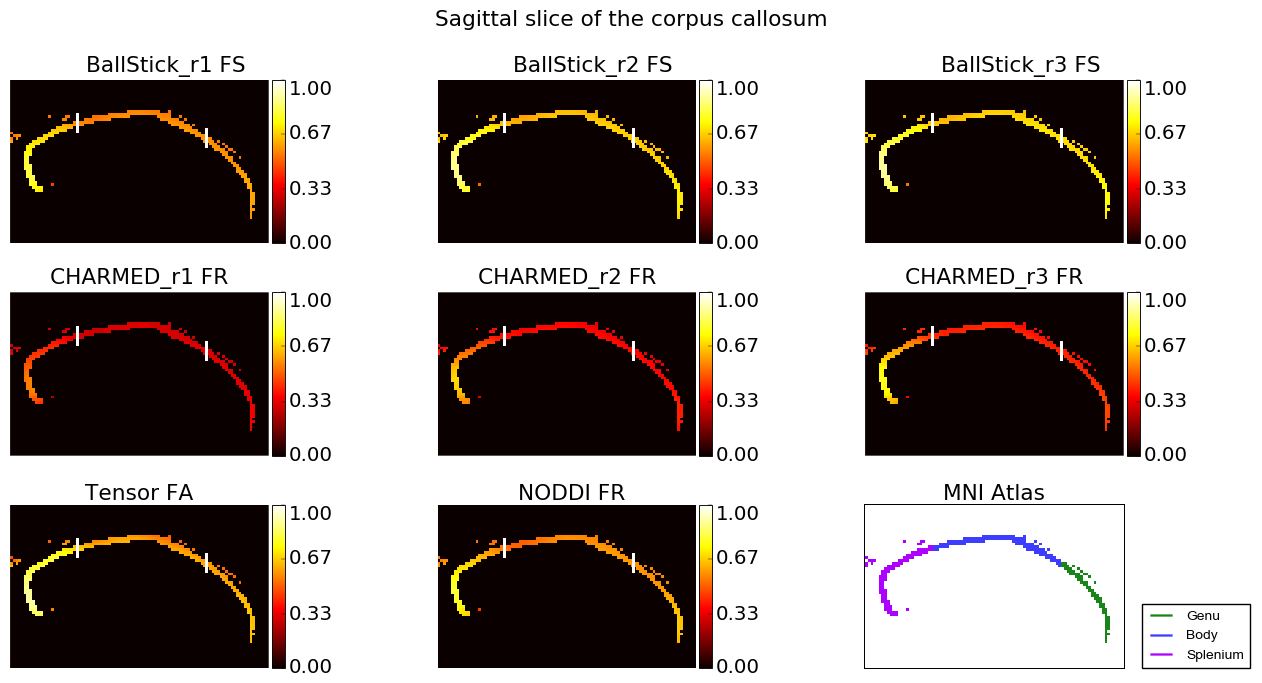
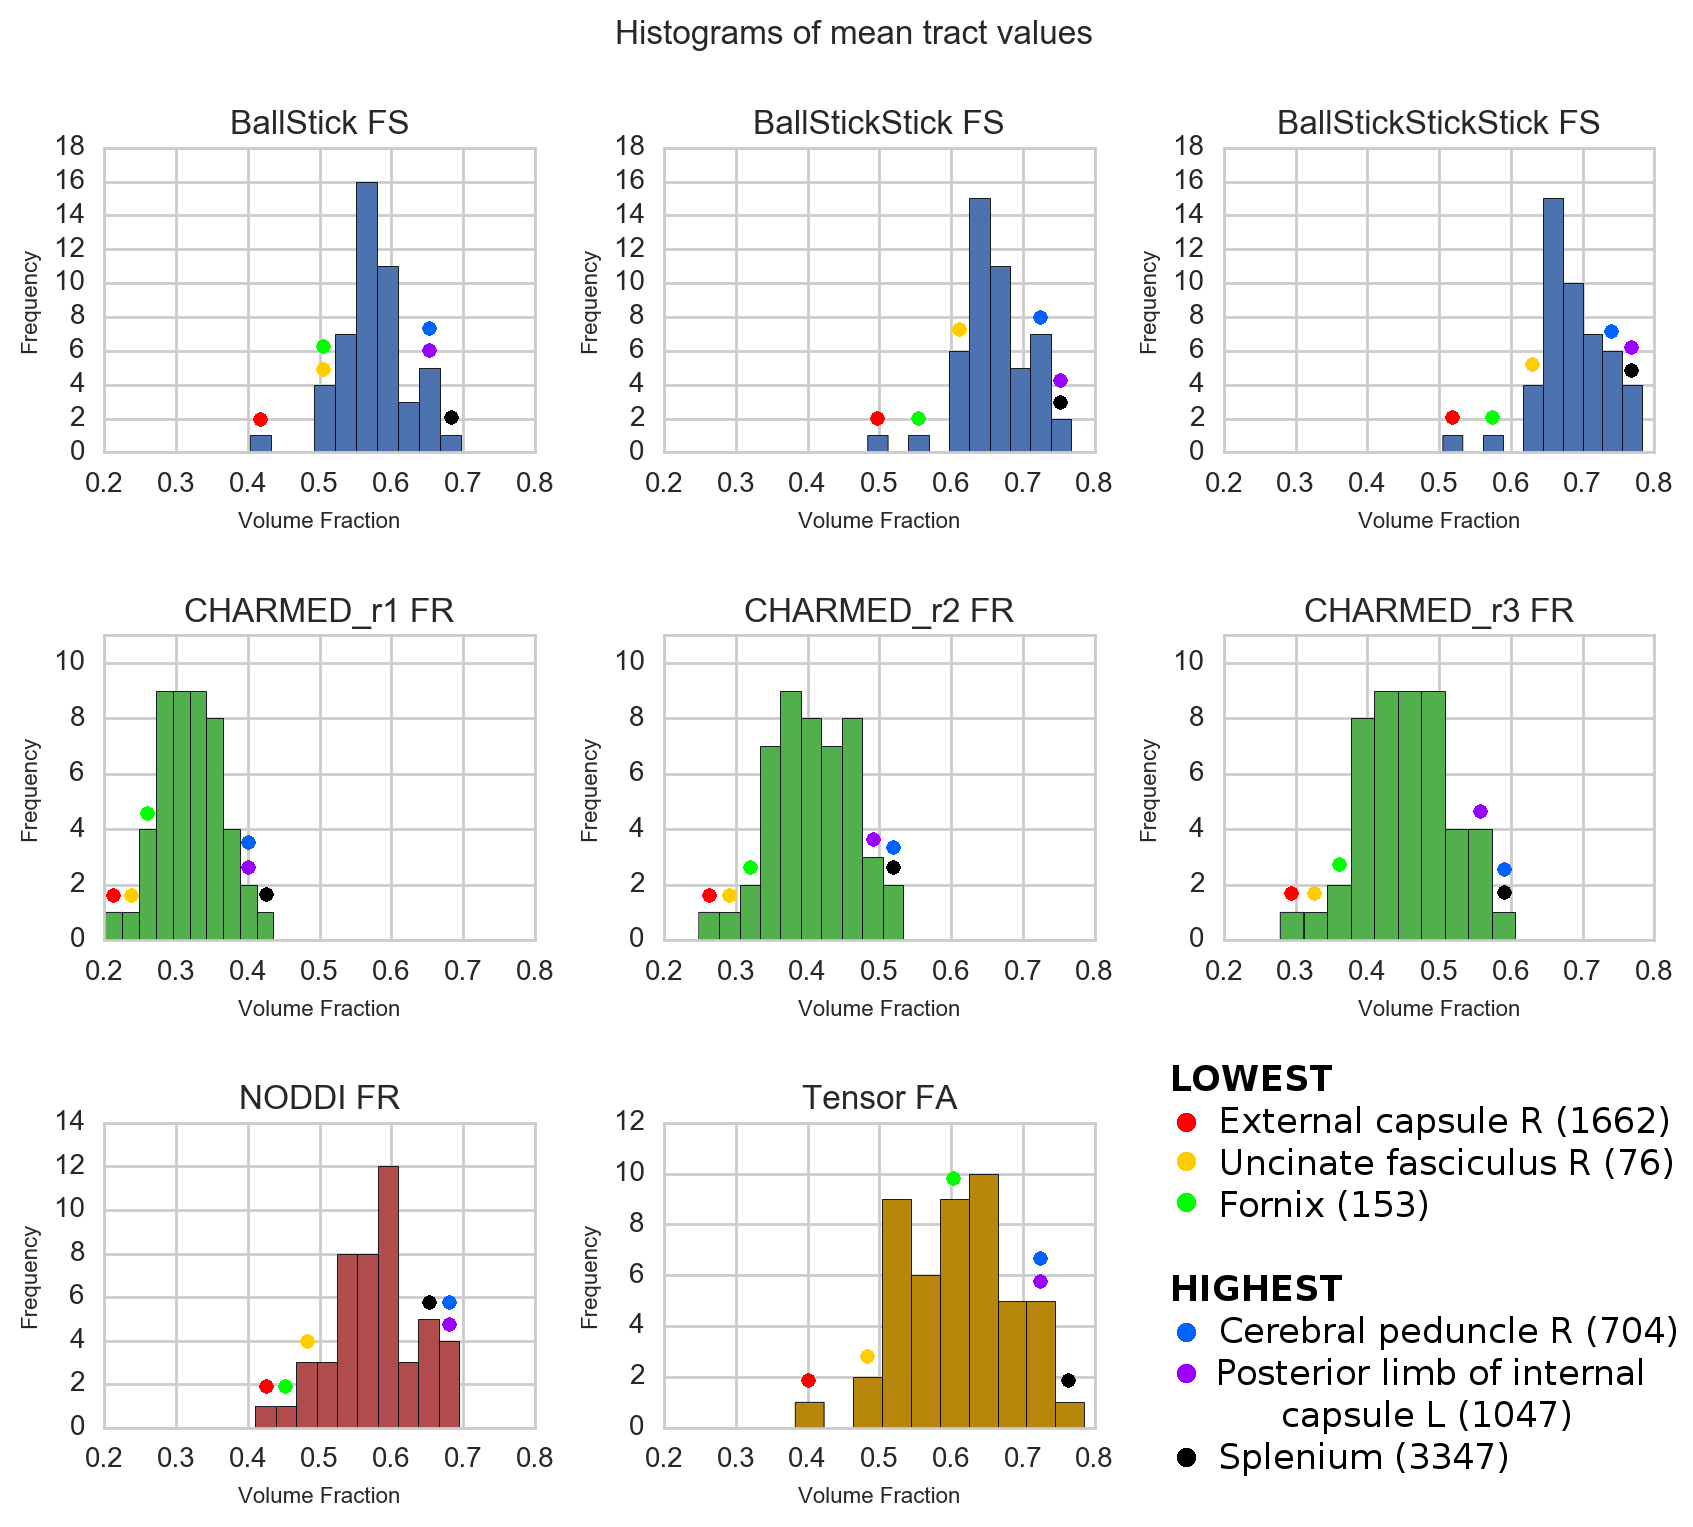
In Figure 1 and 2, increasing restricted volume fractions (FR) can be observed in the genu, body and splenium with increasing number of restricted compartments for Ball&Stick and CHARMED. CHARMED_r1 seems to underestimate the intracellular compartment fraction, which is likely related to the lack of high b-values (> 3000 s/mm^2) which are needed for CHARMED. Increasing FR could be expected without explicit model selection on the number of compartments, since superfluous compartments can still be allotted a non-zero volume fraction in the estimation. Lowest CHARMED FR is observed in tracts with thin cross-section whereas highest FR is observed in some larger tracts, which may reflect partial volume effects as a confound. Figure 3 shows the effect sizes (using Cohen's d) between tracts for several parameter maps. Most effect sizes lie between zero and four, with thicker tails of larger effect sizes for CHARMED FR and Tensor FA. The largest effect sizes are found between thin cross-section tracts and large tracts, whereas the smallest effect sizes are found between tracts with a similar cross-section.Conclusion
We
report sizeable effects (Cohen's D > 2) for several indices,
including CHARMED FR and NODDI FR. Tensor FA tends to show the
largest effect sizes (Figure 3) which reflects its high sensitivity,
despite its low biophysical specificity. Two clear confounds for
diffusion microstructure studies where identified. First, partial
volume effects where shown to be a clear confound for diffusion
microstructure studies, as tract cross-section greatly influences
effect sizes. This casts doubts on the feasibility of dMRI
microstructure for thin tracts, as the data used already has high
spatial resolution. Second we show the need for good model selection
or relevance detection on the number of anisotropic compartments, as
this can otherwise can become a severe confound.Acknowledgements
No acknowledgement found.References
1. Van Essen DC, Smith SM, Barch DM, Behrens TEJ, Yacoub E, Ugurbil K. The WU-Minn Human Connectome Project: An overview. Neuroimage. 2013;80(44):62-79. doi:10.1016/j.neuroimage.2013.05.041.
2. Assaf Y, Basser PJ. Composite hindered and restricted model of diffusion (CHARMED) MR imaging of the human brain. Neuroimage. 2005;27(1):48-58. doi:10.1016/j.neuroimage.2005.03.042.
3. Zhang H, Schneider T, Wheeler-Kingshott CA, Alexander DC. NODDI: Practical in vivo neurite orientation dispersion and density imaging of the human brain. Neuroimage. 2012;61(4):1000-1016. doi:10.1016/j.neuroimage.2012.03.072.
4. Panagiotaki E, Schneider T, Siow B, Hall MG, Lythgoe MF, Alexander DC. Compartment models of the diffusion MR signal in brain white matter: A taxonomy and comparison. Neuroimage. 2012;59(3):2241-2254. doi:10.1016/j.neuroimage.2011.09.081.
5. Harms R, Roebroeck A. The Maastricht Diffusion Toolbox (MDT): Modular, GPU accelerated, dMRI microstructure modeling. submitted to ISMRM 2017. Honolulu; 2017.
6. Basser PJ, Mattiello J, LeBihan D. MR diffusion tensor spectroscopy and imaging. Biophys J. 1994;66(1):259-267. doi:10.1016/S0006-3495(94)80775-1.
7. Behrens TEJ, Woolrich MW, Jenkinson M, et al. Characterization and Propagation of Uncertainty in Diffusion-Weighted MR Imaging. Magn Reson Med. 2003;50(5):1077-1088. doi:10.1002/mrm.10609.
8. Smith SM, Jenkinson M, Johansen-Berg H, et al. Tract-based spatial statistics: Voxelwise analysis of multi-subject diffusion data. Neuroimage. 2006;31(4):1487-1505. doi:10.1016/j.neuroimage.2006.02.024.
9. Mori S, Wakana S, Zijl PCM van, Nagae-Poetscher LM. MRI Atlas of Human White Matter.; 2005. 10. Cohen J. Statistical Power Analysis for the Behavioral Sciences. Routledge; 2 edition (July 1, 1988); 1988.
Figures