3528
Model-free Fourier Reconstruction of the Diffusion Propagator from Multi-b-shell Diffusion Data1Department of Electrical Engineering, Stanford University, Stanford, CA, United States, 2Department of Radiology, Stanford University, Stanford, CA, United States, 3eScience Institute, The University of Washington, Seattle, WA, United States, 4Department of Radiology, Massachusetts General Hospital, Boston, MA, United States, 5Department of Neurology, Massachusetts General Hospital, Boston, MA, United States
Synopsis
We propose a practical, model-free, Fourier reconstruction framework for obtaining the diffusion propagator and the diffusion orientation distribution function (ODF) from multi-b-shell diffusion data. Signals on each b-shell are scaled to account for non-uniform sampling density in q-space. Diffusion propagators and ODFs are obtained using a Discrete Fourier Transform and an analytic ODF solution. The method is demonstrated on data from the Human Connectome Project and shown to be both effective and broadly applicable to multi-b-shell data.
Introduction
Diffusion spectrum imaging (DSI) (1-3) has the advantage of being a model-free method that recovers the diffusion propagator (4-6) and orientation distribution function (ODF) based only on a Fourier relationship (7, 8). Unfortunately, in order to use the Fourier relationship, q-space data must be sampled on (or regridded to) a Cartesian grid with sufficient coverage to perform the Fast Fourier Transform (FFT) along each dimension. This intensive data sampling requirement for Cartesian-based DSI is impractical for many applications. For this reason, multi-b-shell (9, 10) acquisitions are much more widely used (e.g. by the WU-Minn Human Connectome Project (HCP) (11)). Here we propose a practical Fourier framework for achieving a model-free, DSI-style reconstruction of the diffusion propagator and ODF from multi-b-shell data. This framework employs a fast method to correct q-space sampling density, a Discrete Fourier Transform (DFT) and an analytic ODF solution to recover the diffusion propagator and ODF respectively.Methods
Data. Data were acquired on a 3T scanner (GE Healthcare) equipped with a 32-channel receive coil (Nova Medical) on a healthy subject using a 2D single-refocused diffusion-weighted-SE-EPI sequence: TE/TR=96/2000ms, ASSET=2, 2×2×2mm3, 30 axial slices covering corpus callosum. Two datasets were acquired using (a) standard 11×11×11 Cartesian sampling (DSI-11, bmax =7,000s/mm2, 515 samples) and (b) multi-b-shell sampling (Mshell-6, 6 b-shells: 1×b=0, 103×b=1400, 103×b=2800, 103×b=4200, 103×b=5600, 103×b=7000s/mm2, 516 samples total. Data were corrected using FSL’s (12) TOPUP and EDDY.
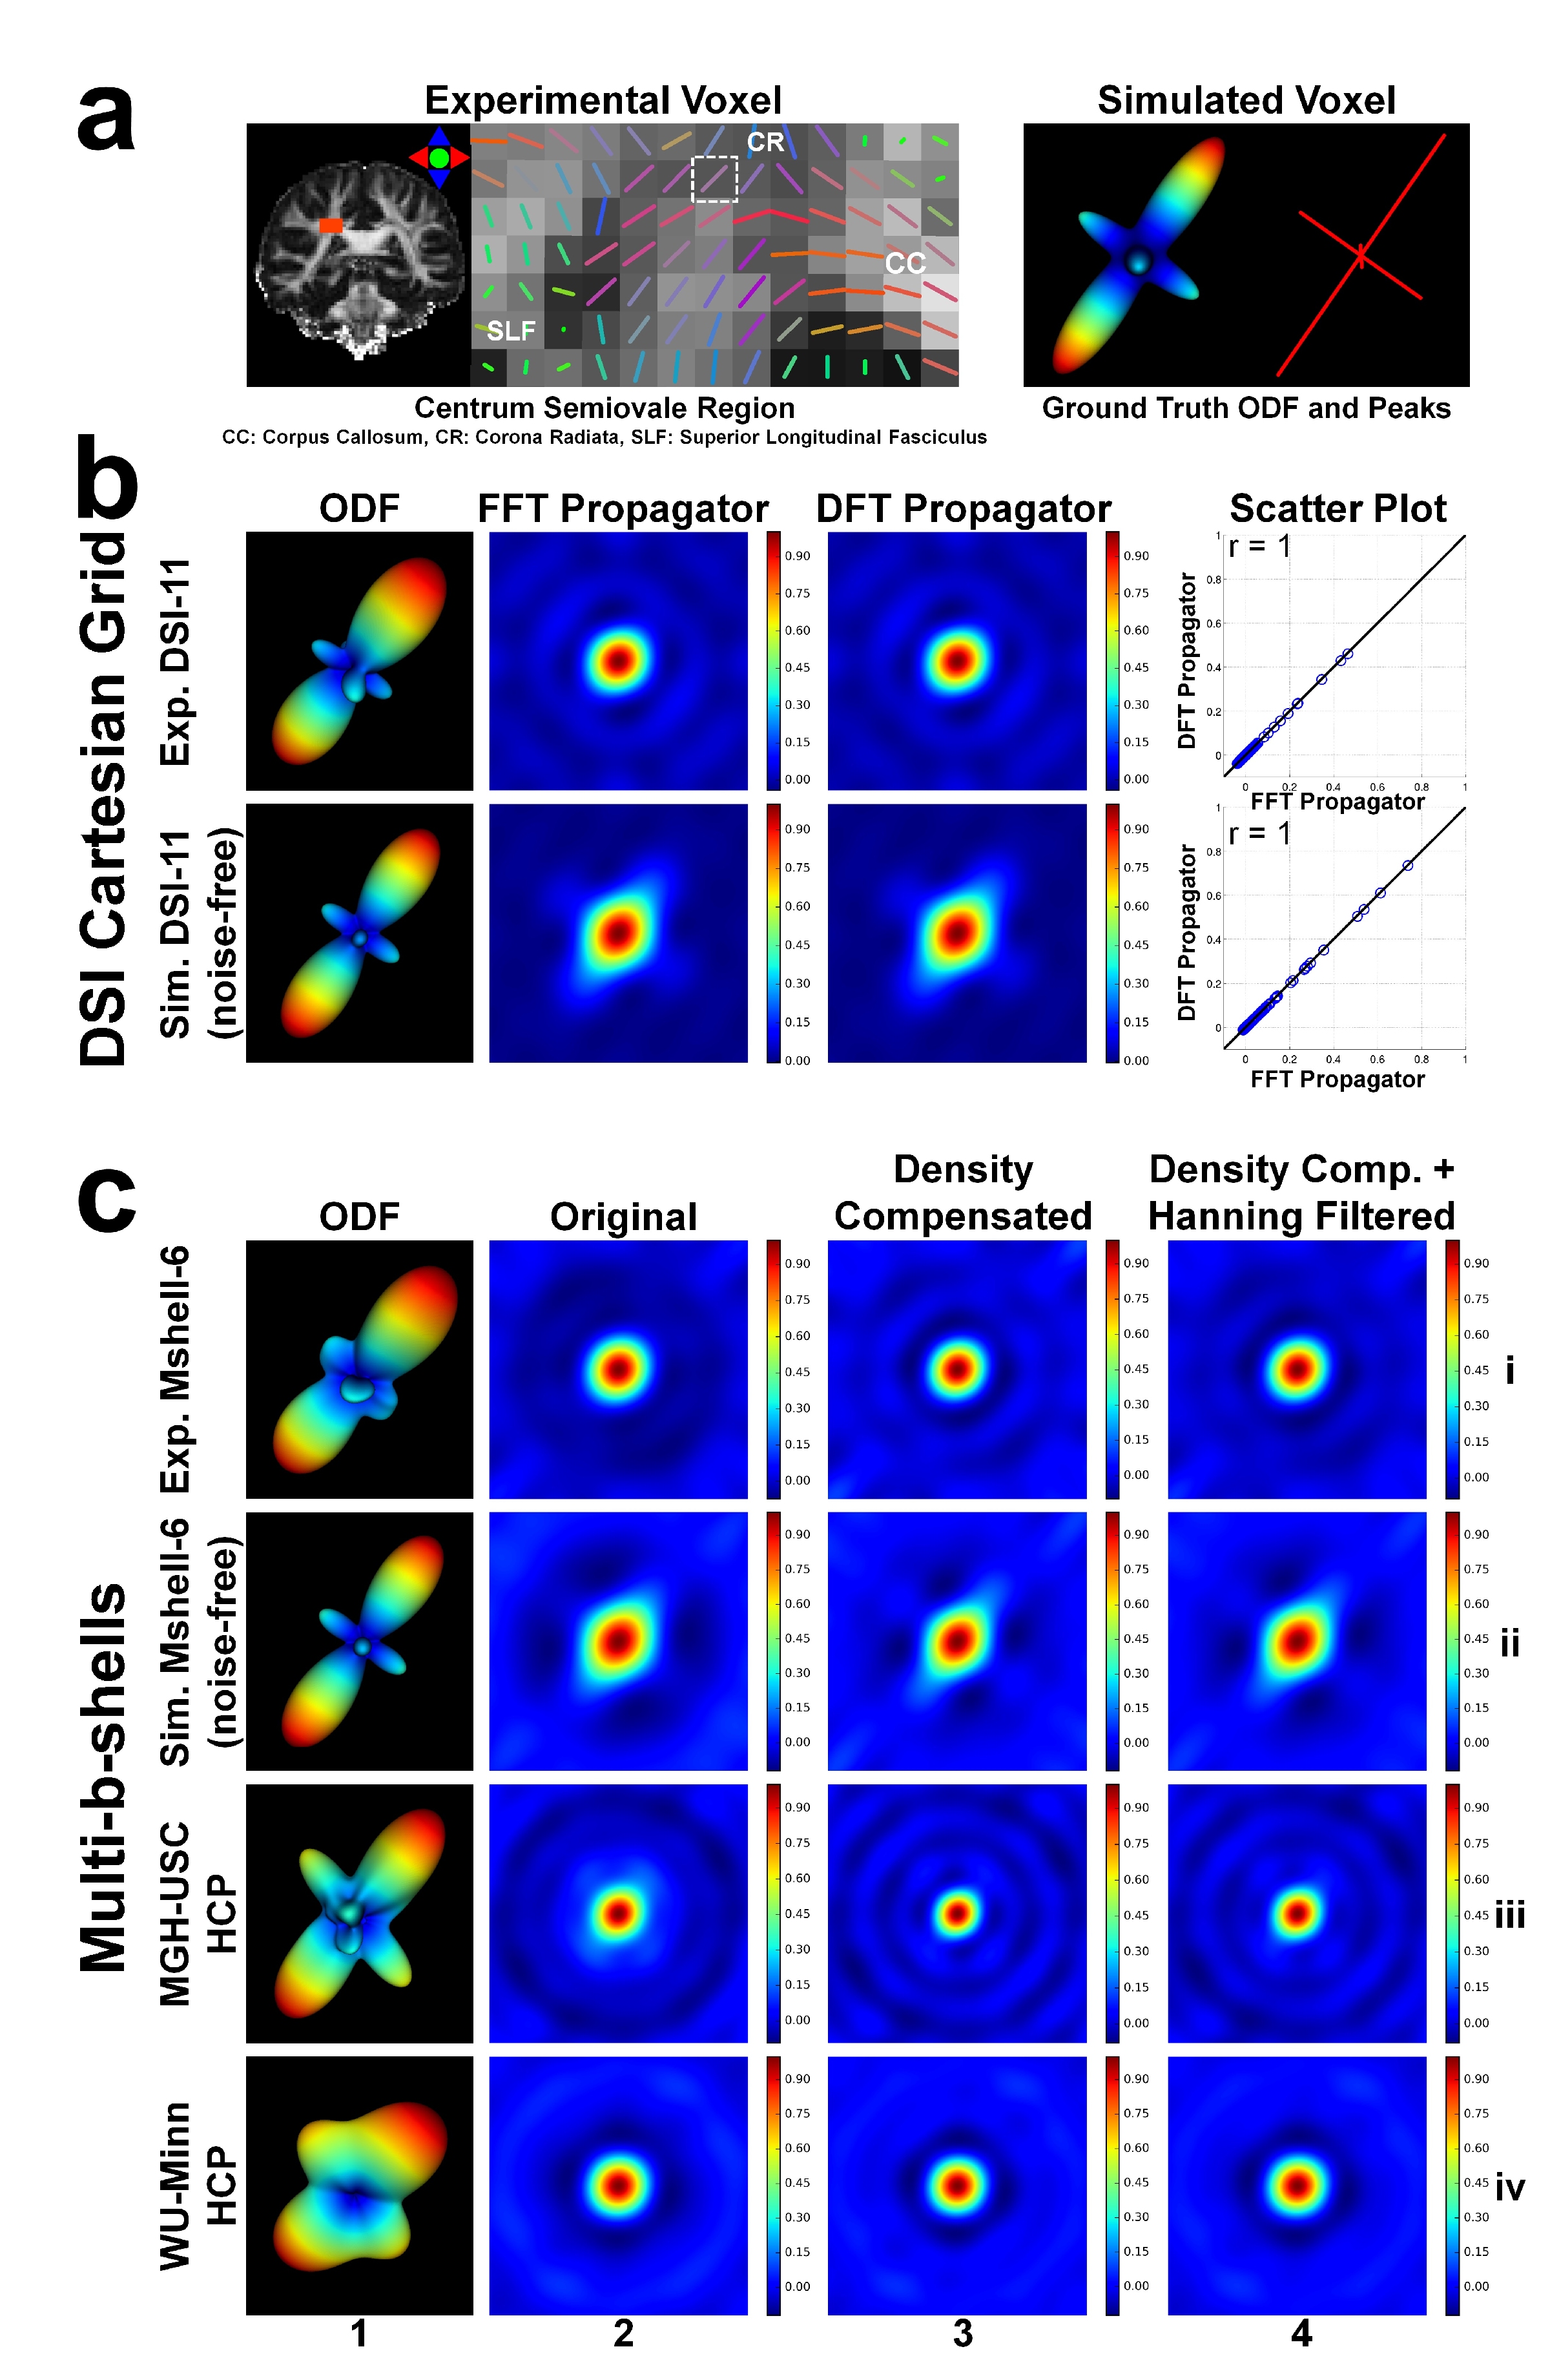
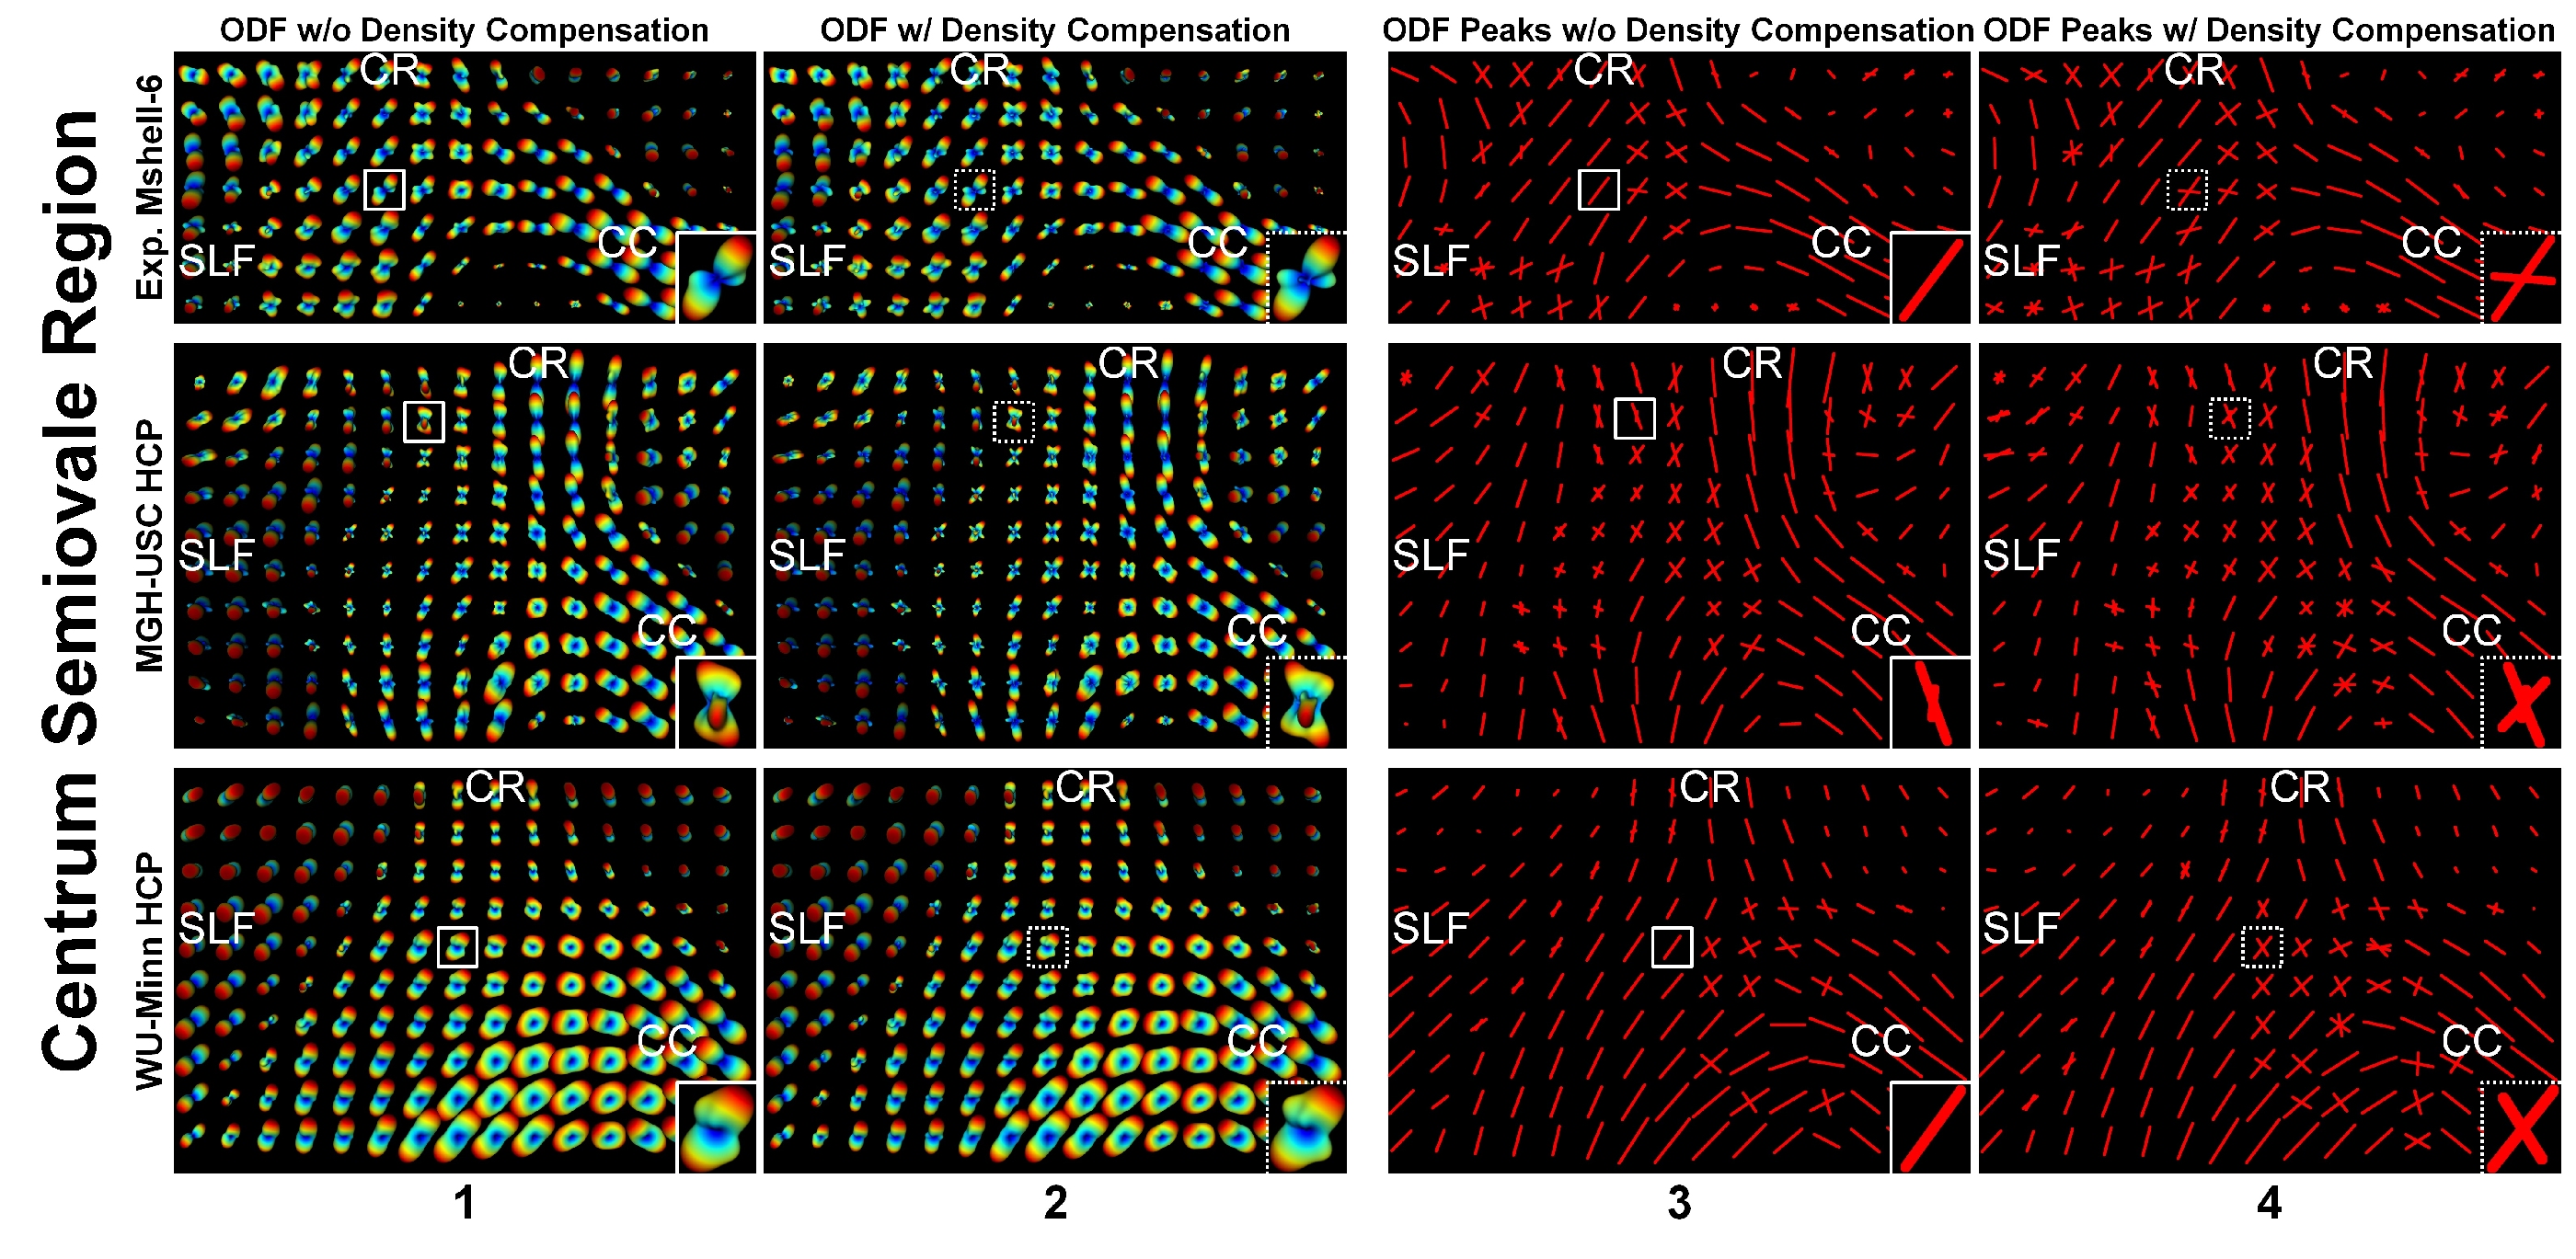
Pre-processed multi-b-shell HCP data (MGH-USC, subject 1010, 5 b-shells: 40×b=0, 64×b=1000, 64×b=3000, 128×b=5000, 256×10,000s/mm2; WU-Minn, subject 100307, 3 b-shells: 18×b=0, 90×b=1000, 90×b=2000, 90×b=3000s/mm2) were downloaded for analysis (https://www.humanconnectome.org/). A region-of-interest located in the centrum semiovale (Fig.2a, Fig.5) that contains the intersection of three fiber bundles was selected. Simulations were performed by configuring a three-fiber-crossing voxel (Fig.2a, each with 55%, 25% and 20% contribution) using a multi-tensor model (each tensor with 2×10⁻³mm2/s axial and 0.3×10⁻³mm2/s radial diffusivity) using DIPY’s (13) MULTI_TENSOR. Datasets of DSI-11 and Mshell-6 samples with 3-40 signal-to-noise ratios (SNR) were generated.
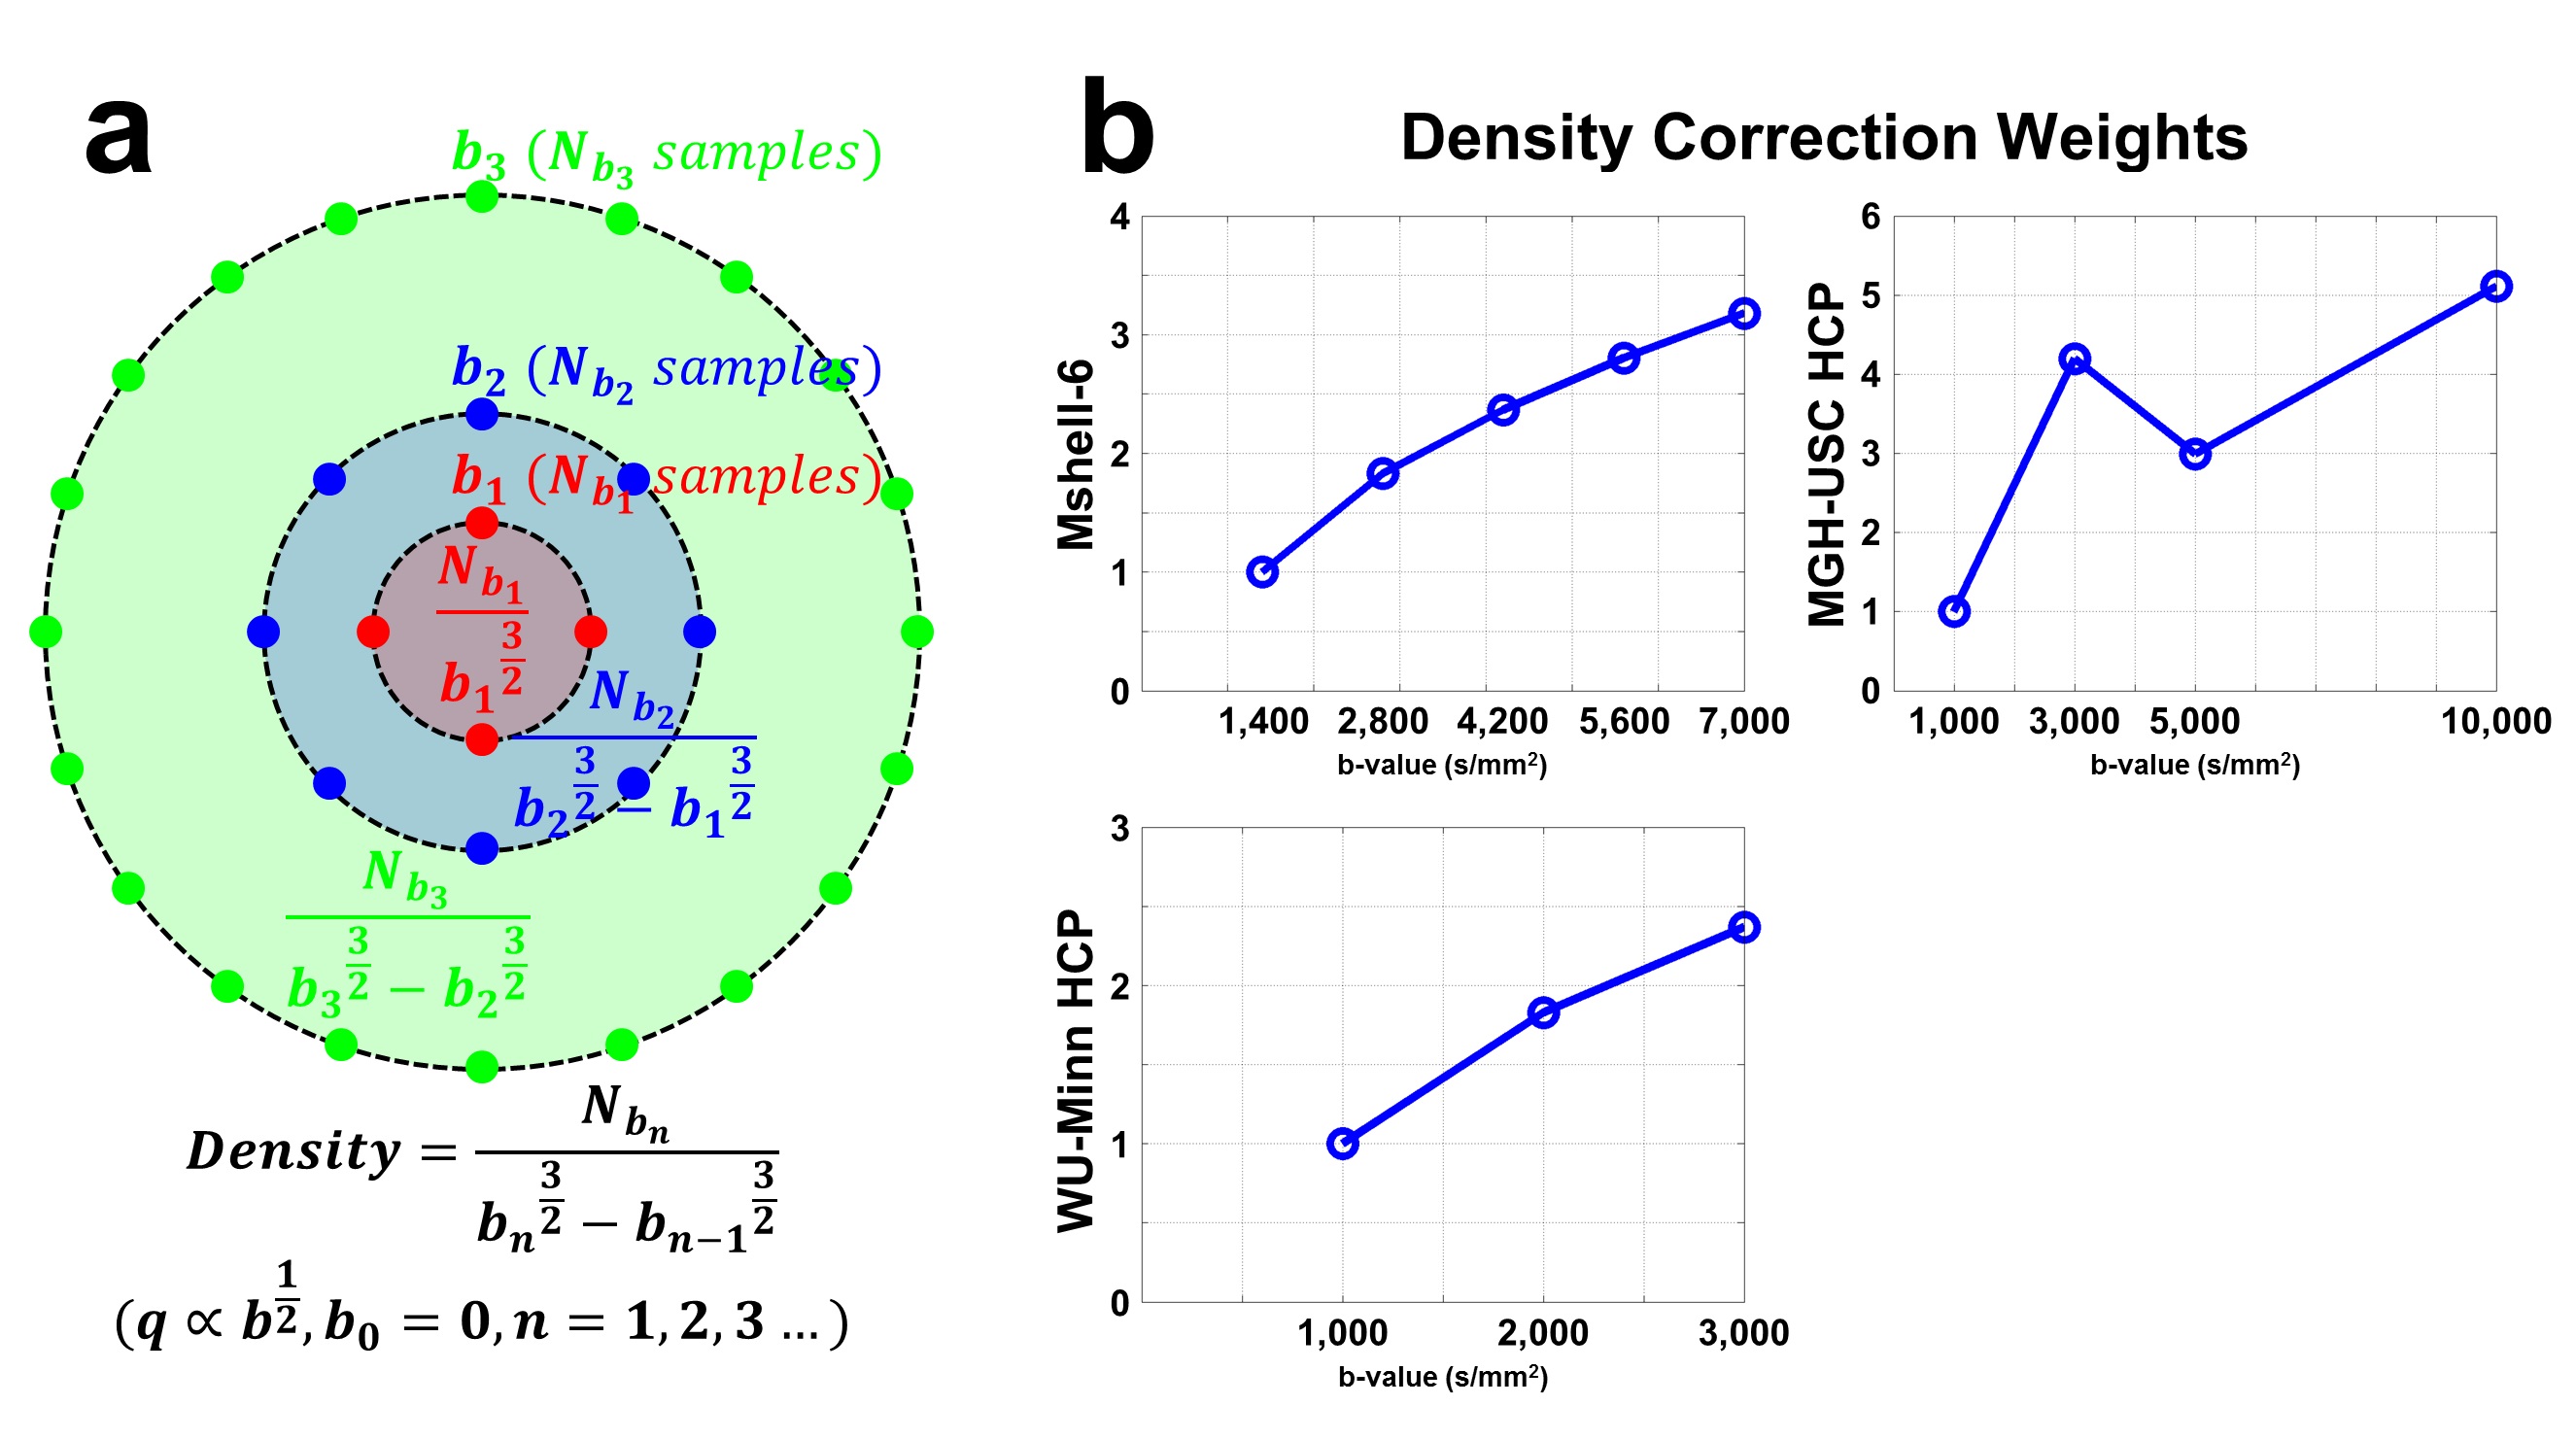
Density Correction. The sampling density for a b-shell was calculated as the number of samples on the shell divided by the volume of the shell. The reciprocal of the sampling density for each shell was used as the density correction weighting factor. b=0 samples were not used as they only contribute to a constant term in propagator and ODF.
Reconstruction. A non-Cartesian Fourier Transform was achieved using the DFT (implemented as a matrix multiplication) to calculate the diffusion propagator from multi-b-shell data. To reconstruct the ODF, the DSI method of integrating the diffusion propagator along multiple directions and one of its analytic solutions (i.e. generalized q-space imaging (GQI) (14)) were performed using DIPY’s DiffusionSpectrumModel and GeneralizedQSamplingModel.
Results and Discussion
Figure 1 depicts our method for fast estimation of q-space sampling density for multi-b-shell samples (a) and the resultant density correction weights for each b-shell (b). The correction scales up high-b-value signals. The correction weights of Mshell-6 and WU-Minn data are monotonically increasing while the weights of MGH-USC data are not since its number of samples on each b-shell is varying.
Figure 2 demonstrates FFT and DFT are equivalent in recovering the diffusion propagator (b), and using DFT and sampling density correction, diffusion propagators can be recovered from multi-b-shell data in a model-free manner (c). The recovered propagators provide full information of the ensemble diffusion process and can also be used to calculate ODFs.
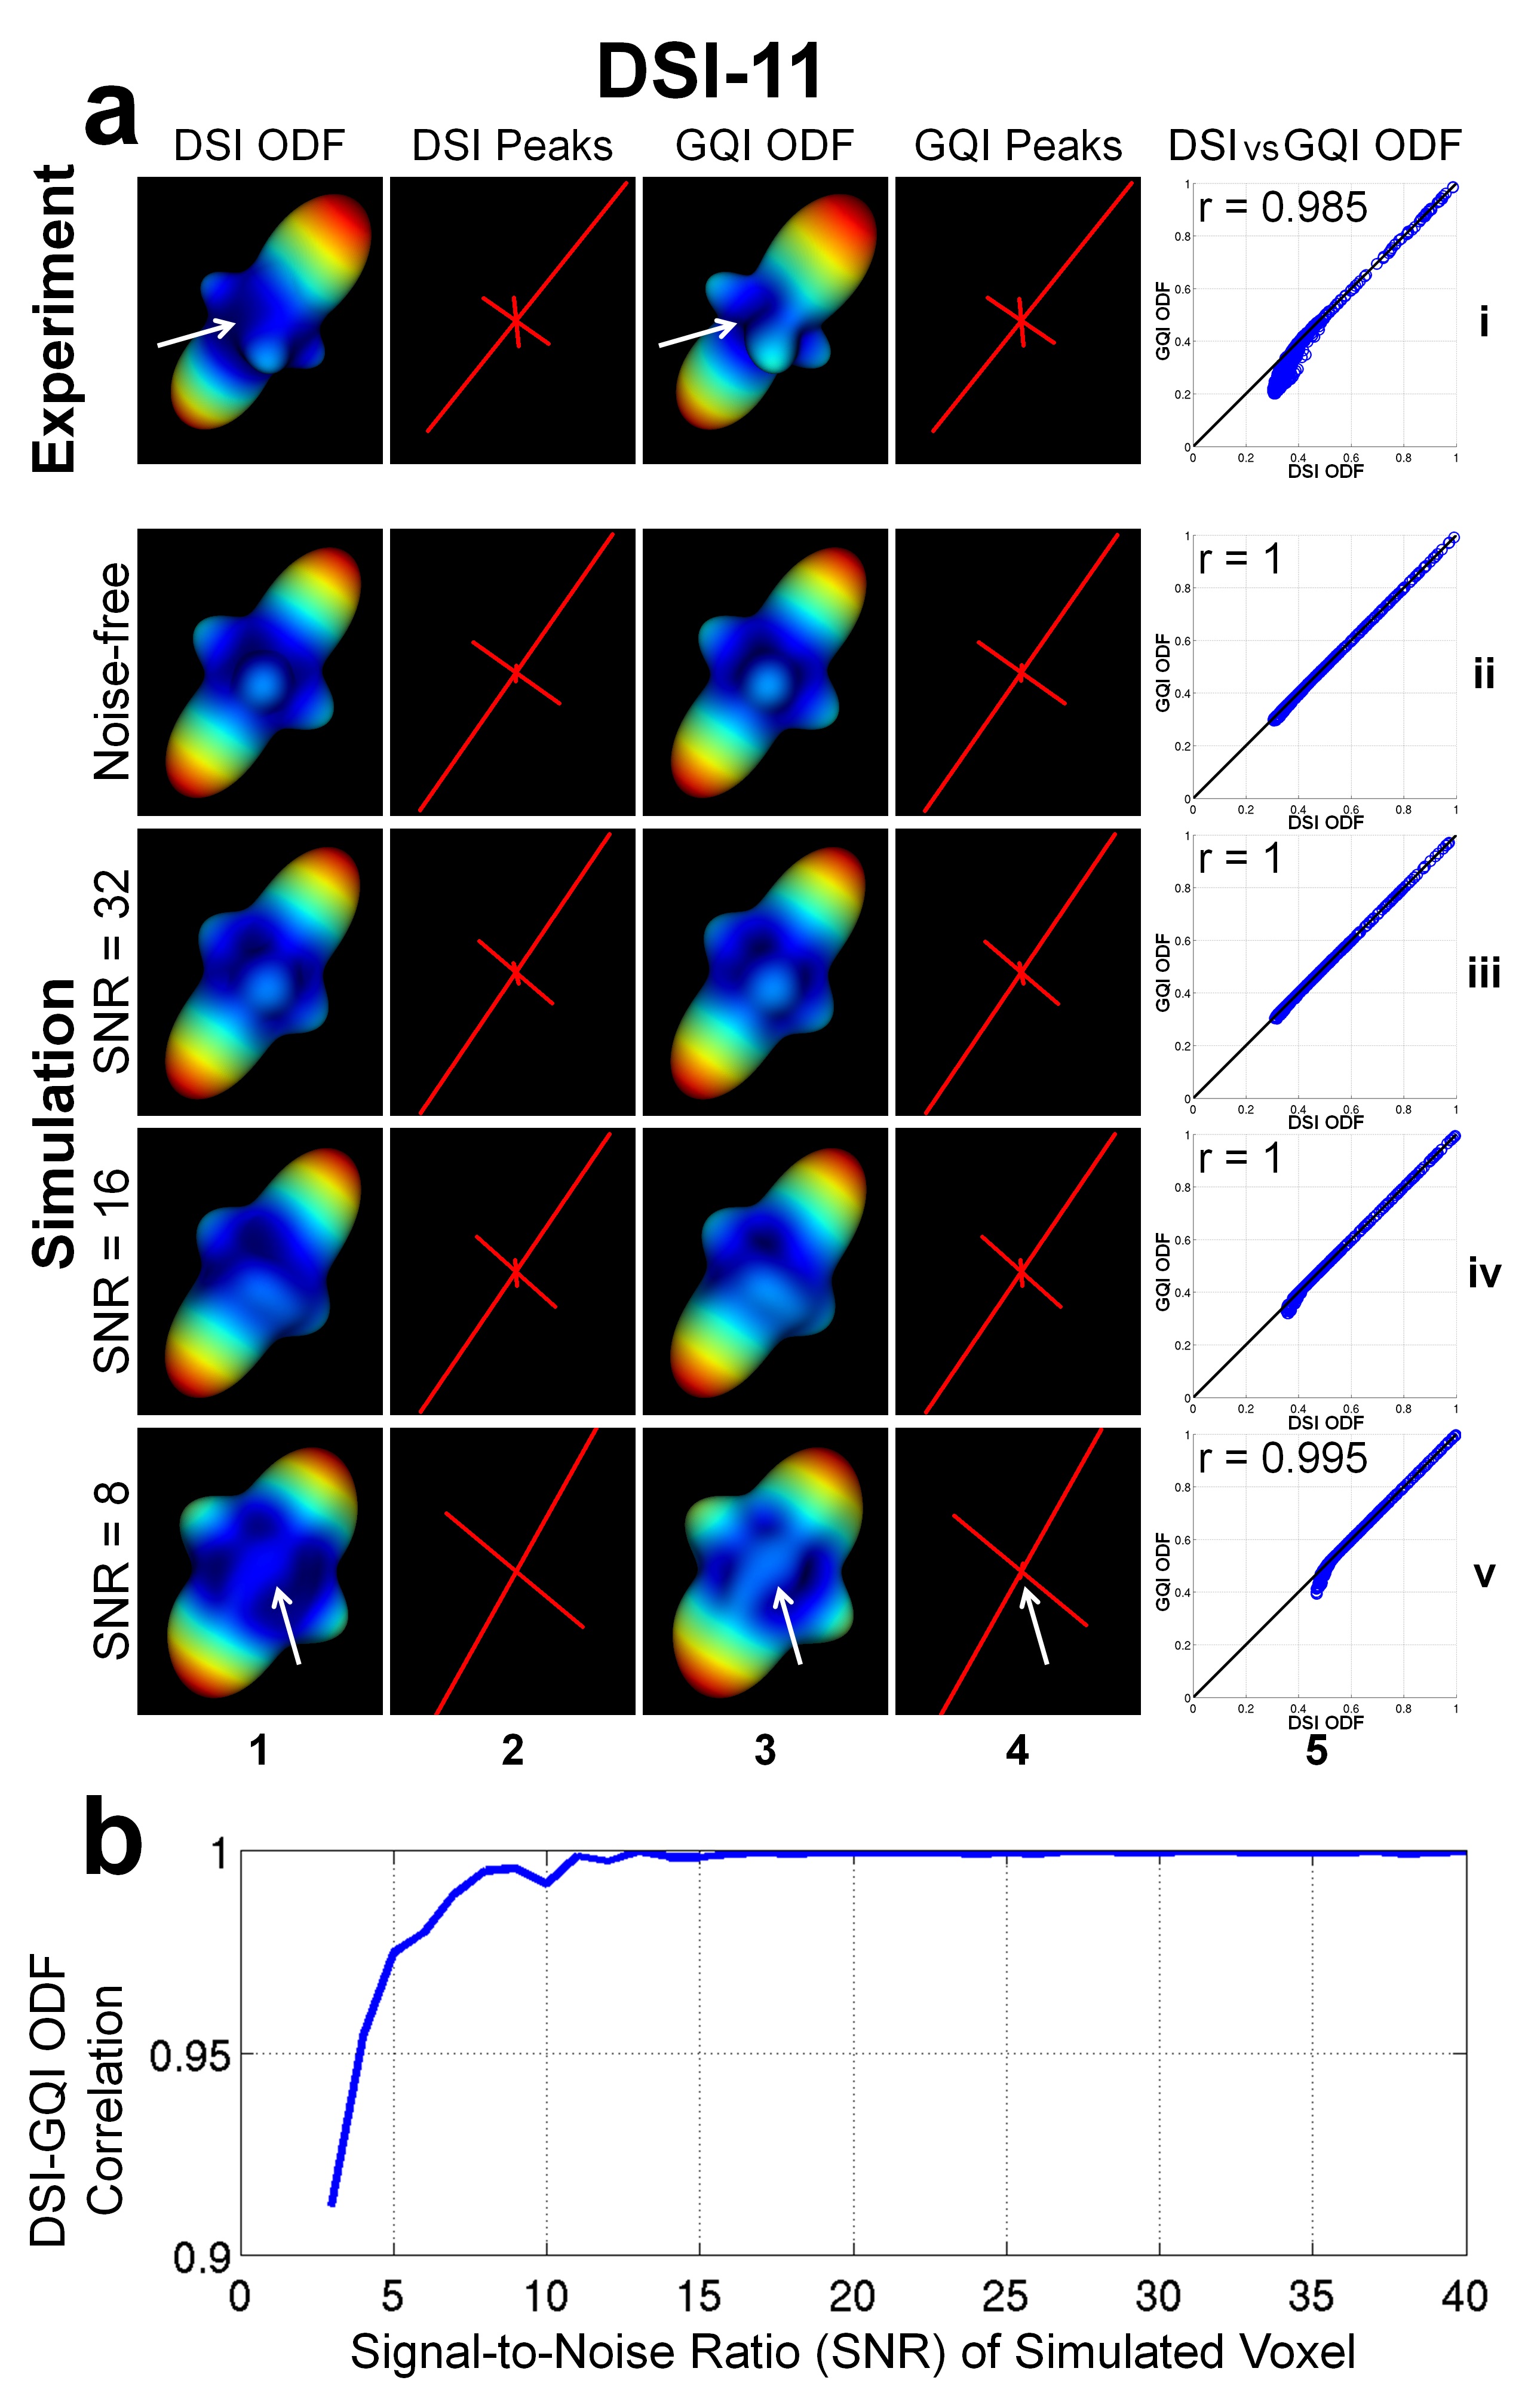
Figure 3 shows DSI and GQI are equivalent in reconstructing ODFs, especially for data with SNR higher than ~15. GQI-ODFs are slightly sharper than DSI-ODFs (white arrows in (a)) because DSI reconstruction only uses non-negative and real parts of the propagator after FFT.
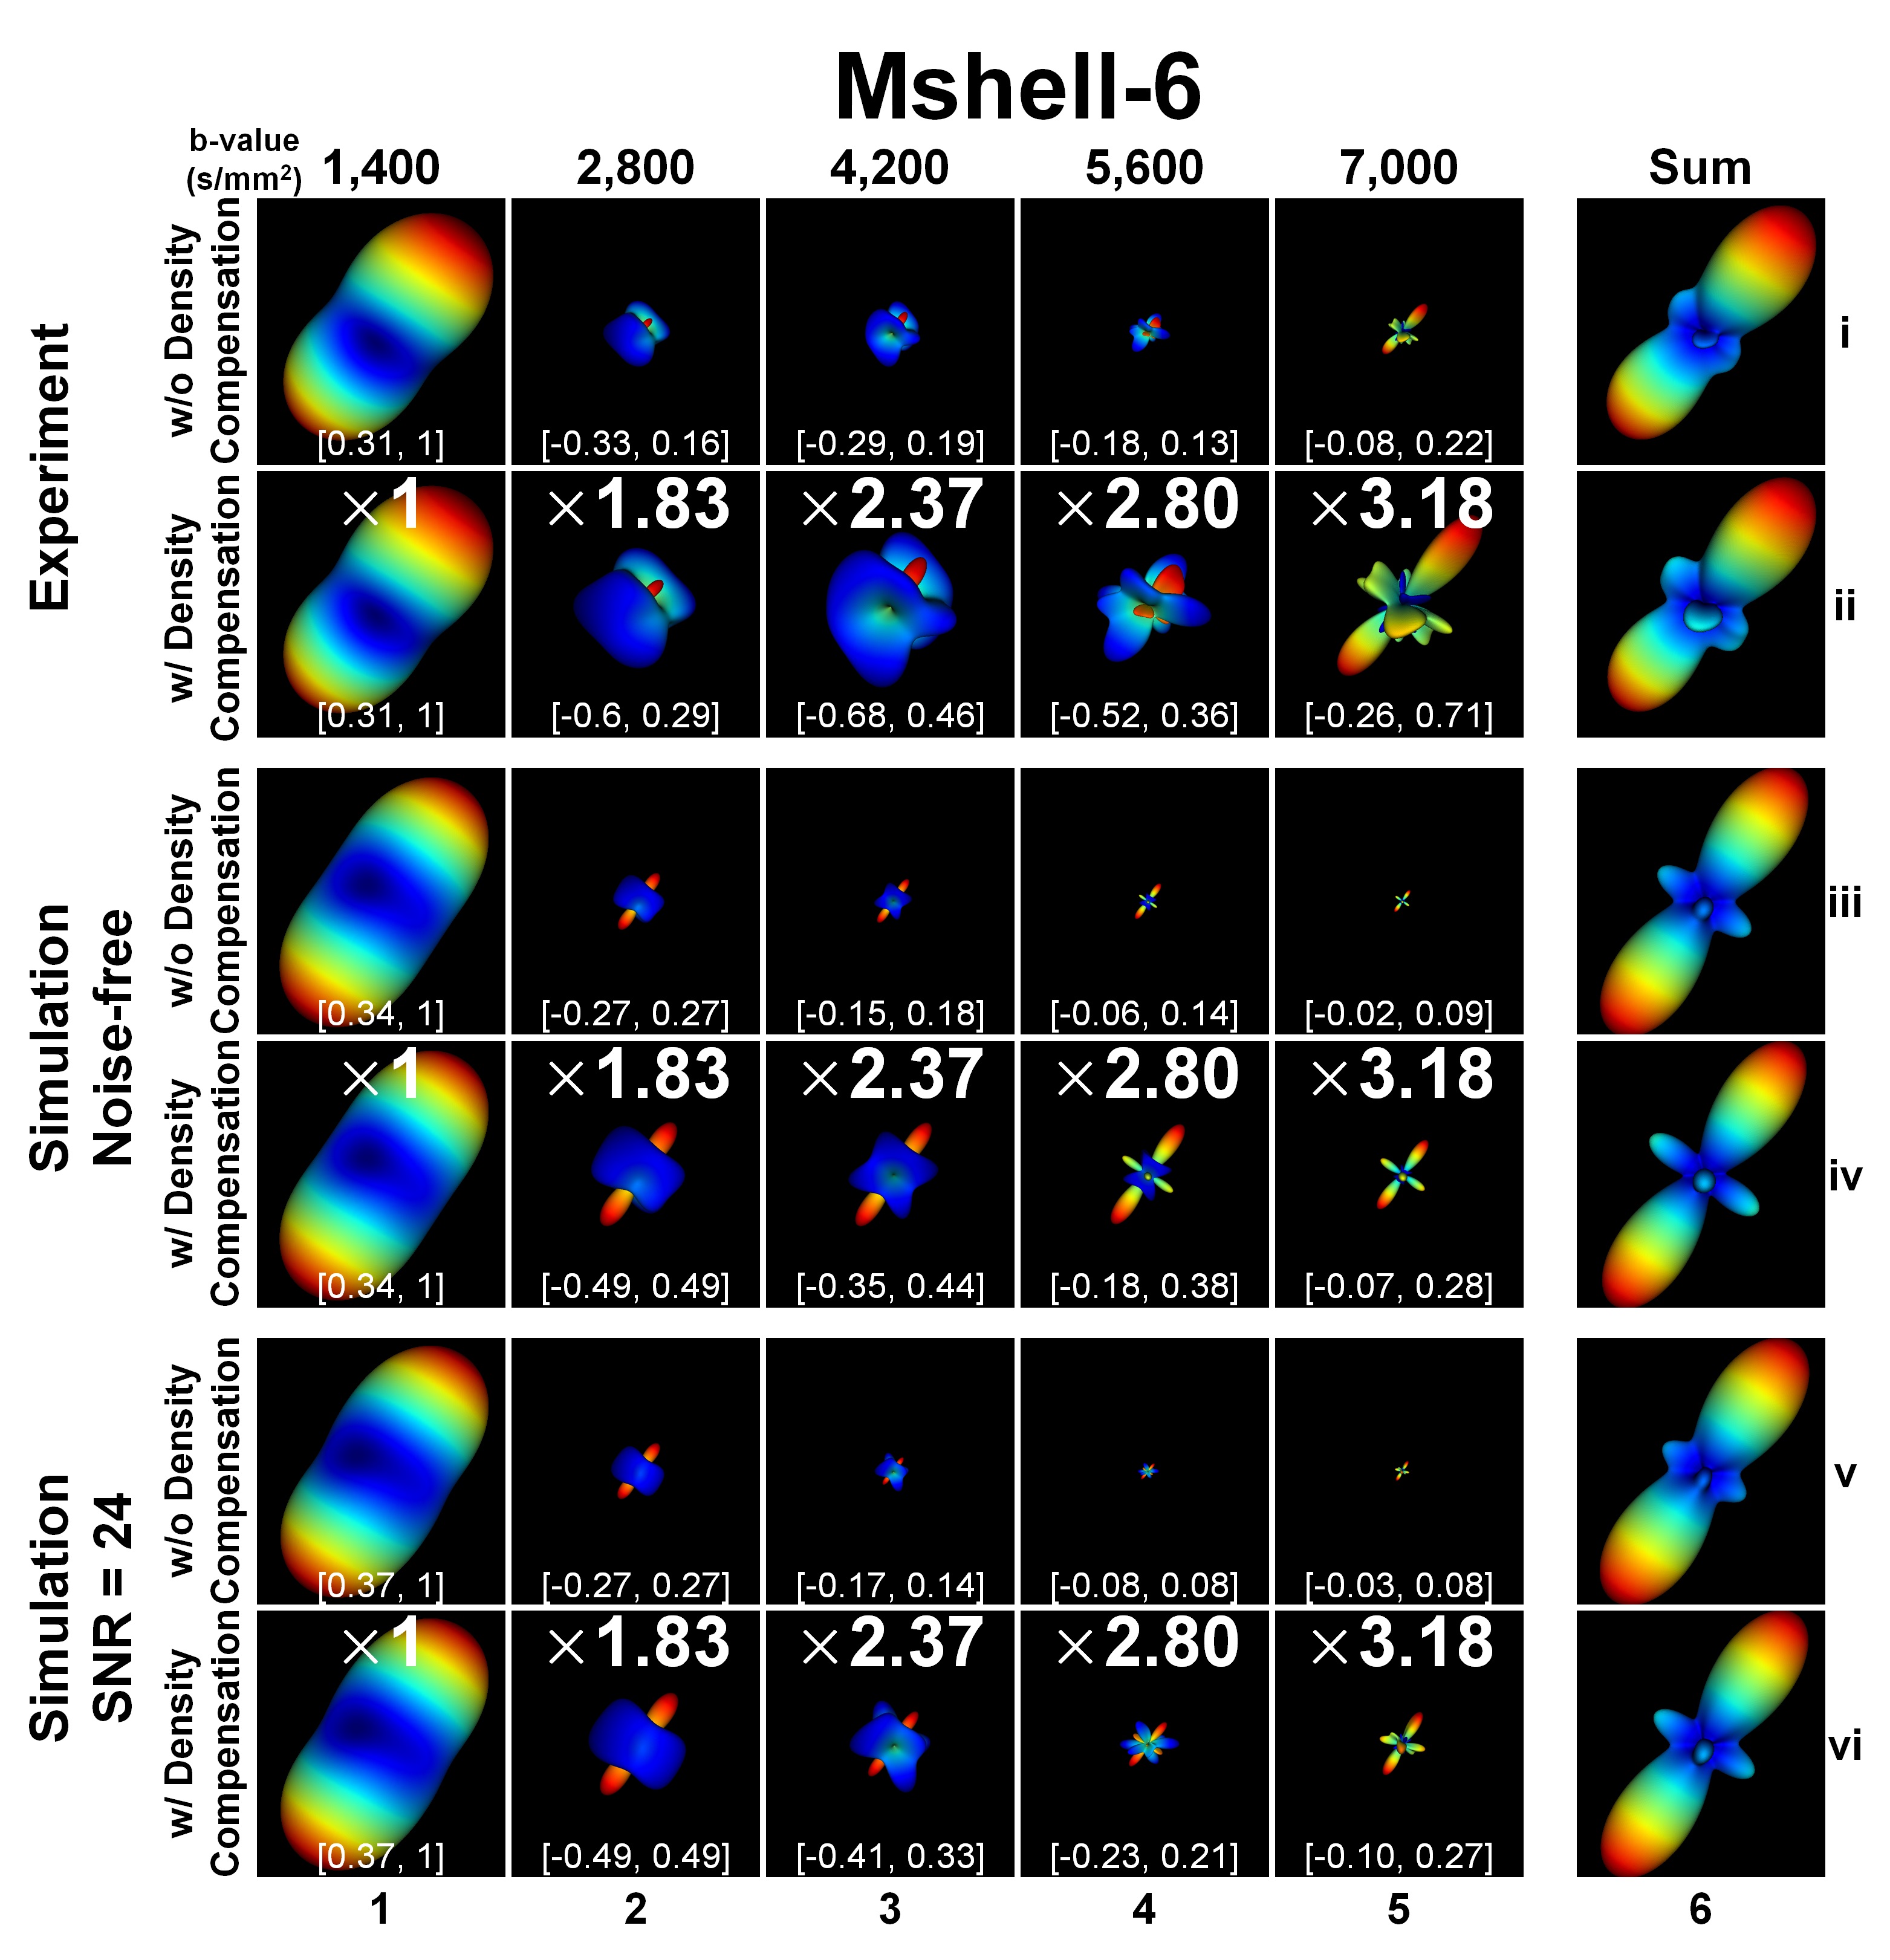
Figure 4 displays DSI-style ODFs reconstructed from multi-b-shell data (column 6) using GQI and their frequency components at each b-value (columns 1-5). ODFs reconstructed with q-space sampling density correction are sharper (rows ii, iv, vi v.s. rows i, iii and v) because density correction increases the contribution from high-b-values. Negative values in the component ODFs from different b-shells suggest that the sharpness of the final ODF depends on a combination of both positive and negative ODF components.
Figure 5 displays ODFs reconstructed using GQI and q-space sampling density correction, from MGH-USC and WU-Minn HCP multi-b-shell data. ODFs reconstructed with q-space sampling density correction are sharper (column 2 v.s. 1) and therefore provide better delineation of crossing fibers (column 4 v.s. 3).
Summary
We have proposed a model-free Fourier approach to reconstruct DSI-style diffusion propagators and ODFs from multi-b-shell data. We also demonstrated DSI-style ODFs at single b-values and show how they are combined under the Fourier assumption.Acknowledgements
Funding was provided by GE Healthcare, NIH: P41-EB015891, S10-RR026351, R01 NS095985-01A1.References
1. Wedeen VJ, et al. Mapping complex tissue architecture with diffusion spectrum magnetic resonance imaging. Magnetic Resonance in Medicine. 2005;54(6):1377-86.
2. Wedeen VJ, et al. The geometric structure of the brain fiber pathways. Science. 2012;335(6076):1628-34.
3. Tian Q, et al. Q-space truncation and sampling in diffusion spectrum imaging. Magnetic resonance in medicine. 2016.
4. Descoteaux M, et al. Multiple q-shell diffusion propagator imaging. Medical image analysis. 2011;15(4):603-21.
5. Descoteaux M, et al. Diffusion propagator imaging: using Laplace’s equation and multiple shell acquisitions to reconstruct the diffusion propagator. International Conference on Information Processing in Medical Imaging. 2009; Abstract 1-13.
6. Hosseinbor AP, et al. Bessel fourier orientation reconstruction (bfor): An analytical diffusion propagator reconstruction for hybrid diffusion imaging and computation of q-space indices. NeuroImage. 2013;64:650-70.
7. Callaghan PT. Principles of nuclear magnetic resonance microscopy: Clarendon Press Oxford; 1991.
8. Callaghan PT, et al. NMR microscopy of dynamic displacements - k-space and q-space imaging. Journal of Physics E-Scientific Instruments. 1988;21(8):820-2.
9. Caruyer E, et al. Design of multishell sampling schemes with uniform coverage in diffusion MRI. Magnetic Resonance in Medicine. 2013;69(6):1534-40.
10. Wu Y-C, et al. Hybrid diffusion imaging. NeuroImage. 2007;36(3):617-29.
11. Sotiropoulos SN, et al. Advances in diffusion MRI acquisition and processing in the Human Connectome Project. Neuroimage. 2013;80:125-43.
12. Jenkinson M, et al. FSL. NeuroImage. 2012;62(2):782-90.
13. Garyfallidis E, et al. Dipy, a library for the analysis of diffusion MRI data. Frontiers in neuroinformatics. 2014;8.
14. Yeh F-C, et al. Generalized q-sampling imaging. IEEE transactions on medical imaging. 2010;29(9):1626.
Figures