3527
Qualitative and quantitative assessment of intravoxel incoherent motion (IVIM) parameters in hypoxic tumor of a mouse to find a relationship with 18F- misonidazole PET imaging1Seoul St.Mary Hospital, The Catholic University of Korea, Seoul, Korea, Republic of, 2Incheon St.Mary Hospital, The Catholic University of Korea, Incheon, Korea, Republic of, 3Siemens Healthcare, Seoul, Korea, Republic of
Synopsis
Intravoxel incoherent motion (IVIM) based analysis of diffusion weighted imaging (DWI) has been suggested as a non-invasive tool to characterize tumor hypoxia, but no study has been performed to directly measure its parameters within the hypoxic tumor regions. In this study, we qualitatively and quantitatively compared IVIM parameters with 18F- misonidazole PET imaging and tested the feasibility of using non-invasive imaging strategy to define tumor hypoxia. Our preliminary result successfully related perfusion fraction values to standardized uptake values (SUVs) from PET and showed a potential of DWI as a tool to evaluate tumor oxygenation.
Purpose
Tumor hypoxia, which results from imbalance between oxygen demand and capacity to deliver sufficient oxygen cause resistance to therapies and promote tumor malignancy1. Intravoxel incoherent motion (IVIM) based analysis of diffusion weighted imaging has been suggested as a potential tool to characterize perfusion and diffusivity in hypoxic tumor2. To our knowledge, however, no study has been performed to directly correlate IVIM parameters with the concentrations of injected radiopharmaceutical agents. The objective of this study was to compare standardized uptake values (SUVs) of 18F- misonidazole PET imaging with IVIM parameters in hypoxic tumor of a mouse, and we hypothesized that high SUV regions designated as hypoxic tumor areas would be negatively correlated with perfusion fraction values.Methods
Subject
A male athymic rat at 6 weeks of age was anesthetized, and then a single dose of 1 x 10⁷ A549 human non-small cell lung cancer cells (American Type Culture Collection; Manassas, VA, USA) in 200μl of phosphate buffer saline was injected subcutaneously into the flank of the rat. When the tumor reached an appropriated size, the fiducial marking was done for multimodal scannings.
Image acquisition
For 18F-Fmiso PET/CT, the rat was injected with 30 ± 1.9 MBq of 18F-Fmiso via the tail vein. PET/CT scanning was performed at 180 min after injection of the radiotracer using a small-animal PET/CT machine (Nano PET/CT, Bioscan, Inc., Washington, DC, USA). The acquired PET/CT images were reconstructed using a Monte Carlo method, combined with scatter and random corrections. Intravoxel incoherent motion imaging was performed on a 3T scanner (Siemens Healthcare, Erlangen, Germany) using a single-shot echo-planar imaging pulse sequence with sequential 3 orthogonal diffusion sensitizing gradients and with 11 b-values (TR = 3100ms, TE = 48ms, EPI factor = 108, b-values = 0, 25, 50, 75, 100, 150, 200, 300, 500, 700, 1000sec/mm2, BW = 1700Hz/pixel, FA = 90°, voxel size = 1.875 x 1.875 x 4mm3 and FOV = 60 x 120 x 60mm3).
Image processing
The 18F- misonidazole PET images were further processed to produce a SUV map. A voxel-based analysis of IVIM was performed by calculating perfusion fraction (f), true diffusion (D) and pseudo-diffusion (D*) maps using a two-step segmented biexponential fitting model.3, 4
Correlation analysis
The SUV and IVIM parameter maps were both qualitatively and quantitatively assessed. First, the entire maps were visually compared to examine overall behaviors of SUV and IVIM values. Second, each row of the tumor region was averaged to observe its column-wise characteristics. Finally, voxels from high and low SUV regions were compared with corresponding IVIM parameters, and average f, D and D* values were estimated.
Results
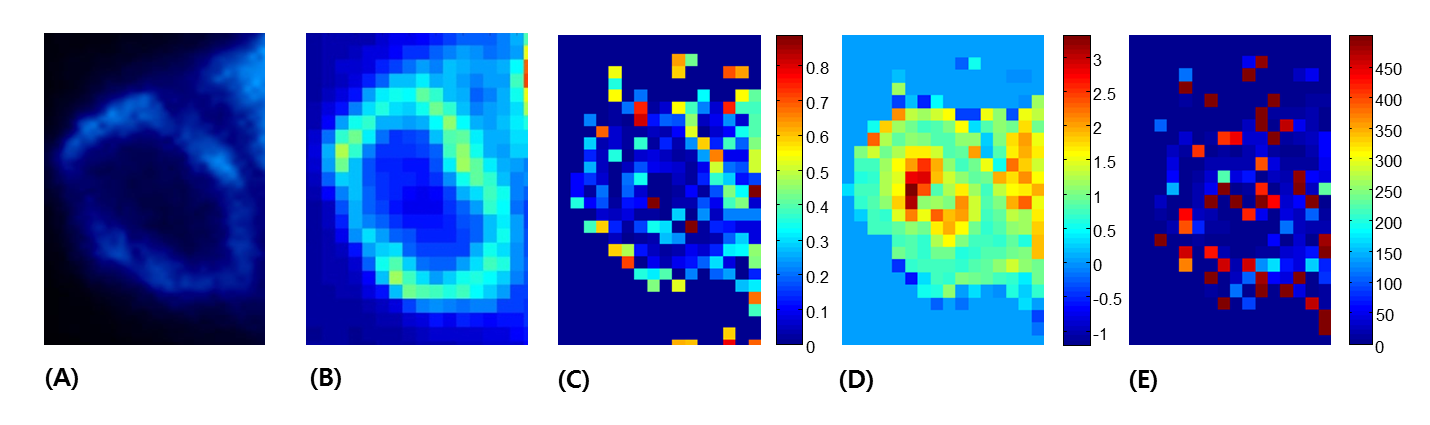
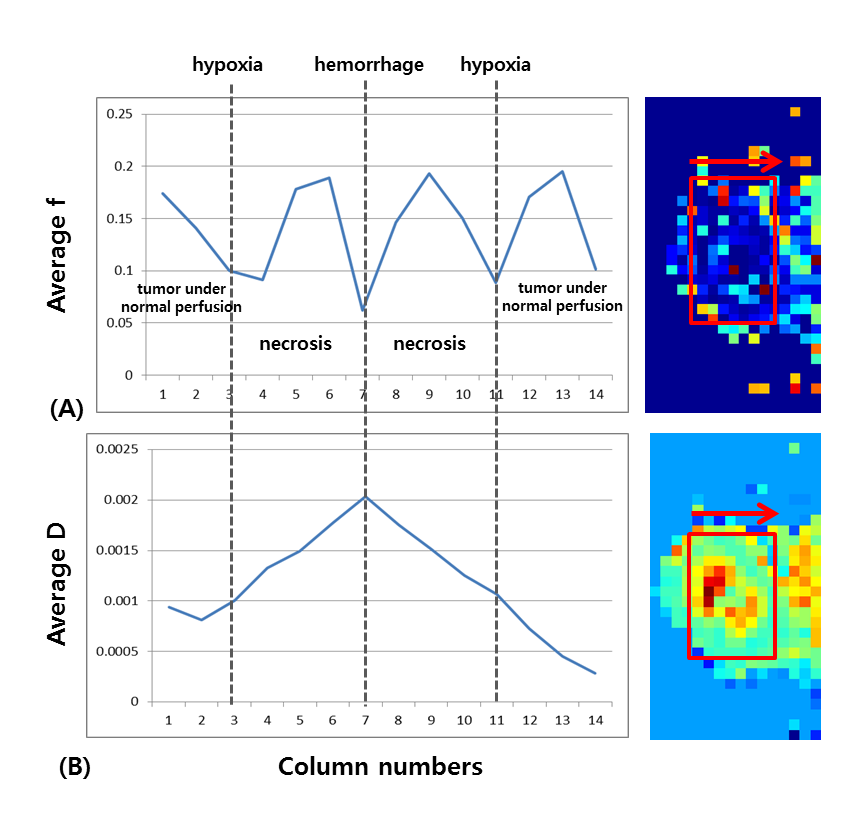
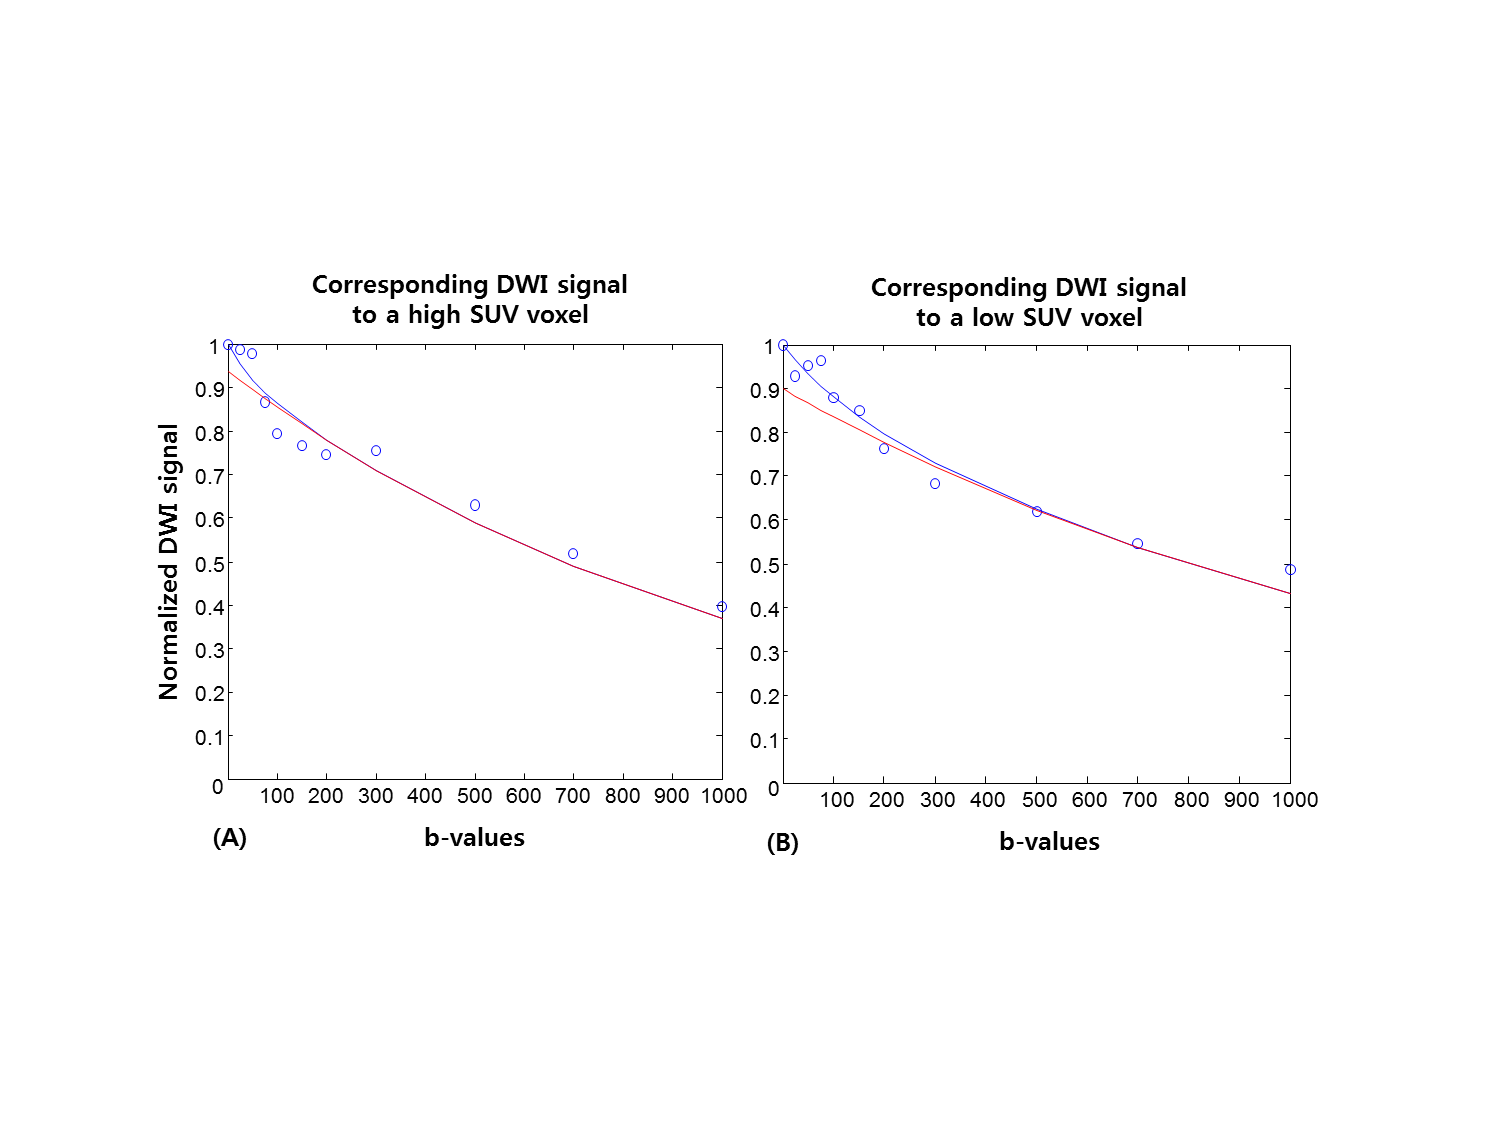
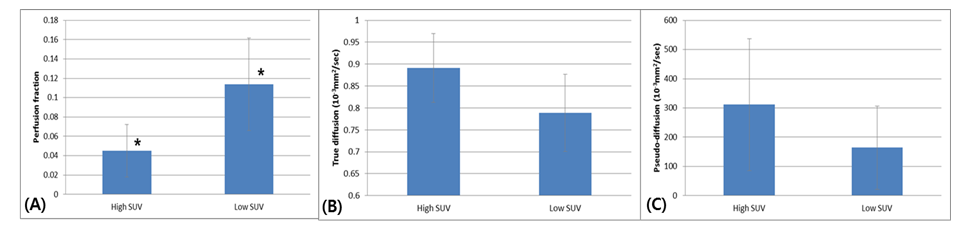
Figure 1 illustrates SUV, f, D and D* maps of the tumor region. The high SUVs are correlated with low f and D values. Figure 2 illustrates column-wise behaviors of f and D within different parts of the tumor. Looking from outside to inside, the tumor consisted of viable cells under normal perfusion, viable tumors under hypoxia, necrosis and hemorrhage at the core. Our result shows decreased f values compared to the adjacent necrosis or viable tumor areas. Figure 3 illustrates diffusion signal decay of two voxels, chosen from high and low SUV regions, respectively. Reduced perfusion is observed in a voxel chosen from high SUV regions. Figure 4 is bar graphs of IVIM parameters selected from high and low SUV regions. The voxel from higher SUV resulted in lower f and higher D and D* values than those from the lower SUV voxels. The average f, D and D* of high SUVs were 0.045, 0.89x10⁻³mm2/sec and 311x10-3mm2/sec, respectively, and those of the low SUVs were 0.11, 0.79x10⁻³mm2/sec and 164x10-3mm2/sec.
Discussion
Our preliminary results suggest that higher SUVs corresponded to lower perfusion fraction values and that it would be possible to non-invasively characterize tumor hypoxia with IVIM parameters, especially using D and f together. The limitations of this study involved different spatial resolutions between the SUV and IVIM parameter maps, which made a voxel-by-voxel correlation challenging, and non-reliability of the non-linear least-square curve-fitting method used to estimate IVIM parameters, which depended largely on initial value settings. Moreover, not all voxels fitted to the bi-compartmental model, and mono-exponential decay fitting of the signal was sufficient for many voxels. Future works involving more number of subjects with identical spatial resolutions between the two modalities and improved curve-fitting algorithm would help establish more solid IVIM baseline values for tumor oxygenation.
Conclusion
Our study demonstrated the feasibility of non-invasive measurement of tumor hypoxia using DWI by successfully relating IVIM parameters to high SUVs from PET.Acknowledgements
No acknowledgement found.References
1. Pacheco-Torres J, Lopez-Larrubia P, Ballesteros P, Cerdan S. Imaging tumor hypoxia by magnetic resonance methods. NMR Biomed. 2011;24(1):1-16.
2. Zhang Z, Hallac RR, Peschke P, Mason RP. A noninvasive tumor oxygenation imaging strategy using magnetic resonance imaging of endogenous blood and tissue water. Magn Reson Med. 2014;71(2):561-9.
3. Le Bihan D, Breton E, Lallemand D, Aubin ML, Vignaud J, Laval-Jeantet M. Separation of diffusion and perfusion in intravoxel incoherent motion MR imaging. Radiology. 1988;168(2):497-505.
4. Suo S, Lin N, Wang H, et al. Intravoxel incoherent motion diffusion-weighted MR imaging of breast cancer at 3.0 tesla: Comparison of different curve-fitting methods. J Magn Reson Imaging. 2015;42(2):362-70.
Figures