3525
Quantitative estimation of IVIM parameters and response evaluation after neoadjuvant chemotherapy in Osteosarcoma1Center for Biomedical Engineering, Indian Institute of Technology, New Delhi, India, 2Radiodiagnosis, All India Institute of Medical Sciences, New Delhi, India, 3Department of Physics, Indian Institute of Technology, New Delhi, India, 4Medical Oncology, Dr. B.R.Ambedkar Institute-Rotary Cancer Hospital, All India Institute of Medical Sciences, New Delhi, India, 5Department of Biomedical Engineering, All India Institute of Medical Sciences, New Delhi, India
Synopsis
Histological necrosis is the current gold standard for response evaluation in Osteosarcoma treated with neoadjuvant chemotherapy (NAC). However it is applicable only after tumour resection on completion of NAC. Thus, a non-invasive early marker of NAC response is desirable. We performed NAC response evaluation using Intra-voxel Incoherent Motion (IVIM) Diffusion weighted MRI using tumour volume change and histogram analysis. Tumour volume change and histogram analysis revealed similar and clinically useful information in chemotherapy response to Osteosarcoma.
Purpose
Histological necrosis is the current gold standard for response evaluation in Osteosarcoma treated with neoadjuvant chemotherapy (NAC), however it is the option only after tumour resection on completion of NAC. Prediction and evaluation of responsiveness to NAC early in the course of treatment might be more efficient. Therefore, a non-invasive imaging biomarker would be desirable for response evaluation to NAC in cancer therapy. Studies have shown that diffusion-weighted imaging (DWI) is sensitive to capture the early cellular changes in tumors, which precedes macroscopic volumetric response1,2. Moreover, quantitative analysis of Intra-voxel Incoherent Motion (IVIM) effect of DWI enables the simultaneous measurement of both diffusion and perfusion components and may provide detailed insight into the problem3,4. Objective of this study was to evaluate variations in volumetric changes and IVIM quantitative parameters in Osteosarcoma in the course of chemotherapy.Methods
IVIM dataset for five patients (M:F=5:0, Age=15.6±4.8 years), with Osteosarcoma were acquired under the Institutional Review Board approved protocol (IEC-103/05.02.2016, RP-26/2016). The acquisition was performed on 1.5T Philips Achieva MRI scanner with Spin Echo Planar imaging (SP-EPI) sequence with TE=66msec, TR=1782msec, 5mm slice thickness and 192x192 matrix size. The DW images were acquired at 11 b-values (0,10,20,30,40,50,80,100,200,400,800 s/mm2). All patients underwent pre-operative NAC. For each patient DWI data was acquired at three time points – pre-NAC (baseline), after 1stNAC (1stfollow-up) and after 3rdNAC (2ndfollow-up). RECIST1.15 score was used to differentiate between responders and non-responders based on DWI.
Apparent diffusion coefficient (ADC) was estimated using mono-exponential model (ME) for b≥ 200s/mm2. The IVIM parameters for Diffusion coefficient (D), Perfusion coefficient (D*), Perfusion fraction (f) were estimated using BE model4 and a novel methodology, bi-exponential model with Total Variation (TV) penalty function (BE+TV)6. It has been shown that BE+TV might be more useful for clinical interpretation compared to voxel-wise fitting of the IVIM Bi-exponential (BE) model6. Tumour volume at baseline, 1st &2nd follow-up and normal-tissue volume only at baseline were determined separately using ROIs drawn manually by a radiologist (>10years of experience). Histogram analysis7 was performed on diffusion parameters (ADC,D,D*&f) in tumour and normal ROI volume with following quantitative factors: mean, standard-deviation, skewness and kurtosis. Pearson correlation coefficient (PCC) was evaluated to measure the correlation between tumour volume and diffusion parameters. Analysis was performed using in-house software developed in MatlabR2013b.
Results
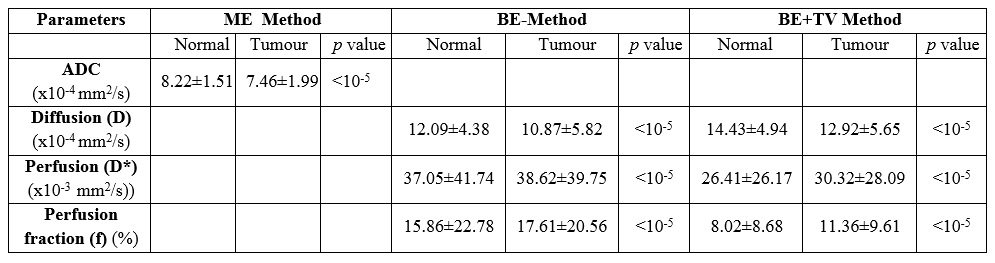
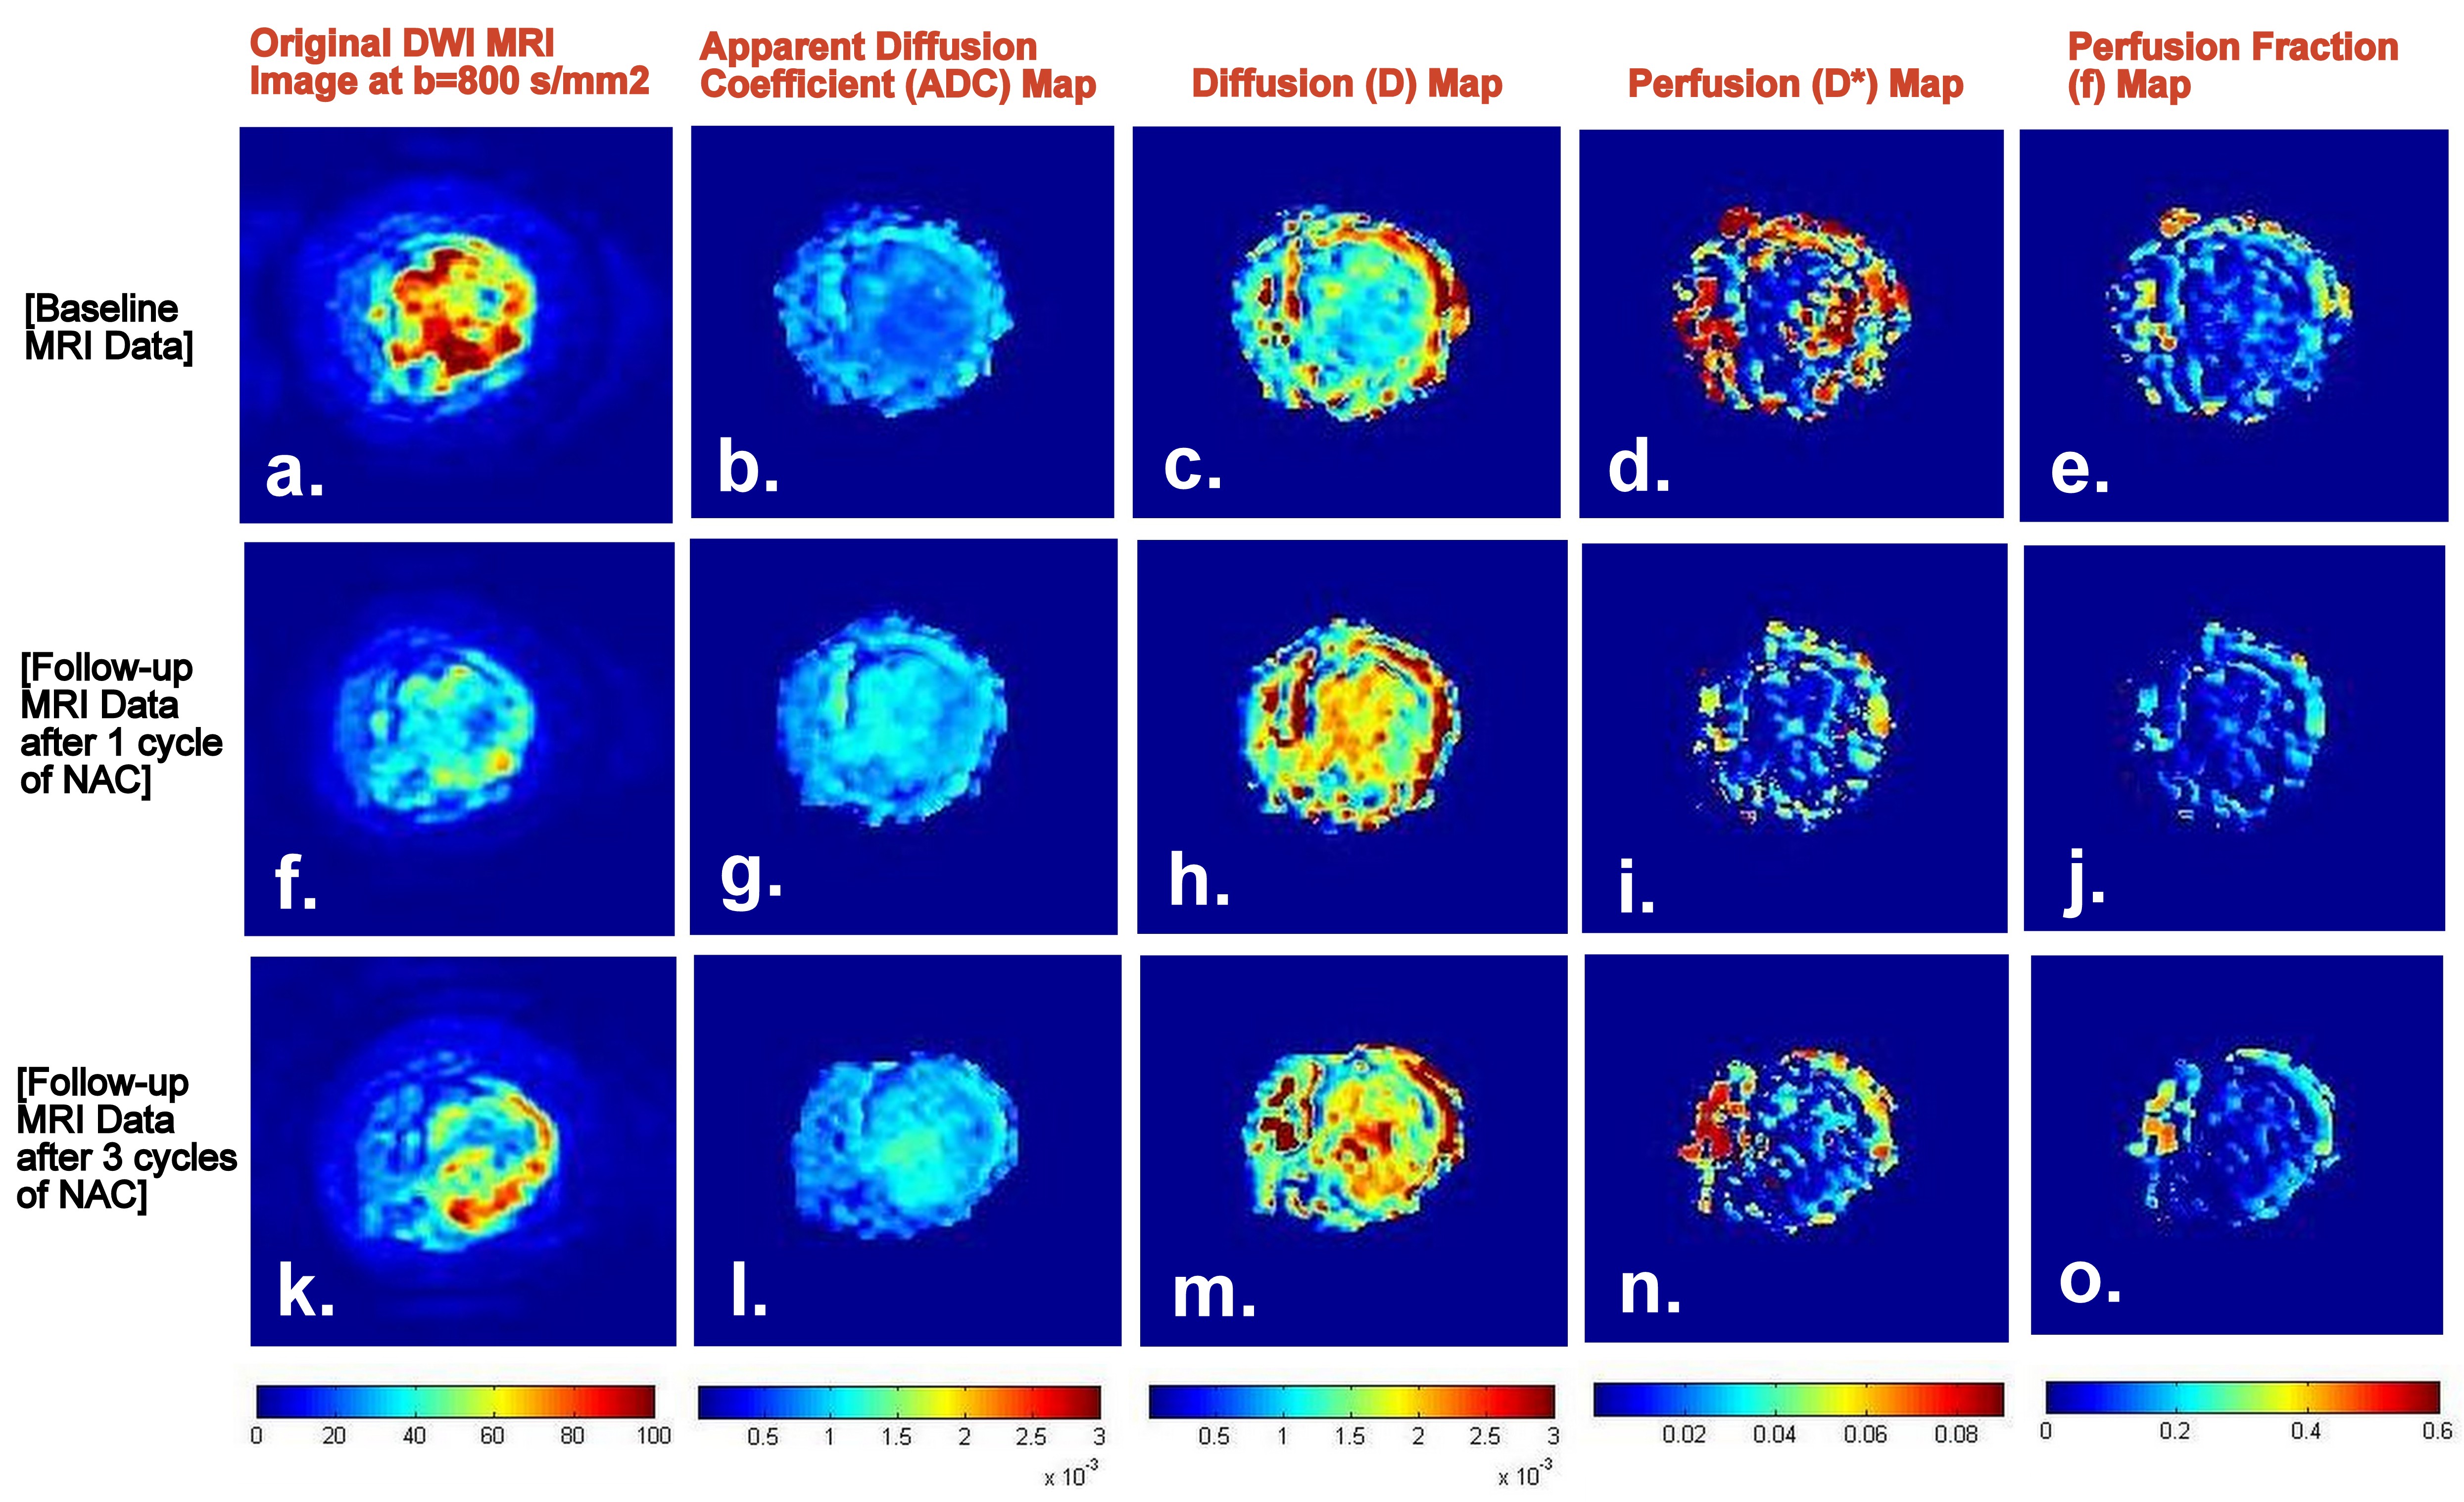
Mean values of diffusion parameters (ADC,D,D*&f) for tumour and normal ROI volume for baseline data are elaborated in Figure1. Both ADC&D were lower in tumour; while both D*&f were higher in tumour than normal tissue. Variability in D*&f measurements were observed lower and intergroup difference of mean D*&f values in normal and tumour tissue were found to be higher with BE+TV method than with BE method. Estimated parametric maps for ADC,D,D* &f from one representative patient at baseline, 1st and 2nd follow-up are shown in Figure2. Both ADC&D in tumour demonstrated an increase; whereas D*&f showed a decrease in tumour ROI after chemotherapy.
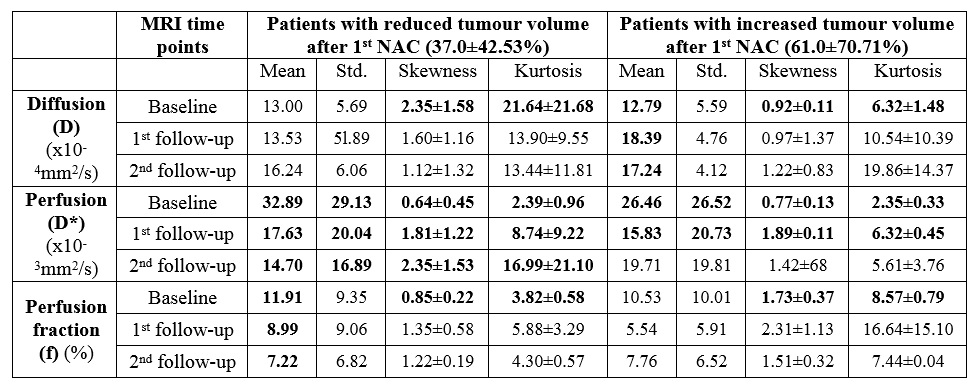
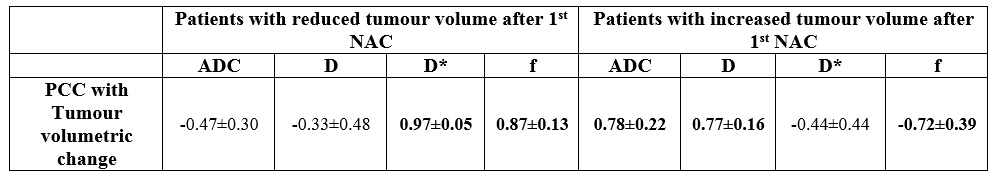
According to RECIST1.1 criteria all five patients were non-responders (<30% decrease or <20% increase in longest tumour diameter after NAC). We studied diffusion parameters with tumour volumetric change: three patients showed reduction in tumour volume (37.0±42.53%); whereas rest two patients demonstrated increase in tumour volume (61.0±70.71%) after 1stNAC. Histogram analysis of IVIM parameters in tumour at baseline, 1st and 2nd follow-up for all patients are summarized in Figure3. At baseline, skewness and kurtosis of D in tumour (1.78±1.37&15.51±17.54 respectively) were lower than normal tissue (3.71±1.41&34.05±16.62 respectively) for all patients. While mean and variability of D* in baseline tumor appeared to reduce after 1stNAC, skewness and kurtosis of D* in baseline tumour (2.44±0.79&0.70±0.38 respectively) shown an increase after 1stNAC (8.06±7.65&1.81±0.99 respectively) in all patients. Estimated PCC of diffusion parameters with tumour volumetric change from baseline to 1st and 2ndfollow-ups are summarized in Figure4.
Discussion
At baseline, comparatively lower ADC&D in tumour than normal tissue demonstrated a restricted diffusion; while higher D*&f in tumour than normal tissue might be indicative of increased vascularity in tumour as expected4,5. At baseline, in patients with decreased tumour volume skewness & kurtosis of D were higher and f were lower in tumour than other group. After NAC, in patients with decreased tumour volume, ADC&D showed negative and D*&f showed positive correlation with volumetric change; and the reverse trend was observed in patient with increasing tumour volume. Tumour volumetric change and histogram analysis might help in chemotherapy response assessment, although correlation with histopathology is yet to be performed.Conclusion
IVIM parameters and its histogram analysis with tumour volume change revealed clinically useful information in diagnosis and prognosis of Osteosarcoma treated with NAC.Acknowledgements
Authors would like to thank the Government of India for the funding support required for the study. EBK was supported with the research fellowship funds from Ministry of Human Resource Development, Government of India.References
1. Koh D.M., Collins DJ. Diffusion-weighted MRI in the body: applications and challenges in oncology. AJR.2007; 188:1622 – 1635.
2. Bajpai J. et al. Role of MRI in osteosarcoma for evaluation and prediction of chemotherapy response: correlation with histological necrosis. Pediatr Radiol. 2011; 41:441 – 450.
3. Le Bihan D. et al. Separation Of Diffusion And Perfusion In Intravoxel Incoherent Motion MR Imaging. Radiology. Aug, 1988; 168(2):497-505.
4. Koh D.M. et al. Intravoxel Incoherent Motion in Body Diffusion-Weighted MRI: Reality and Challenges. AJR. June, 2011;196: 1351–1361.
5. Eisenhauer E.A. et al. New response evaluation criteria in solid tumours: Revised RECIST guideline (version 1.1). European Journal of Cancer. 2009; 45:228 – 247.
6. Baidya Kayal E. et al. ‘Novel Strategy for Quantitative Analysis of IVIM Diffusion MRI in Ewing’s Sarcoma Family of Tumours’. ISMRM: Annual Meeting & Exhibition – 2016, May 7- 13, Singapore.
7. Mardia KV. Measures of multivariate skewness and kurtosis with applications. Biometrika. 1970; 57(3): 519-530.
Figures