3524
Diffusion Kurtosis Imaging with the breath hold method for staging of hepatic fibrosis: Potential as additional sequence in a clinical routine1Department of Medical Technology Image Laboratory, Tokyo Women’s Medical University Yachiyo Medical Center, Yachiyo, Japan, 2Division of Health Sciences, Graduate School of Medical Sciences, Kanazawa University, kanazawa, Ishikawa, Japan, 3Department of Radiological Service, The University of Tokyo Hospital, Japan, 4Department of Radiological Service, Tokyo Women's Medical University Medical Center East, Japan, 5Department of gastroenterological medicine, Tokyo Women’s Medical University Yachiyo Medical Center, yachiyo, Japan
Synopsis
We evaluated hepatocellular degeneration using DKI analysis with the breath hold technique compared with the pathological appearance about chronic hepatic diseases and hepatic fibrosis. Using this DKI method in the liver the stage of hepatic fibrosis can be classified into normal hepatic fibrosis and early hepatic fibrosis, and into early hepatic fibrosis and advanced hepatic fibrosis. Thus, we consider that DKI analysis can reflect pathological classification accurately. We considere that this DKI method will be required to evaluate the degree of hepatic fibrosis and to monitor the progress of hepatic fibrosis as an additional sequence in a clinical routine.
INTRODUCTION
In histopathological analysis, patients without hepatic fibrosis or with early hepatic fibrosis have a low risk of liver failure, while those in stages higher than F2 (Fibrosis staging by New Inuyama classification system; F0-F4) have a higher risk of liver failure1. Therefore, early detection and evaluation of hepatic fibrosis are very important and necessary. Recently, non-Gaussian diffusion-weighted imaging (DWI) techniques such as q- space imaging (QSI) and diffusional kurtosis imaging (DKI) have emerged as advanced methods to evaluate tissue microstructure in vivo using water diffusion2. These methods have been introduced to estimate real structural information3. Additionally, this method is theoretically superior to the conventional Gaussian diffusion analysis such as DWI or Intravoxel incoherent motion MRI. The analysis of kurtosis described by Jensen and associates does not need the full diffusion displacement probability distribution4, hence we could use the breath hold method for DKI acquisition as an additional sequence in a clinical routine to evaluate hepatic fibrosis. Therefore, the purpose of this study is to evaluate hepatocellular degeneration using DKI analysis with the breath hold technique compared with the pathological appearance about chronic hepatic diseases and hepatic fibrosis.METHODS
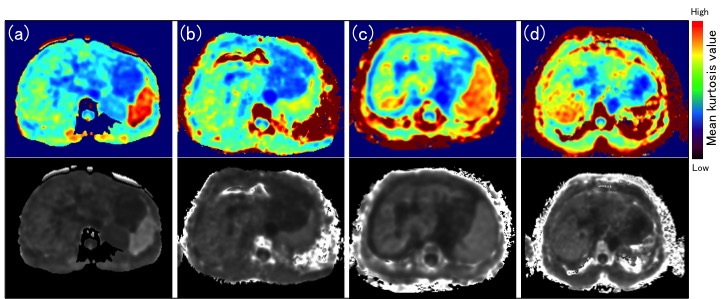
During a period of 12 months, patients (n=90; 42 men and 48 women; mean age, 64 years) suspected of having disease of the hepatobiliary system as well as healthy volunteers (n=15; 9 men and 6 women; mean age, 30 years) were examined with diffusion-weighted imaging using 3.0T MRI unit (Achieva; Philips Healthcare, Best, the Netherlands). DKI was acquired by using a single-shot, spin echo EPI sequence with three diffusion weightings (b = 0, 1000 and 2000 s/mm2) along three directions (frequency encoding, phase encoding, and section select). The other imaging parameters were set at TR, 2500 ms; TE, 58 ms; flip angle, 90 degrees; field of view, 400 × 400 mm2; matrix, 80 × 80; slice thickness, 5.0 mm. Referring to T2-weighted MR image, regions of interest (ROI) were always placed in the posterior segment of the right hepatic lobe to avoid the major vessels, large bile ducts, liver edges, and motion artifacts. To evaluate hepatic fibrosis, mean kurtosis values were compared between groups with different fibrosis condition and a healthy volunteer. In particular, we evaluated the significant difference in the group of fibrosis suspected, fibrosis, non-fibrosis, and healthy volunteer. In addition, the mean kurtosis values measured in each stage of fibrosis on DKI were compared between the different groups of lesions. For non-parametric multiple comparison, the Steel-Dwass test was used for overall comparison. Correlations between the fibrosis stage and mean kurtosis values were assessed using the Spearman rank correlation. DKI images were generated on a voxel-by-voxel basis with DKE software5 (Fig. 1).RESULTS
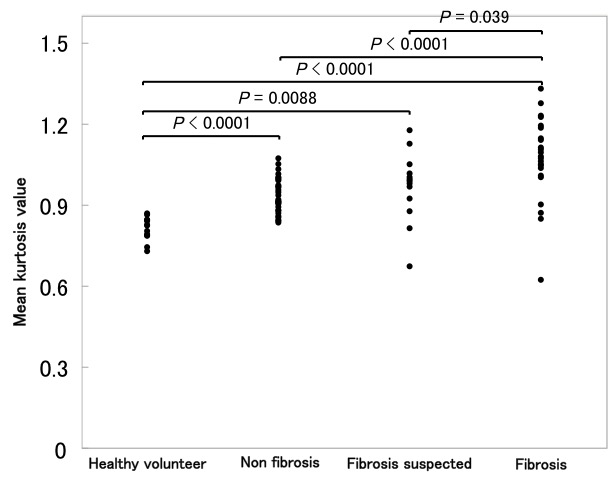
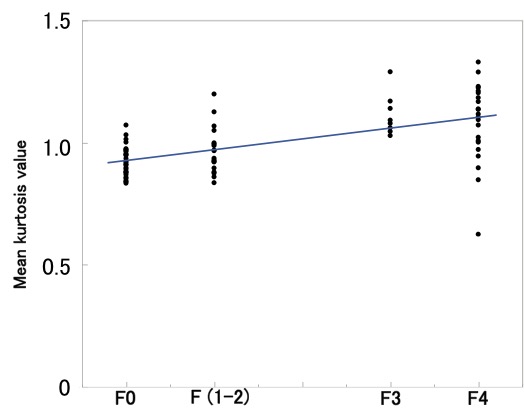
In the analysis of kurtosis to the liver by each classification, a statistically significant difference was not found only between the non-fibrosis group and the fibrosis suspected group (Fig. 2). Moreover, a statistically significant difference was found groups between F0 and F3, F0 and F4, F (1-2) and F3, and F (1-2) and F4 (Fig. 3). In hepatic mean kurtosis values by each classification, all groups were significantly high compared with the healthy volunteer. In addition, mean kurtosis values significantly correlated with the extent of staging in hepatic fibrosis (Fig. 4).CONCLUSION
Using the DKI method with the breath hold technique in the liver the stage of hepatic fibrosis can be classified into normal hepatic fibrosis and early hepatic fibrosis, and into early hepatic fibrosis and advanced hepatic fibrosis.Acknowledgements
No acknowledgement found.References
1. Ghany MG et al. Hepatology. 2009 Apr;49(4):1335-74.
2. Assaf Y et al. Magn Reson Med. 2002 Jul;48(1):71-81.
3. Fatima Z et al. Magn Reson Med Sci 2010; 9:109–110.
4. Jensen JH et al. Magn Reson Med. 2005 Jun;53(6):1432-40.
5. Tabesh A et al. Magn Reson Med 2011; 65:823–836.
Figures