3520
Comparing the LPCA and MPPCA denoising approaches for diffusion MRI using simulated human data1Indiana University, Indianapolis, IN, United States, 2University of College London
Synopsis
In this study, we investigate two denoising methods for diffusion MRI: the local PCA approach and Marchenko-Pastur (MP) PCA approach. Ground-truth diffusion-weighted images of the human brain are developed and used for noise simulation. Two diffusion-weighting b-values and two noise levels are generated as input data for both denoisers. Metrics of diffusion tenor imaging (DTI) and neurite orientation distribution and density (NODDI) are computed after denoising and compared between denoise methods.
Introduction
Recent developments in diffusion MRI desire higher spatial resolutions and higher b-values. High resolution offers better delineation of cerebral cortices1, white matter in gyral stalks2, and thin fiber tracts between the basal ganglia3. On the other hand, higher b-values (e.g., >1000s/mm2) open possibilities beyond classic diffusion tensor imaging (DTI). For example, neurite orientation distribution and density (NODDI) and diffusion kurtosis imaging produce biologically specific metrics4,5; q-space methods estimate the fundamental probability density function6-8; and q-ball imaging or spherical deconvolution provides sharper fiber orientation distribution function (ODF)9,10. However, high resolution and b-value often come with low signal-to-noise ratio (SNR). Low SNR may cause unreliable diffusion metrics for clinical applications and false positive peaks in the ODF that bias tractography. Therefore, similar to motion, eddy, and geometric distortion corrections, denoising may be an important step in diffusion MRI pre-processing pipelines. From a practical and end-user point of view, we conduct this study and compare the local principal component analysis (LPCA) approach11 and the recent proposed MPPCA approach, which fits the Marchenko-Pastur distribution to the PCA eigenspectrum12. Ground-truth diffusion-weighted (DW) images of the human brain at two b-values are generated and used to simulate two SNR levels. DTI and NODDI metrics are compared between denoising methods.Methods
DWI simulation: Whole brain noise-free DW images were simulated using the framework proposed in ref. 13, with 12 image volumes at b-value=0 s/mm2 (i.e., b0), 32 diffusion directions at b-value=700s/mm2 (b700) and 64 directions at b-value=2000s/mm2 (b2000). A single coil model was used and Gaussian noise was added to the real and imaginary channel of the data, producing Rician noise in magnitude images. Noise level was determined to produce the desired SNR on b0 image measured by estimatesnr (Camino, UCL). All together, three datasets was simulated: noise-free, SNR=20, and SNR=40.
Denoise: Both the LPCA and MPPCA denoising procedures were applied to all DW images of the SNR20 and SNR40 datasets. As suggested for MPPCA12, 3×3×3 and 5×5×5 kernel sizes were tested. All denoised, pre-denoise, and noise-free (i.e., ground truth) datasets were fit to the DTI and NODDI model4. Residual errors were examined by comparing each dataset with the noise-free dataset. Diffusion metrics considered were fractional anisotropy (FA), intra-neurite volume fraction (ICVF) and orientation dispersion index (OD).
Results
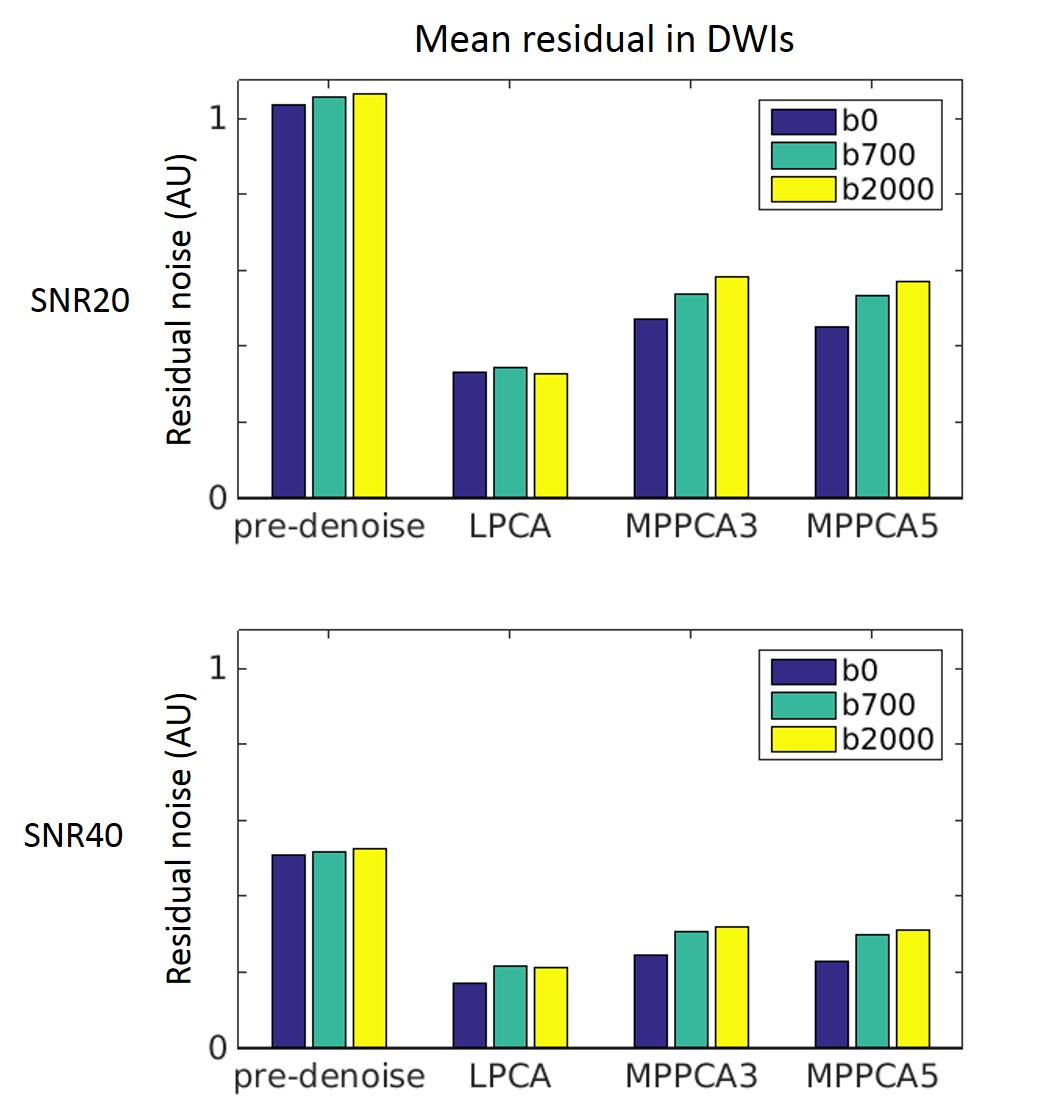
Runtime was 570 seconds for LPCA and 45 seconds for MPPCA per dataset with a matrix size of 72×86×55×108. Figure 1 shows the absolute residual noise level in DW images before and after denoise for both SNR levels. Both denoise methods reduced the noise level, but LPCA had the most noise reduction power for all b-values and for both SNR levels by a factor of approximately 2 to 3. In particular, the residual noise level was reduced from 1.0 to 0.33 with LPCA, and to 0.53 with MPPCA for SNR20. For SNR40, the residual noise level was reduced from 0.5 to 0.20 with LPCA, and to 0.29 with MPPCA.
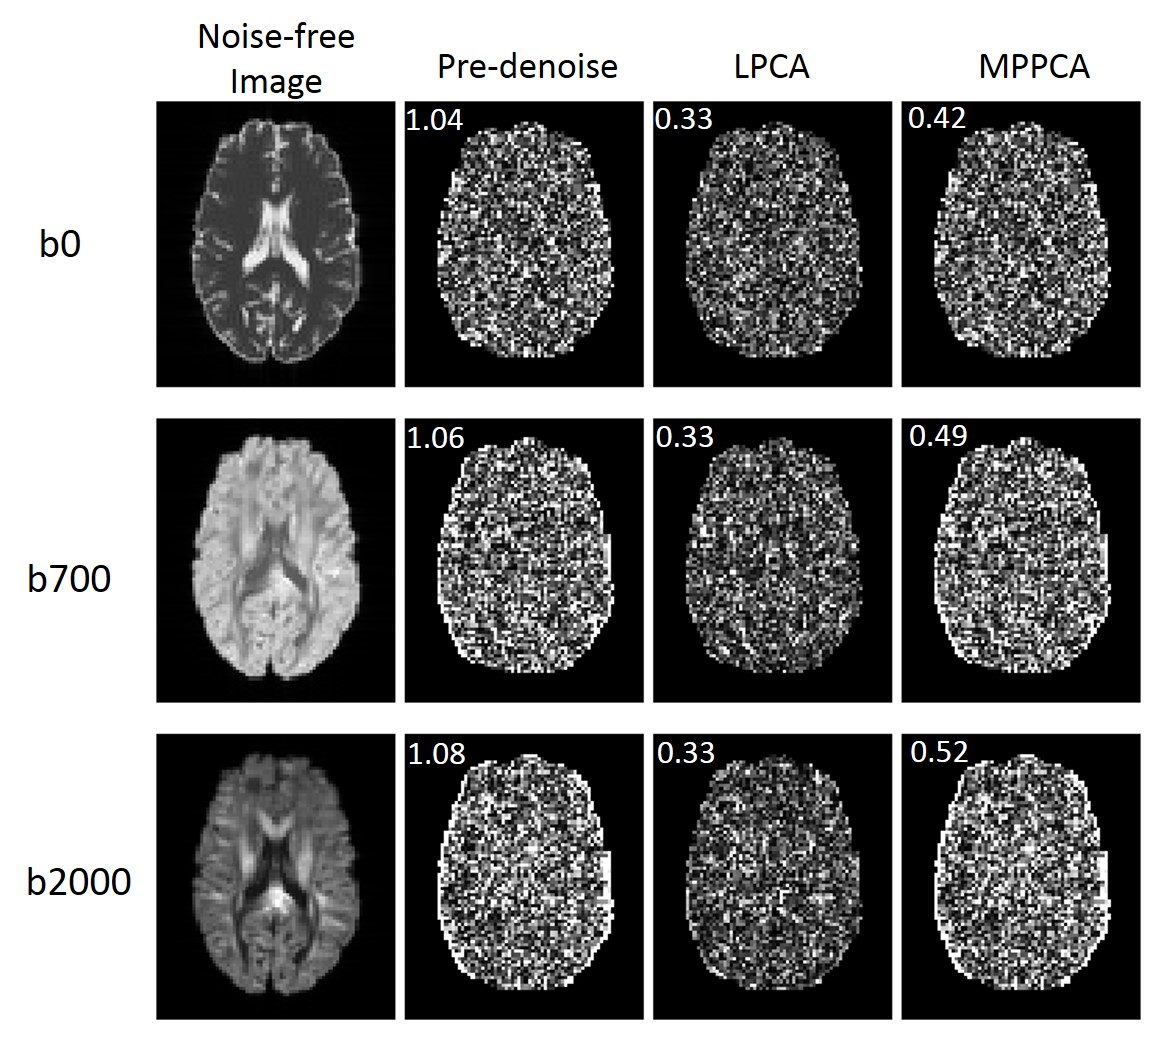
Increasing residual noise along with the b-values can be observed in the pre-denoise images as expected for a Rician noise distribution when signal got more attenuated for higher b-values. A similar trend was observed in MPPCA. In LPCA, however, this trend was not seen. Such patterns can also be appreciated in Figure 2, where LPCA demonstrated more consistent residuals for all b-values.
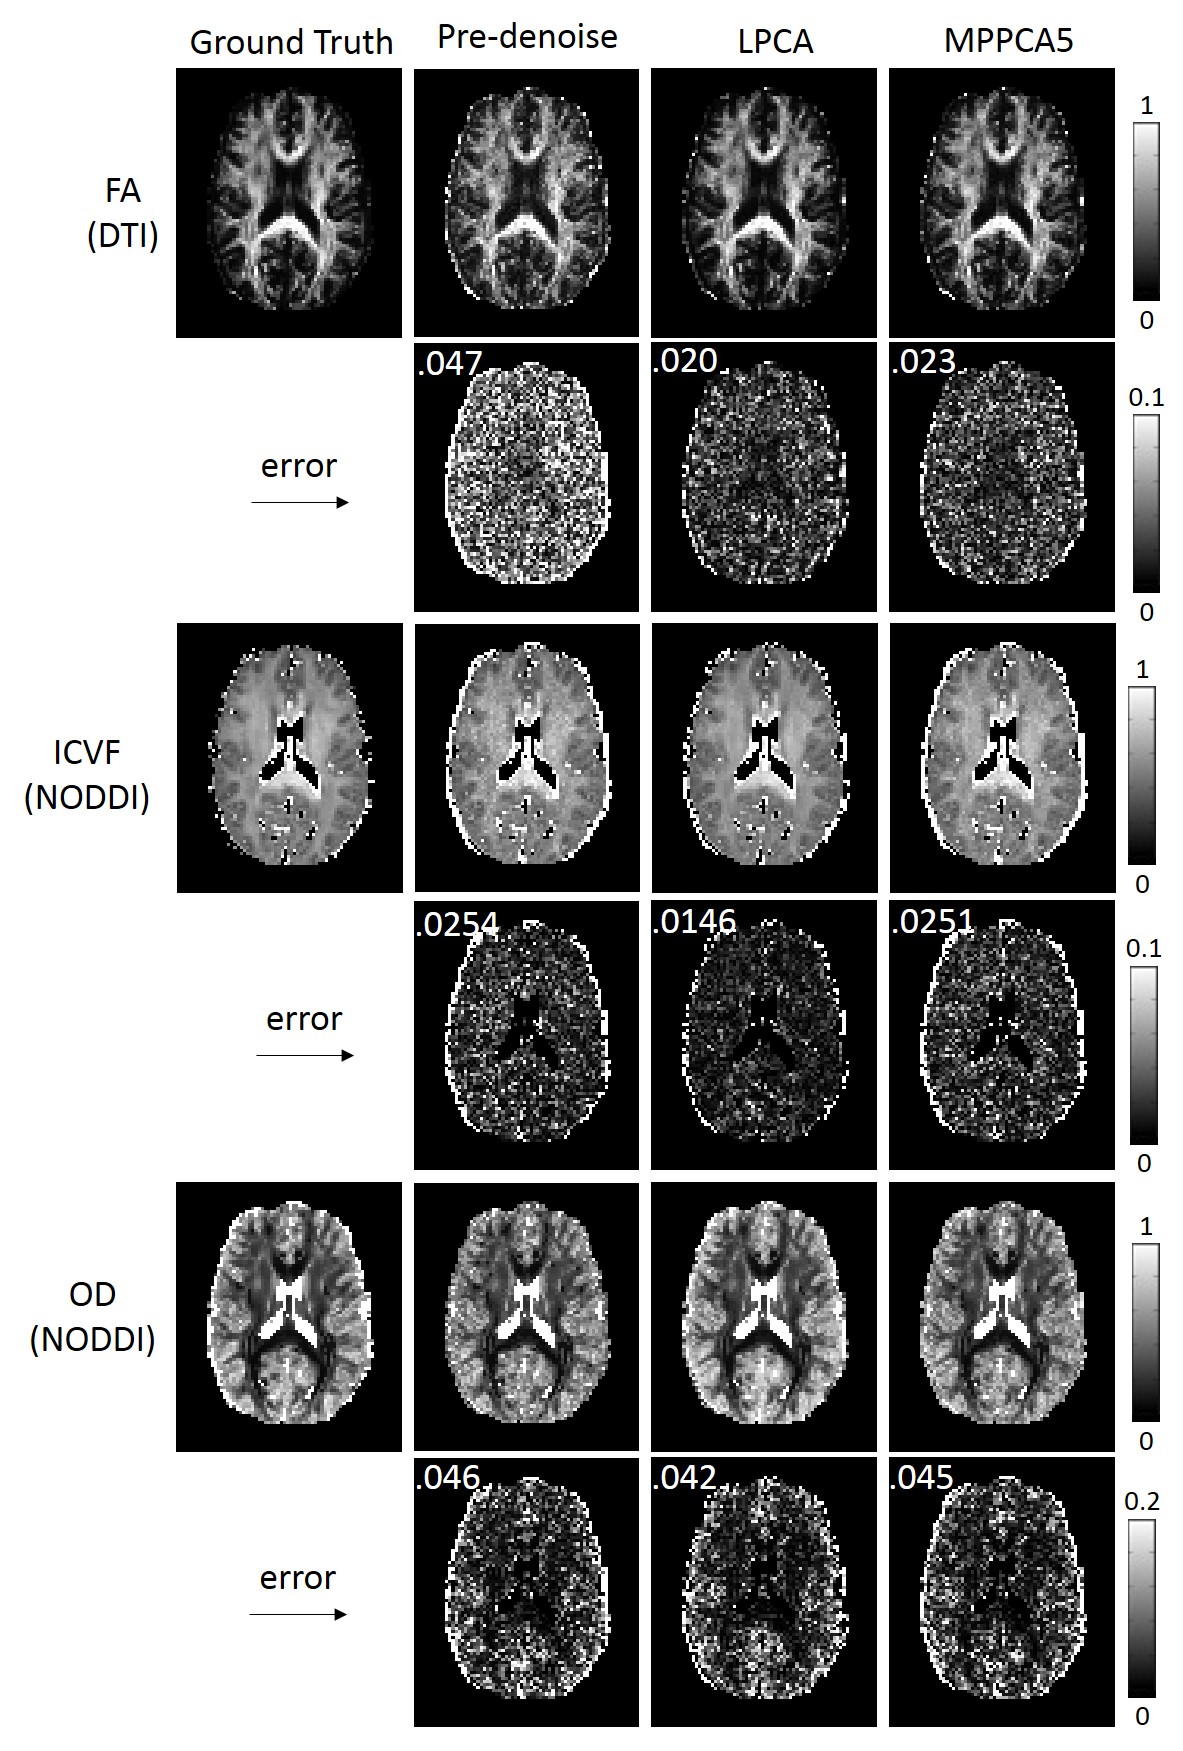
Figure 3 shows maps of the diffusion metrics FA, ICVF, OD and their errors for SNR20. Consistent with the barplot results in Figure 1, both LPCA and MPPCA improved image quality in diffusion metrics, and LPCA demonstrated the best results with minimum overall residual errors.
Discussion
Both LPCA and MPPCA methods are effective in reducing image noise while preserving the underlying DWI signal. Further, they both are able to improve image quality in the computed diffusion metrics. While runtime of LPCA method is significantly longer, it outperforms the MPPCA method. In addition, the more consistent residual error across different b-values indicates a good performance of Rician bias correction in the LPCA method. Unlike LPCA, MPPCA requires an input for kernel size. While a size of 5×5×5 demonstrated better results in this study, it may potentially be further optimized. However, requiring such optimization might be less desirable for standardizing processing pipelines. It is worth noting that with multi-coil, noise distribution of the magnitude image becomes non-central Chi and the performance of denoising methods might be different. This will be evaluated in the future work.Acknowledgements
No acknowledgement found.References
1. McNab, J.A., S. Jbabdi, S.C. Deoni, G. Douaud, T.E. Behrens, and K.L. Miller, High resolution diffusion-weighted imaging in fixed human brain using diffusion-weighted steady state free precession. Neuroimage, 2009. 46(3): p. 775-85.
2. McNab, J.A., J.R. Polimeni, R. Wang, J.C. Augustinack, K. Fujimoto, A. Stevens, C. Triantafyllou, T. Janssens, R. Farivar, R.D. Folkerth, W. Vanduffel, and L.L. Wald, Surface based analysis of diffusion orientation for identifying architectonic domains in the in vivo human cortex. Neuroimage, 2013. 69: p. 87-100.
3. Chang, H.C., M. Sundman, L. Petit, S. Guhaniyogi, M.L. Chu, C. Petty, A.W. Song, and N.K. Chen, Human brain diffusion tensor imaging at submillimeter isotropic resolution on a 3Tesla clinical MRI scanner. Neuroimage, 2015. 118: p. 667-75.
4. Zhang, H., T. Schneider, C.A. Wheeler-Kingshott, and D.C. Alexander, NODDI: practical in vivo neurite orientation dispersion and density imaging of the human brain. Neuroimage, 2012. 61(4): p. 1000-16. 5. Fieremans, E., J.H. Jensen, and J.A. Helpern, White matter characterization with diffusional kurtosis imaging. Neuroimage, 2011. 58(1): p. 177-88.
6. Ozarslan, E., C.G. Koay, T.M. Shepherd, M.E. Komlosh, M.O. Irfanoglu, C. Pierpaoli, and P.J. Basser, Mean apparent propagator (MAP) MRI: a novel diffusion imaging method for mapping tissue microstructure. Neuroimage, 2013. 78: p. 16-32.
7. Descoteaux, M., R. Deriche, D. Le Bihan, J.F. Mangin, and C. Poupon, Multiple q-shell diffusion propagator imaging. Med Image Anal, 2011. 15(4): p. 603-21.
8. Hosseinbor, A.P., M.K. Chung, Y.C. Wu, and A.L. Alexander, Bessel Fourier Orientation Reconstruction (BFOR): an analytical diffusion propagator reconstruction for hybrid diffusion imaging and computation of q-space indices. Neuroimage, 2013. 64: p. 650-70.
9. Tuch, D.S., Q-ball imaging. Magn Reson Med, 2004. 52(6): p. 1358-72.
10. Tournier, J.D., F. Calamante, D.G. Gadian, and A. Connelly, Direct estimation of the fiber orientation density function from diffusion-weighted MRI data using spherical deconvolution. Neuroimage, 2004. 23(3): p. 1176-85.
11. Manjon, J.V., P. Coupe, L. Concha, A. Buades, D.L. Collins, and M. Robles, Diffusion weighted image denoising using overcomplete local PCA. PLoS One, 2013. 8(9): p. e73021.
12. Veraart, J., D.S. Novikov, D. Christiaens, B. Ades-Aron, J. Sijbers, and E. Fieremans, Denoising of diffusion MRI using random matrix theory. Neuroimage, 2016.
13. Graham, M.S., I. Drobnjak, and H. Zhang, Realistic simulation of artefacts in diffusion MRI for validating post-processing correction techniques. Neuroimage, 2015.
Figures