3509
Assessing the Effect of Intravoxel Incoherent Motion on Diffusion Parameters in the Brain1Bernard and Irene Schwartz Center for Biomedical Imaging, Department of Radiology, New York University School of Medicine, New York University, New York, NY, United States, 2Medical Scientist Training Program, New York University School of Medicine, New York, NY, United States
Synopsis
We investigated the effect of intravoxel incoherent motion (IVIM) on the brain diffusion MRI signal in a cohort of 143 control patients. We compared the diffusivities derived from a mono-exponential fit at b =0 and 1ms/μm2 versus at b = 0.25 and 1 ms/μm2. This allowed for a quantitative assessment of the IVIM signal fraction f* in specific brain matter types. Our results show a significant difference in the mean diffusivity of about 3% in white matter and up to 7% in grey matter, with corresponding f* estimated to be about 2% and 6% in white and grey matter respectively.
Purpose
Diffusion MRI (dMRI) signal in biological tissues is generally non-monoexponential in $$$b$$$. For moderate diffusion weightings ($$$b > 1$$$ms/μm$$$^2$$$) the dMRI signal deviates from the mono-exponential model due to the genuine non-Gaussian diffusion characteristics in parenchyma. However, at low diffusion weighting, the dMRI signal may be contaminated by intravoxel incoherent motion (IVIM) from capillary perfusion.$$$^1$$$ While the principles of IVIM, which separately estimate tissue diffusivity and tissue microcapillary perfusion at low b values, were initially introduced for neurological disorders,$$$^1$$$ the IVIM effect so far has mainly been observed in cancers$$$^2$$$ and various hepatic and gastrointestinal diseases.$$$^{3,4,5}$$$ We report here our initial findings investigating the IVIM related effect on the dMRI signal in various brain regions in a cohort of 143 radiologically normal patients.Methods
143 subjects (62 male, mean age $$$=$$$ 50.2 $$$±$$$ 17.9) underwent MRI on a Magnetom Prisma 3T MRI system (Siemens AG, Erlangen, Germany). A monopolar diffusion-weighted EPI sequence was applied with b=0, 0.25, 1, and 2 ms/μm$$$^2$$$ along 84 directions in total. Data was acquired in a volume of 50 slices, 130 × 130 matrix, with voxel size = 1.7 mm × 1.7 mm × 3 mm, TE/TR = 70/3500 ms, GRAPPA with acceleration 2, and multiband 2.
dMRI images preprocessing included denoising,$$$^6$$$ Gibbs removal,$$$^{7}$$$ as well as eddy distortion and motion correction.$$$^8$$$ For each subject, the dMRI signal $$$S(b)$$$ was fitted to $$$S(b)=S_0 exp(-bD)$$$ using a weighted linear least square fit$$$^6$$$ to extract $$$S_0$$$ and the diffusion tensor $$$D$$$, based on S(b) from two different b-ranges: $$$b=0$$$ and 1 ms/μm$$$^2$$$, and $$$b=0.25$$$ and 1 ms/μm$$$^2$$$. Assuming that at both $$$b=0.25$$$ and 1 ms/μm$$$^2$$$ diffusion weighting is enough to exclude the effects of IVIM, the fit curve for $$$b=0.25$$$ and 1 ms/μm$$$^2$$$ was extrapolated to calculate $$$S_0^\prime$$$ as the “true” $$$S_0$$$ signal without IVIM contribution. Comparing $$$S_0^\prime$$$ to the measured $$$S_{0}$$$ (b=0 and 1 ms/μm$$$^2$$$) then allows one to calculate the IVIM signal fraction $$$f^*$$$ as shown in Eq. 1.
$$f^*= (S_0 – S_0')/(S_0)\,\quad(1) $$
Maps of the mean diffusivity (MD) calculated both for $$$b=0$$$ and $$$b=1$$$ ms/μm$$$^2$$$, and for $$$b=0.25$$$ and $$$b=1$$$ ms/μm$$$^2$$$, as well as maps of $$$f^*$$$ were derived for each subject, and mean values were extracted over several regions of interest. $$$S_0$$$ images were co-registered to the MNI152 T2 brain atlas to identify gray matter regions and FSL FAST$$$^9$$$ was used to reduce CSF and white matter partial voluming in relevant ROIs. Fractional anisotropy (FA) maps were co-registered to the JHU FA atlas using FNIRT$$$^9$$$ to identify white matter regions.
Results
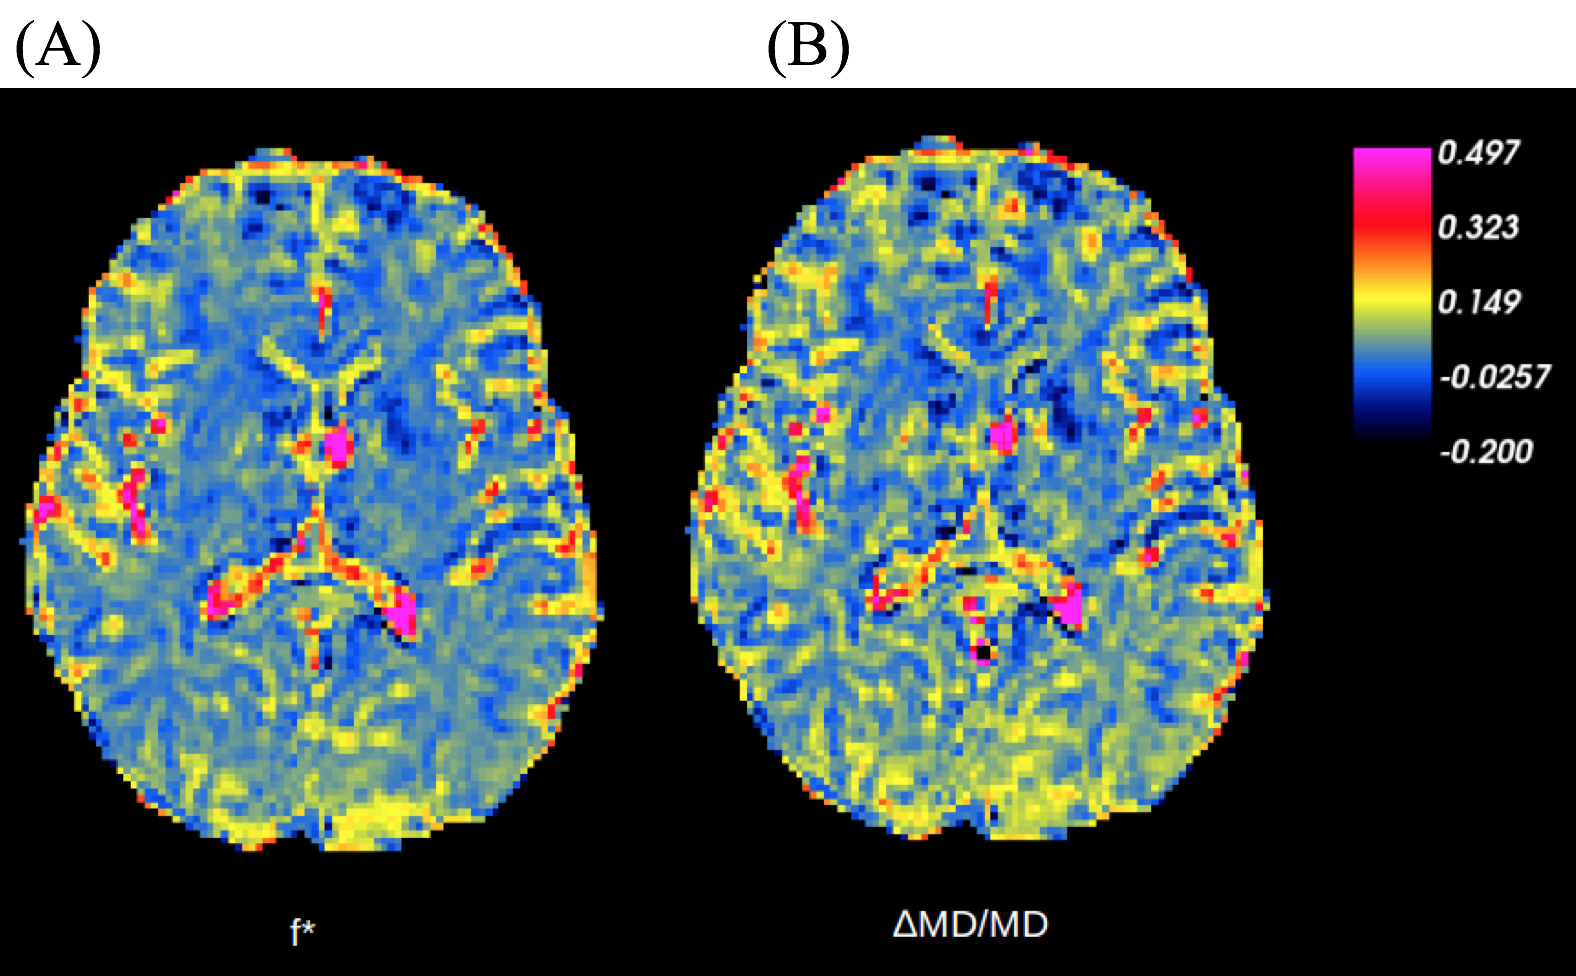
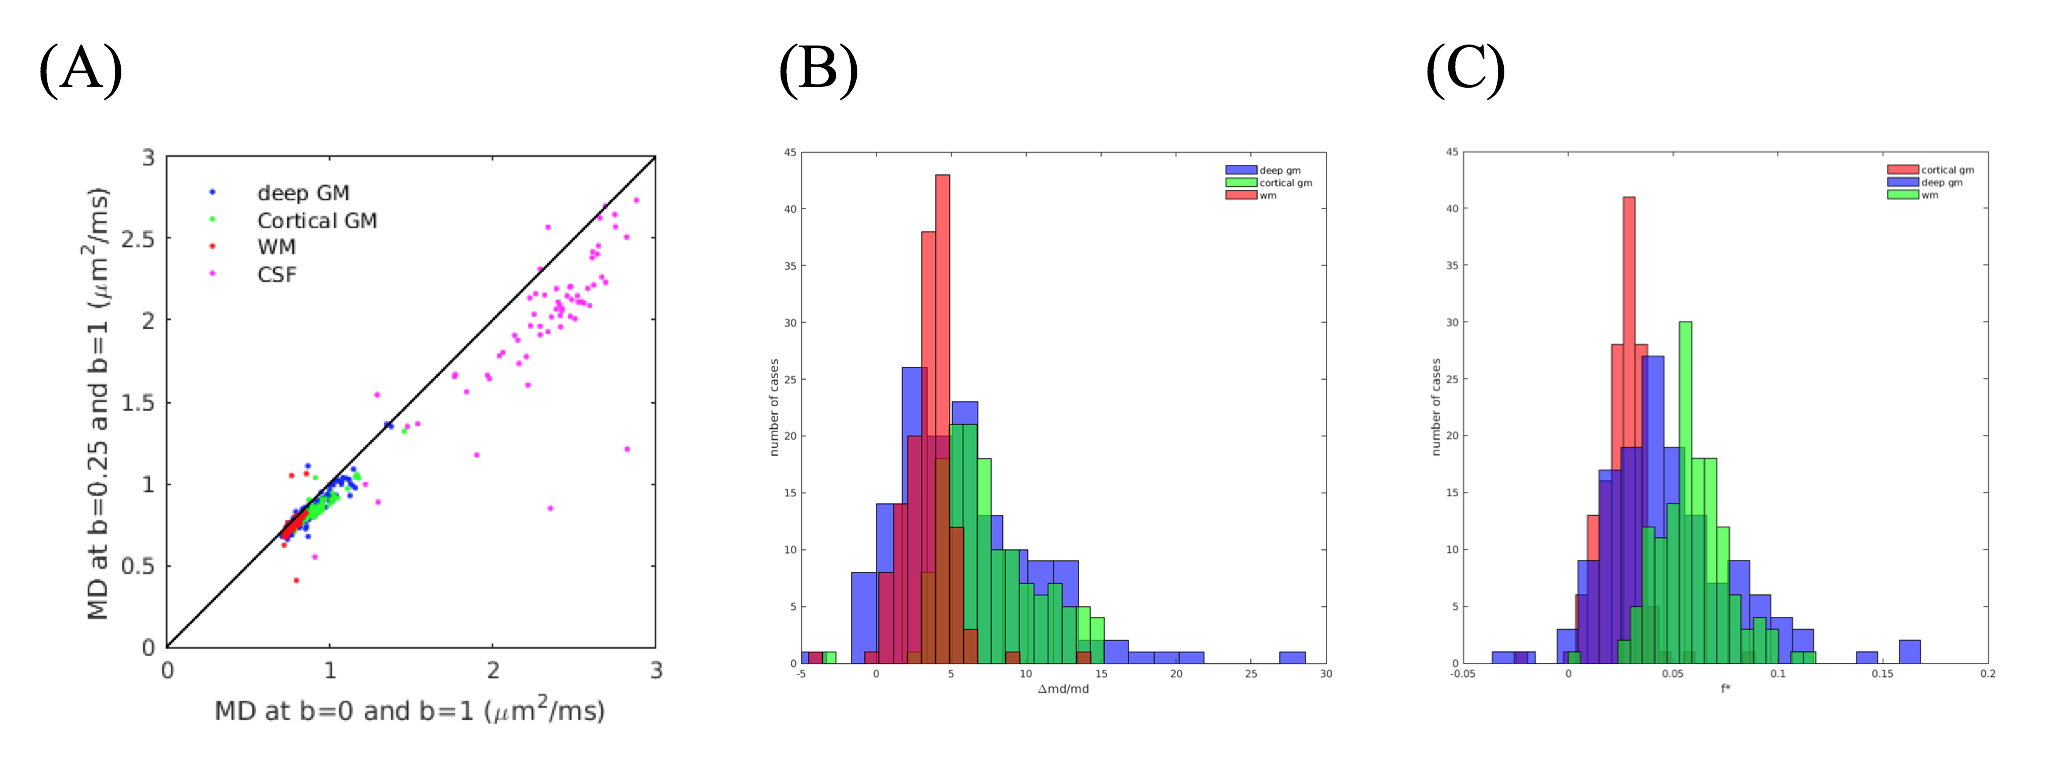
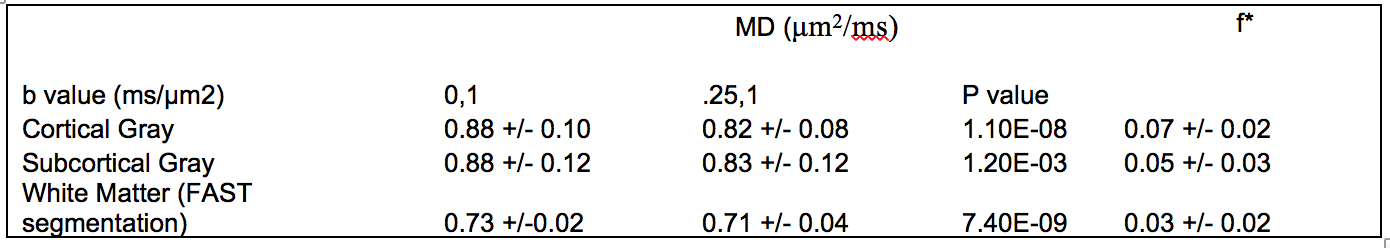
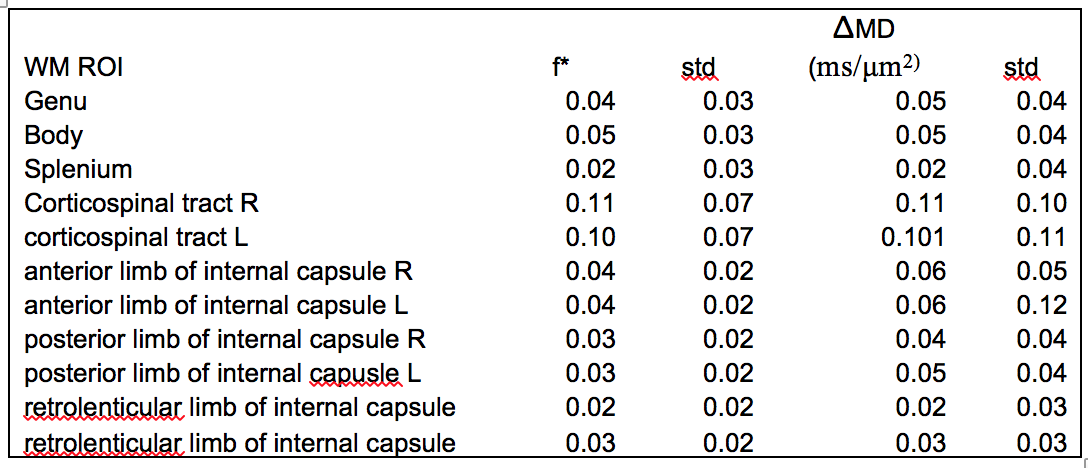
A representative subject’s map of $$$f^*$$$ is shown in Figure 1A and the difference between this subject’s MD calculated at $$$b=0$$$ and $$$b=1$$$ms/μm$$$^{2}$$$, and $$$b=0.25$$$ and $$$b=1$$$ms/μm$$$^2$$$ is shown in Figure 1B. The observed difference between calculated median MDs is shown in Figure 2A, and Figure 2B shows the distribution of the percent difference with respect to $$$MD_{0.25-1}$$$. $$$f^*$$$ was calculated to be on the order of 0.06 in deep GM, 0.05 in cortical GM, and 0.02 in WM and the distribution of the median $$$f^*$$$s is shown in Figure 2C. The difference between the median MDs is statistically significant from a one-tailed t-test (Table 1), and values of f* and MD in specific WM region of interests (ROI) are listed in Table 2.Discussion
A slight deviation from the mono-exponential model due to IVIM is observed in WM, while a larger deviation is observed in GM, and CSF (Figure 1). The much larger IVIM effect observed in GM and more so in CSF compared to WM may be due to greater levels of flow. Arteries and capillary networks densely run through the GM, but many terminate in the GM and primarily only large blood vessels continue to the WM towards the ventricular angle.$$$^{10}$$$ The corresponding estimated IVIM $$$f^*$$$ of 0.05 for cortical GM is about twice as large as $$$f^*$$$ of 0.02 in the WM, in agreement with well-known blood volume fractions in these tissues, This suggests that the IVIM effect is predominantly present in GM.
Conclusion
In brain, derived MD-values when including the $$$b=0$$$ signal are consistently larger compared to when excluding the $$$b=0$$$ signal, suggesting contribution from IVIM to the dMRI signal decay predominantly in the GM. While the effect is very small in WM, it may be of interest to explore the IVIM effect in GM in neurological disorders that are known to affect the cerebrovascular system including Alzheimer’s disease and cerebrovascular disease associated with stroke$$$^{11}$$$ and hypoperfusion during cardiac surgery.$$$^{12}$$$Acknowledgements
This work was financially supported by R01-NS088040-02 and the NIH MSTP grant. We would also like to thank Jian Dong, Ivan de Kouchnovsky, Elissa Davila-Shiau, Megan McGill, and Jasmine Pathan for their help with data selection and processing.References
1. Le Bihan, D. et al. MR imaging of intravoxel incoherent motions: application to diffusion and perfusion in neurologic disorders. Radiology 161, 401–407 (1986).
2. Kuru, T. H. et al. Intravoxel Incoherent Motion (IVIM) Diffusion Imaging in Prostate Cancer - What Does It Add? Journal of Computer Assisted Tomography 38, (2014).
3. Koh, D.-M., Collins, D. J. & Orton, M. R. Intravoxel Incoherent Motion in Body Diffusion-Weighted MRI: Reality and Challenges. American Journal of Roentgenology 196, 1351–1361 (2011).
4. Guiu, B. et al. Intravoxel Incoherent Motion Diffusion-weighted Imaging in Nonalcoholic Fatty Liver Disease: A 3.0-T MR Study. Radiology 265, 96–103 (2012).
5. Freiman, M. et al. Characterization of fast and slow diffusion from diffusion-weighted MRI of pediatric Crohn’s disease. Journal of Magnetic Resonance Imaging 37, 156–163 (2013).
6. Veraart, J., Fieremans, E. & Novikov, D. S. Diffusion MRI noise mapping using random matrix theory. Magnetic resonance in medicine (2016).
7.Kellner, E., Dhital, B., Kiselev, V. G. & Reisert, M. Gibbs-ringing artifact removal based on local subvoxel-shifts. Magnetic resonance in medicine (2015).
8. Ades-Aron, B. et al. Diffusion parameter EStImation with Gibbs and NoisE Removal (DESIGNER). ISMRM 24th Annual Meeting & Exhibition; Singapore 1040
9. Woolrich, M. W. et al. Bayesian analysis of neuroimaging data in FSL. Neuroimage 45, S173-186 (2009).
10. Nonaka, H. et al. The Microvasculature of the Cerebral White Matter: Arteries of the Subcortical White Matter. J Neuropathol Exp Neurol 62, 154 (2003).
11. Powers, W. J. Cerebral hemodynamics in ischemic cerebrovascular disease. Annals of neurology 29, 231–240 (1991).
12. McKhann, G. M., Grega, M. A., Borowicz, L. M., Baumgartner, W. A. & Selnes, O. A. Stroke and encephalopathy after cardiac surgery an update. Stroke 37, 562–571 (2006).
Figures