3505
Quantitative Noise Analysis for Increased Homogeneity in Intra-voxel Incoherent Motion (IVIM) Perfusion Imaging in Brain1Turku PET Centre, Turku University Central Hospital, Turku, Finland, 2Department of Information Technology, University of Turku, Turku, Finland, 3Department of Radiology, Uniklinik Balgrist, University Zürich, Zürich, Switzerland
Synopsis
Intravoxel incoherent motion (IVIM) perfusion imaging has been shown to be applicable in clinical brain examinations, but those images are known to be noisy. To better quantify the necessary conditions to produce homogenous IVIM perfusion images in the brain, we studied the properties of signal noise as function of b-value and of localization in the brain. We compared the image quality of the perfusion maps as function of number of average to the maximal quality IVIM perfusion maps obtained during a 1 hour acquisition time.
PURPOSE
Intravoxel incoherent motion perfusion imaging has been shown to be applicable in a broad range of brain clinical investigations [1], but those images are known to be noisy. Homogenous images in normal tissue are of particular interest when searching for perfusion deficit, such as in stroke, where IVIM perfusion fraction has been shown to be significantly decreased in the infarct core [2-4]. The purpose of this study was to better quantify the necessary conditions to produce homogenous IVIM perfusion images in the brain. We acquired 20 averages of 16 b values in a single volunteer during a 1 hour scan. We studied the properties of signal noise as function of b-value and of localization in the brain. We then studied the homogeneity of the IVIM perfusion images as function of number of averages, and compared it the image quality to the maximal quality IVIM perfusion maps obtained with the 20 averages.METHODS
IVIM imaging was performed in a single volunteer on a 3-Tesla
clinical system (Trio, Siemens) with parameters: TR/TE 4000/92 ms, FOV 22x22 cm,
matrix size 148x148, for a voxel size of 1.5x1.5x6 mm3. The
diffusion weighting was applied in three orthogonal directions with 16 b-values
0, 10, 20, 40, 80, 110, 140, 170, 200, 300, 40, 500, 600, 700, 800, 900 s/mm2,
from which the trace was calculated. The acquisition was repeated 20 times. Incremental
averages from 1 to 20 were performed to see the effect of added acquisitions to
the IVIM image quality. The IVIM imaging data were post-processed and co-registered
to the first B0 image using FSL [5], and in-house python and C++ code. The DWI
curves were fitted with Broyden–Fletcher–Goldfarb–Shanno
algorithm implemented in the dlib library [6]. The fittings were initialized with slopes and perfusion fraction values calculated analytically
from log-transformed signal. The signal intensities and parameter maps were
analyzed statistically inside voxels and inside brain gray matter (GM) and
white matter (WM). In addition, difference of parameter estimates of f, D*
and D were calculated voxelwise
to see how much the estimates deviate from average image calculated from 20 repeated
acquisitions representing bronze standard in our study.RESULTS
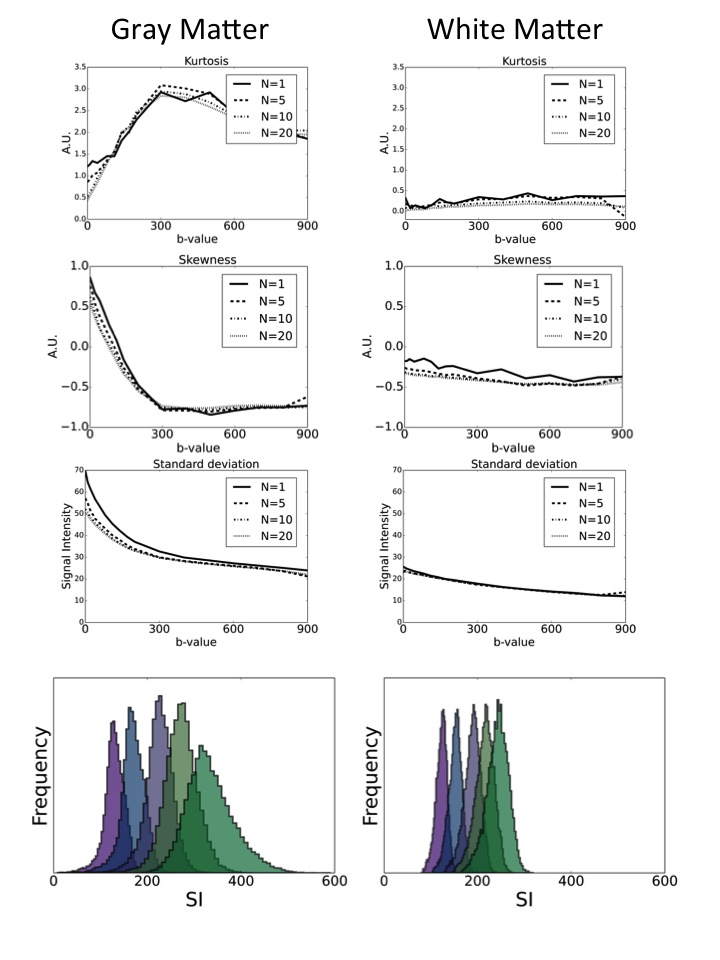
The behavior of the distribution of the signal intensities as function of b-value, showed an overall decrease in standard deviation with increased b-value (Figure 1), Interestingly, the behavior of the shape of the distribution was very different in GM compared to WM, with a much larger dependence of kurtosis and average skewness on b-value in GM compared to WM. In GM, the kurtosis first increased with higher b-values between 0 and 600 s/mm2, to drop again above 600 s/mm2 while also the average skewness dropped sharply between 0 and 600 s/mm2. As expected, the standard deviation dropped as function of number of averages, with the biggest drop observed between 1 average and 5 averages. In proportion to the signal mean value, the Coefficient of Variation (CV) for all b values was below 20% in GM and below 10% in WM, with 1, 5, 10, and 20 repetitions.
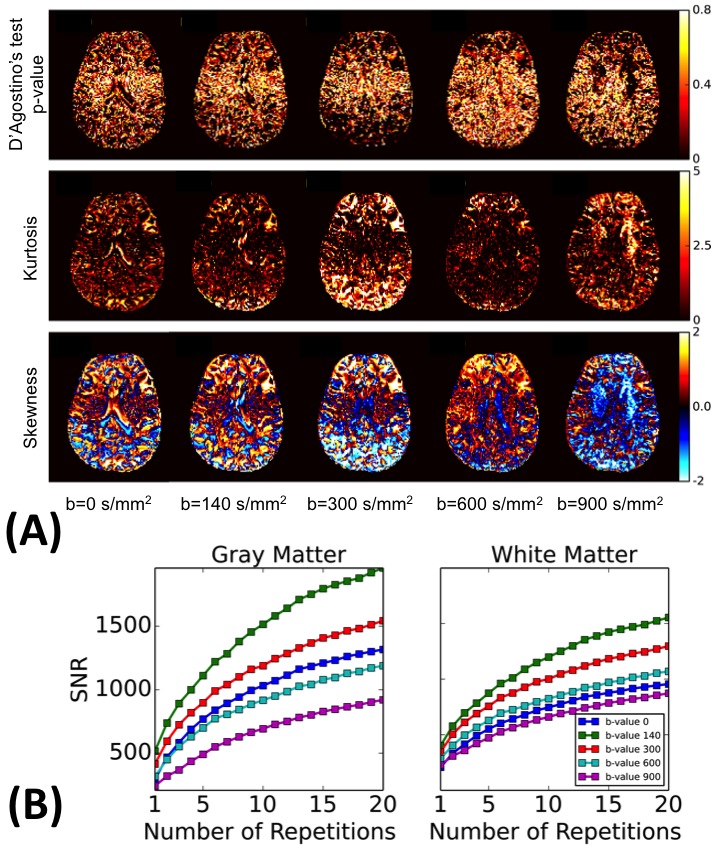
In both white and gray matter, the signal intensity distributions of each voxels was deviating from the Gaussian distribution, with the largest observed at b=900 s/mm2 (D’agostio test for normality, Figure 2 a). The signal-to-noise ratio (SNR) for each b-value increased as function of number of averages, and was the increase was the most significant in the first 5 averages (Figure 2 b). Interestingly, the slope of increase was steeper in GM compared to WM.
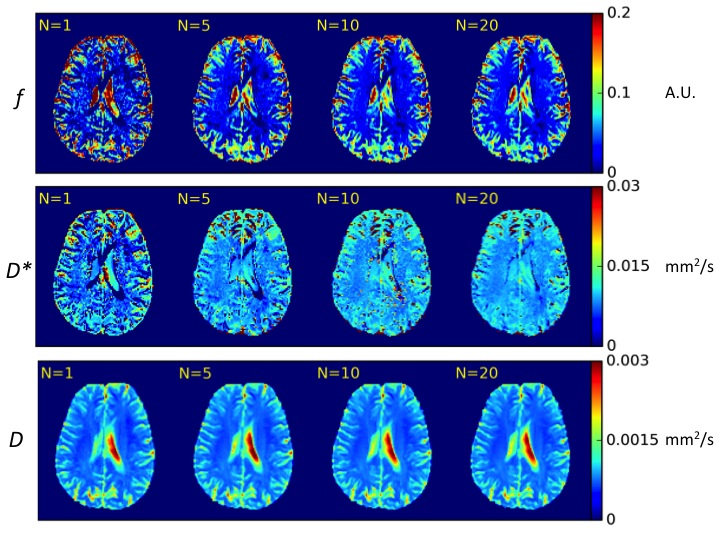
The diffusion coefficient parameteric maps were homogenous with a single acquisition, and did not improve significantly with increased number of averages. The images homogeneity of the parameteric maps of f and D* improved gradually with the number of signal averages, and this improvement was the most significant between average 1 to 5 (Figure 3).
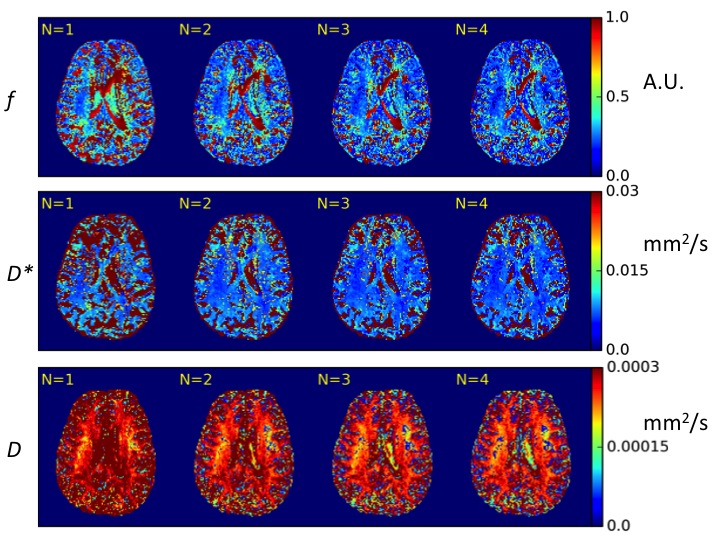
The Figure 4 shows difference to our standard 20 average maps. The most prominent change in maximum difference was found to be achieved with 2-3 averages.
DISCUSSION AND CONCLUSION
The distribution of the DWI signal in
voxels was deviating from Gaussian shape, without a clear spatial pattern. On
the other side, kurtosis and skewness patterns were clearly different between
GM and WM. This might be due to a
different structure and behavior of the microvascular network in GM and WM.
Partial volume of GM with CSF might be a confounding factor as well. We found that averaging diffusion-weighted
images two to five times significantly improve image quality, by improving SNR,
as well as probably averaging over physiological fluctuations, such as cardiac
and CSF pulsations.Acknowledgements
This study was supported by Finnish Cultural Foundation.References
1 Federau C, O'Brien K, Meuli R, Hagmann P, Maeder P (2014) Measuring brain perfusion with intravoxel incoherent motion (IVIM): initial clinical experience. J Magn Reson Imaging 39:624-632
2 Federau C, Sumer S, Becce F et al (2014) Intravoxel incoherent motion perfusion imaging in acute stroke: initial clinical experience. Neuroradiology 56:629-635
3 Suo S, Cao M, Zhu W et al (2016) Stroke assessment with intravoxel incoherent motion diffusion-weighted MRI. NMR Biomed 29:320-328
4 Yao Y, Zhang S, Tang X et al (2016) Intravoxel incoherent motion diffusion-weighted imaging in stroke patients: initial clinical experience. Clin Radiol 71:938 e911-936
5 Smith SM, Jenkinson M, Woolrich MW et al (2004) Advances in functional and structural MR image analysis and implementation as FSL. NeuroImage 23:S208-219
6 King DE (2009), Dlib-ml: A machine learning toolkit, J Mach Learn Res 10: 1755-1758
Figures