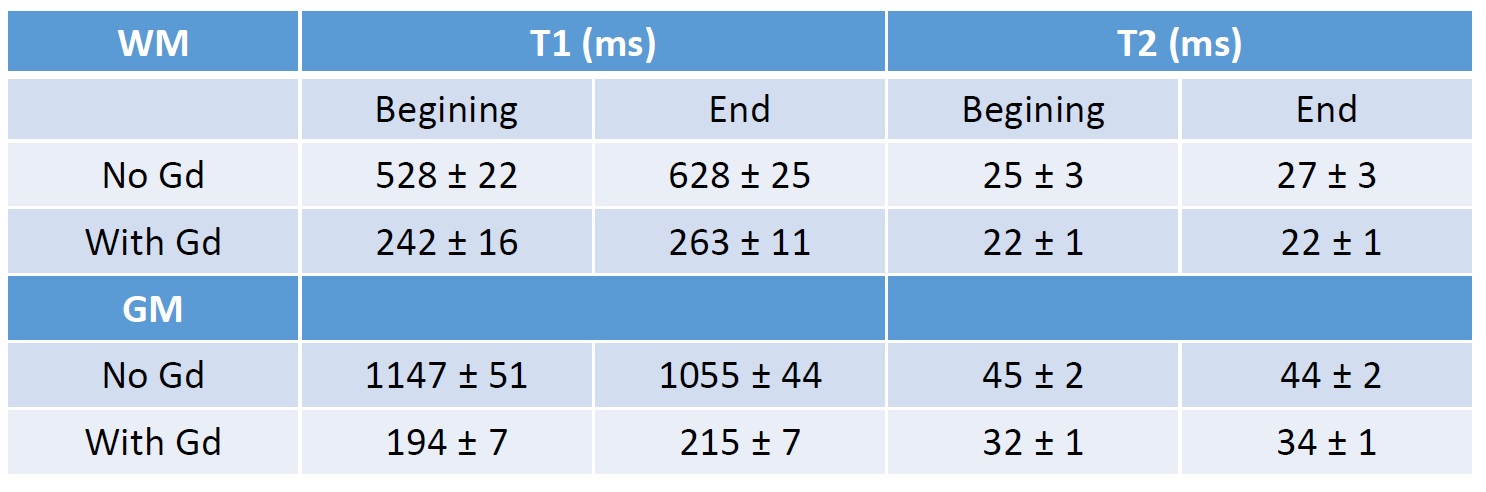
3500
On the use of Gadolinium-staining for high resolution ex vivo NODDI measurements at 11.7T1Center of NeuroImaging Research - CENIR, Paris, France, 2Inserm U 1127, CNRS UMR 7225, Sorbonne Universités, UPMC Univ Paris 06 UMR S 1127, Institut du Cerveau et de la Moelle épinière, ICM, Paris, France, 3AP-HP, Hôpital de la Pitié-Salpêtrière, Department of Neurosurgery, Paris, France, 4AP-HP, Hôpital de la Pitié-Salpêtrière, Department of Neurology, Paris, France
Synopsis
The goal of this work was to compare diffusion and microstructure parameters estimation when the sample is soaked or not in gadolinium before imaging (Gd-staining). We found that Gd-staining is suitable for diffusion imaging experiment, leading to higher SNR and higher useful b-values. Meanwhile, care must be taken for several microstructure parameters estimation as T1 may vary during experiment.
Purpose
Performing ex vivo tractography or microstructure parameters measurement can be very challenging. This may be due to the changes of T1 or T2 values of samples, or different fixative methods used that can drastically change the water apparent diffusion coefficient (ADC)1,2. Using gadolinium to perform ex vivo studies is conventionally used for ex vivo high resolution anatomical imaging (Gd-staining). For diffusion measurement, there is not a clear consensus about the use of gadolinium-based contrast agents. In this study we intend to compare results of ex vivo diffusion weighted imaging and neurite orientation dispersion (NODDI) measurements obtained at ultra high field (11.7T) on an ex vivo macaque brain.Materials and Methods
This study was performed at 11.7T on a Bruker Biopsec (Bruker Biospin, Germany) running Paravision 6.0.1, using a quadrature 72mm transceiver. A vial containing a macaque brain within Fluorinert (3M, Germany) was manually placed at the center of the transceiver, within the magnet. After imaging, the brain was taken out and placed in a 1:200 dilution of Gadolinium (Dotarem, Guerbet, France) in Phosphate Buffer Saline (PBS). The brain was then replaced in the same vial and fluorinert solution for imaging. The two imaging sessions (without and after gadolinium-staining) consisted in evaluating T1 and T2 values at the beginning and at the end of the diffusion experiments in both gray and white matter. For each session, whole-brain diffusion-weighted images were acquired using a 3D segmented EPI sequence by using 32 segments. Sequence parameters were: FOV: 7.68*5.76*5.12 cm3; Mtx: 384*288*256 leading to an isotropic resolution of 200 μm; TR/TE=250/26 ms; δ=6.5 ms and Δ=12.3 ms. Three different shells were acquired with b-values of 10000, 4000 and 500 mm²/s with respectively 64, 32 and 8 non-collinear directions. 8 A0 images (without diffusion gradient) were also acquired with the same parameters as reference. Total scan time for measurements was 64 hours.
We fitted NODDI using the AMICO Matlab toolbox4 : the intra-cellular volume fraction (ICVF) referring to the space bounded by the membranes of neurites, their orientation dispersion (OD), and the isotropic volume fraction.
Results
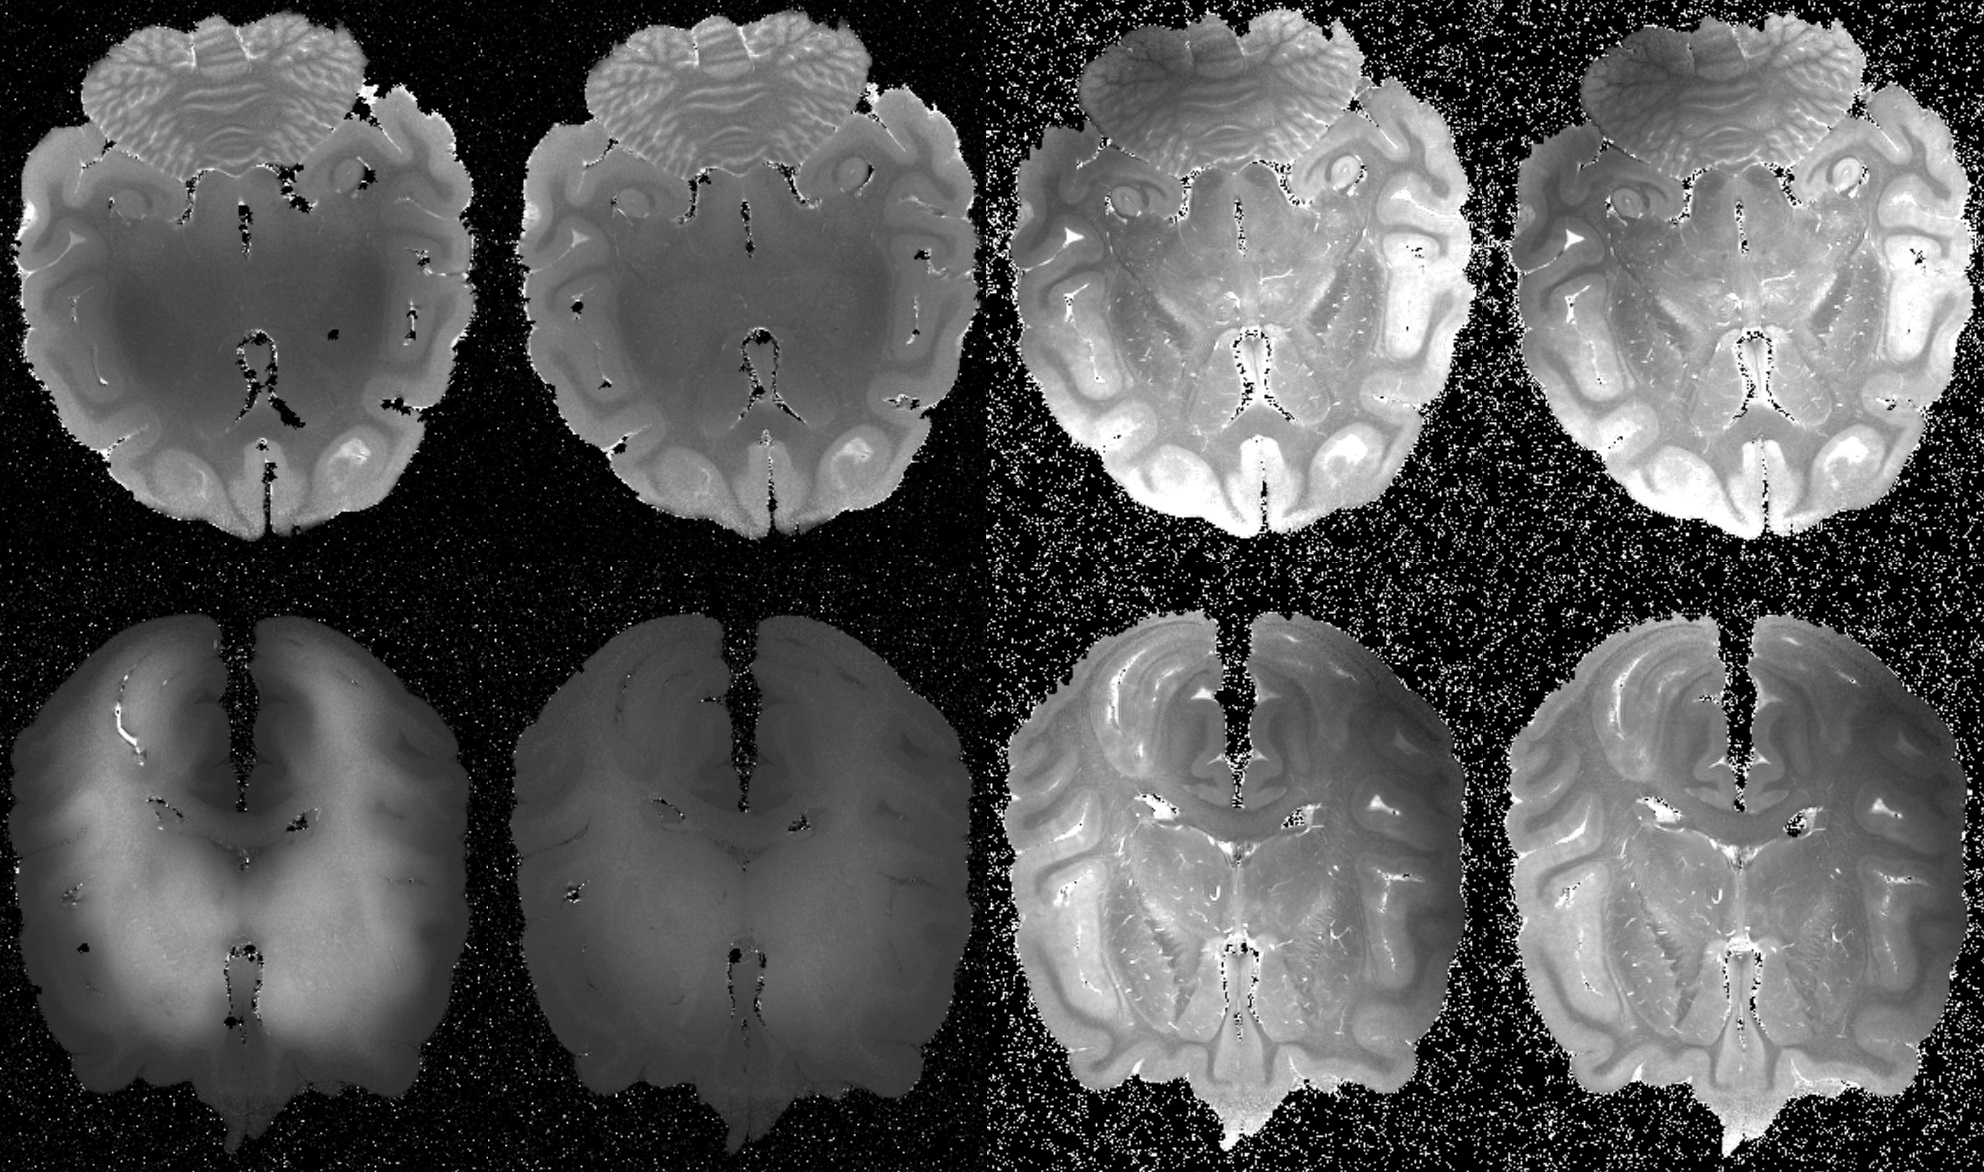
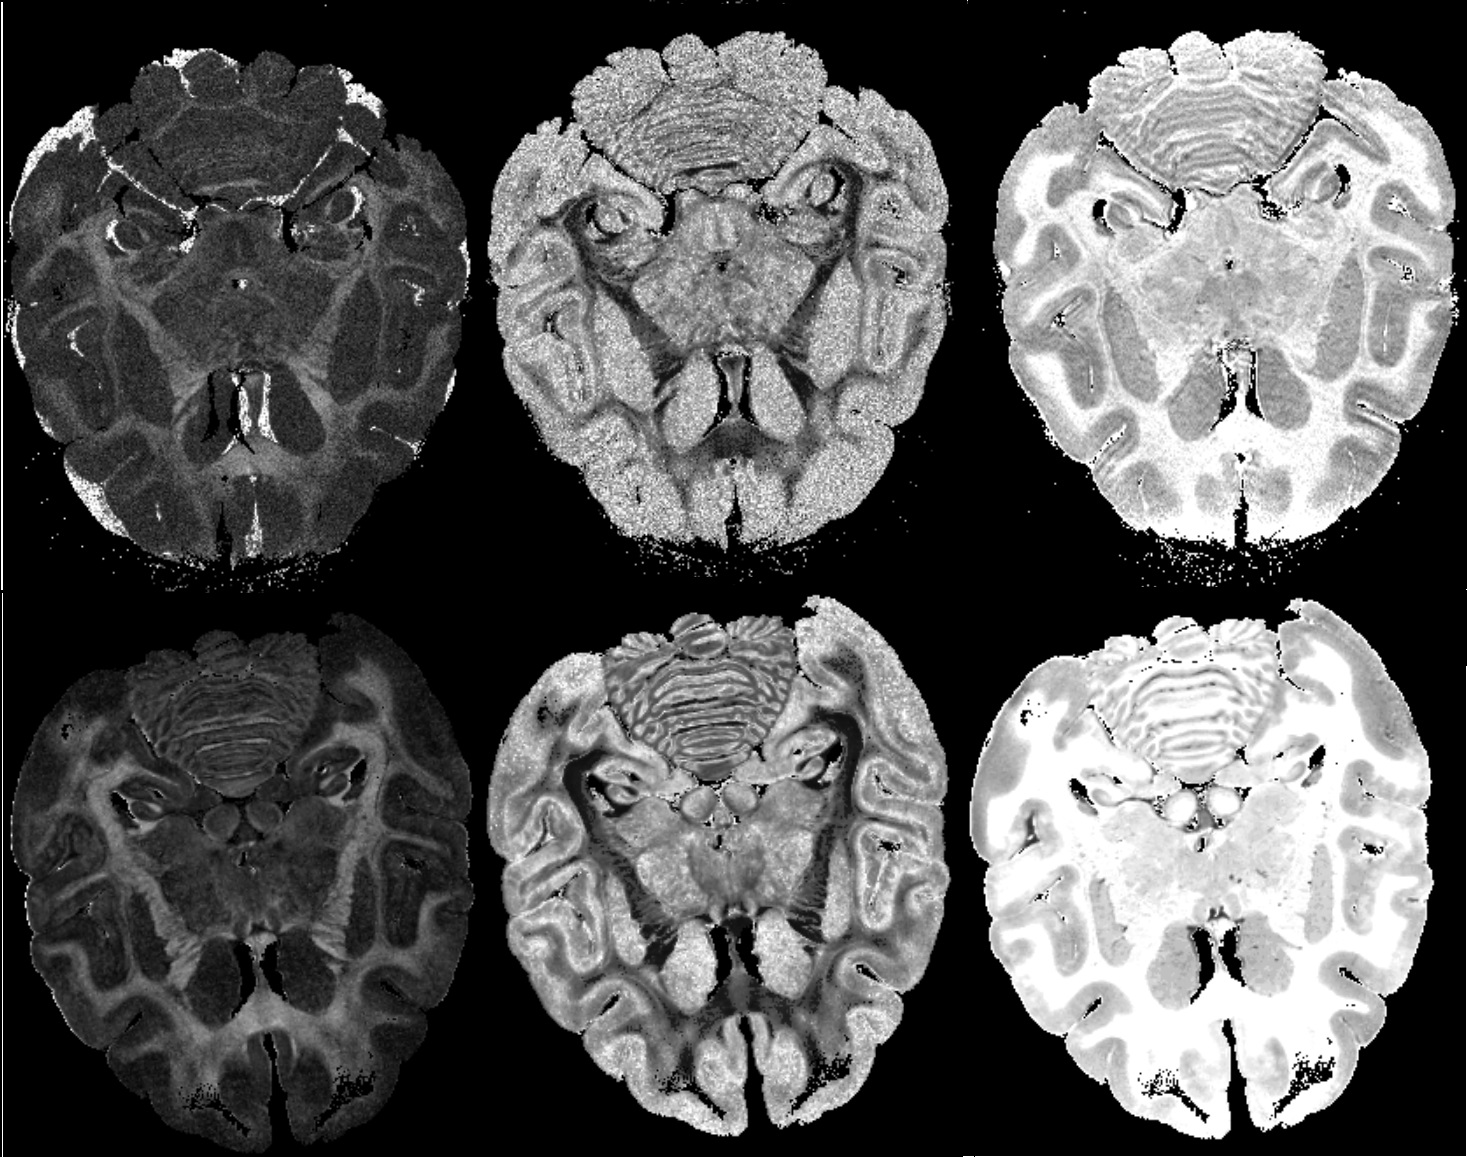
The evaluation of T1 and T2 in GW and WM with and without Gd-staining are summarized in Table 1 and shown on Figure 1. As expected, there is a huge decrease of both WM and GM T1 after Gd-staining. As shown in our previous study5, GM T1 became shorter than WM T1 after Gd-staining, while WM T2 remained shorter than GM T2. Without Gd-staining we did not observe significant change in GW or WM T1 and T2 during experiment. Figure 2 shows the FA obtained for the highest shell (b=10 000 mm²/s) orientation dispersion (OD) and intra-cellular volume fraction (ICVF) without and with Gd-staining. As expected, a higher SNR was found in both FA and OD maps. Interestingly, the ICVF of WM appeared more homogeneous when Gd-staining was used.Conclusion
We showed that using Gd-staining allowed higher SNR for high b-values. Gd-staining also allowed to obtain higher SNR for OD estimation. Meanwhile, we detected a slight modification in T1 during experiment with Gd-staining in different WM structures. This may limit the impact of this approach for microstructure estimation like estimating g-ratio because a robust and precise T1 measurement is needed. Indeed T1 may vary during experiment. Future work will be focused on a comparison of tractography results obtained with and without Gd-staining.Acknowledgements
The research leading to these results received funding from the programs 'Institut des neurosciences translationnelle' ANR-10-IAIHU-06 and 'Infrastructure d’avenir en Biologie Santé' ANR-11-INBS-0006.
SBS has been supported by the Bettencourt Schueller Foundation and by the National Agency for Research under the program "Investissements d’avenir" ANR-10-EQPX-15.
References
1. Shepherd TM, Flint JJ, Thelwall PE, Stanisz GJ, Mareci TH, Yachnis AT, Blackband SJ. Postmortem interval alters the water relaxation and diffusion properties of rat nervous tissue — Implications for MRI studies of human autopsy samples. Neuroimage. 2009; 44(3):820-26.
2. Dawe RJ, Bennett DA, Schneider JA, Vasireddi SK, Arfanakis K. Postmortem MRI of human brain hemispheres: T2 relaxation times during formaldehyde fixation. Magn Reson Med. 2009; 61(4):810-8.
3. Zhang H, Schneider T, Wheeler-Kingshott CA, Alexander D. NODDI: Practical in vivo neurite orientation dispersion and density imaging of the human brain. Neuroimage. 2012; 61(4):1000-16.
4. Daducci A, Canales-Rodriguez E, Zhang H, Dyrby T, Alexander D, Thiran JP. Accelerated Microstructure Imaging via Convex Optimization (AMICO) from diffusion MRI data. NeuroImage 105, pp. 32-44 (2015).
5. Santin MD, Samoyeau T, Valabrègue R, Laffrat E, François C, Hunot S. Identification of the nigrostriatal and pallidothalamic fiber tracts by high-resolutionprobabilistic diffusion tractography in Squirel monkey. ISMRM 2016-3973
Figures