3499
Motion-tolerance Single-scan Diffusion Mapping1Department of Electronic Science, Department of Electronic Science, Xiamen University, Xiamen, People's Republic of China, 2Department of Communication Engineering, Department of Communication Engineering, Xiamen University, Xiamen, People's Republic of China, 3High Magnetic Field Laboratory, High Magnetic Field Laboratory, CAS, Hefei, People's Republic of China
Synopsis
A new diffusion imaging method, single-scan diffusion mapping through overlapping-echo detachment planar (DM-OLED) imaging sequence with corresponding separation algorithm, was proposed. The method can get reliable diffusion mapping by a single-scan in about 120ms.The diffusion mapping gained by DM-OLED has immunity to motion and higher time resolution compared with conventional multi-scan diffusion methods. Experimental results of mouse brains verified the accuracy and the motion-tolerance of DM-OLED. As a reliable fast diffusion measurement tool, DM-OLED can be boded well for further uses in clinical real-time measurements.
Purpose
Nowadays, diffusion mapping has become an important aided tool for functional magnetic resonance imaging (fMRI), which can provide more accurate measures of neuronal activities.1,2 However, the requirement for multi-scan with various diffusion-weighting in diffusion mapping makes the diffusion mapping vulnerable to the effects of motion and restricted in detecting the quick variation of diffusion coefficient under different physiological status.3,4 In present work, we proposed a new imaging method, single-scan diffusion mapping through overlapping-echo detachment planar (DM-OLED) imaging sequence together with a separation algorithm, to get reliable diffusion mapping in a single-scan. The diffusion mapping gained by DM-OLED is more motion-immune and have higher timeresolution compared with conventional diffusion methods.Method
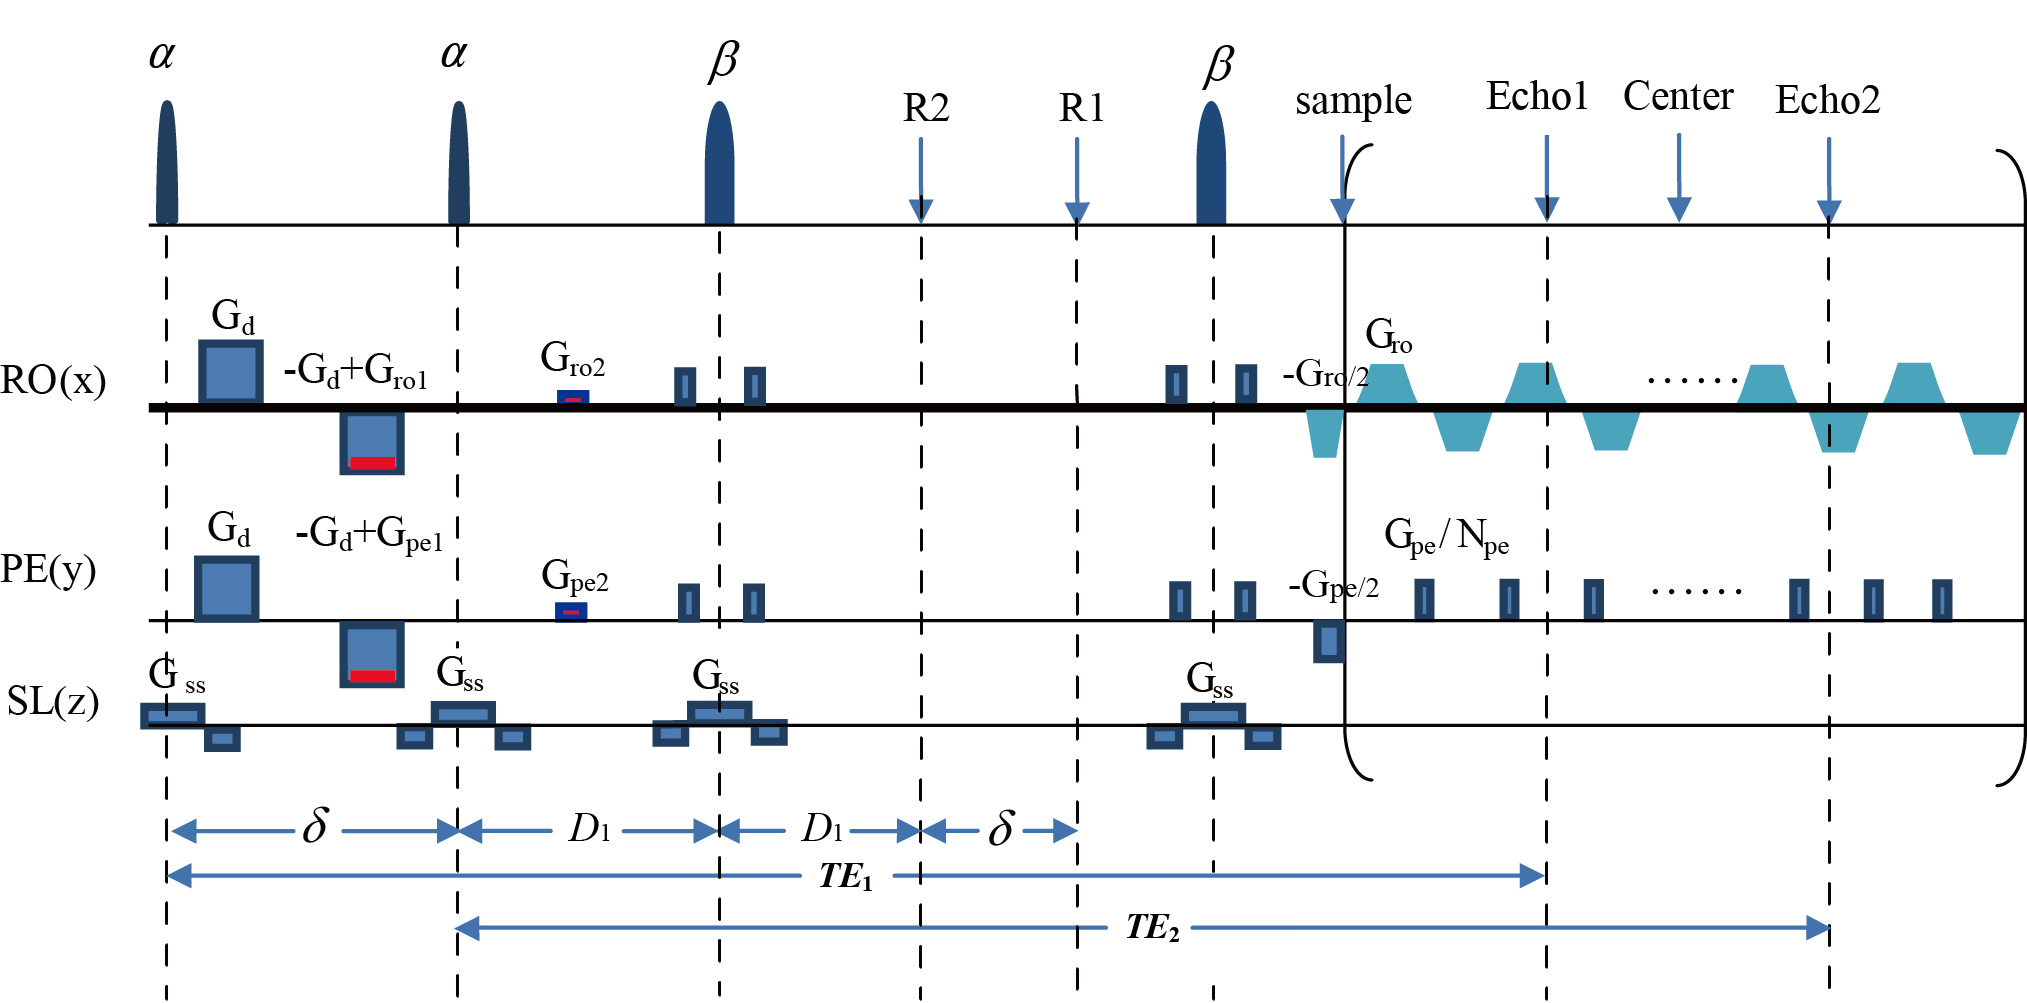
The DM-OLED sequence is shown in Fig.1. $$$\alpha$$$ and $$$\beta$$$ are flip angles of the excitation pulses and the refocusing pulses respectively. The excitation pulses induce the first echo (Echo1) and the second echo (Echo2) respectively. $$$ G_{ro1}$$$, $$$ G_{ro2}$$$, $$$ G_{pe1}$$$and $$$ G_{pe2}$$$ are echo-shifting gradients making the two echo signals have same T2-weighting and different linear phases. Only the first echo signal is diffusion weighted by the diffusion gradients $$$ G_{d}$$$, $$$\delta_{d}$$$ and $$$\triangle$$$ are duration and interval of $$$ G_{d}$$$. The signal formula after the refocusing pulses can be expressed as:
$$\bf \begin{cases}S_{1}=\int_{}^{}\rho\left(\vec{r}\right)\frac{1}{8}\sin\alpha\left(1+\cos\alpha\right)|-\cos^{2}\beta+2\cos\beta-1|e^{-b\cdot D\left(\vec{r}\right)}d\vec{r} &, first-echo \\S_{2}=\int_{}^{}\rho\left(\vec{r}\right)\frac{1}{4}\sin\alpha\cos\alpha|-\cos^{2}\beta+2\cos\beta-1| & ,second -echo\end{cases}(1) $$
Where $$$b=\gamma^{2} G_{d}^{2} \delta_{d}^{2}\left(\triangle-\delta_{d}/3\right) $$$is the diffusion factor, and $$$\bf D$$$ is the apparent diffusion coefficient(ADC). After sampling, the following formulation is used to separate the signals:
$$\bf \left\{x_{1},x_{2}\right\}=argmin\left[\parallel x_{0}-x_{1}-x_{2}\parallel_{2}^{2}+\lambda_{1}\parallel\triangledown x_{1}\parallel_{1}+\lambda_{2}\parallel\triangledown x_{2}\parallel_{1}+\lambda_{3}\parallel\triangledown\left( x_{1}- \beta x_{2}\right)\parallel_{1}\right] (2)$$
where $$$\bf \beta=|x_{10}|/|x_{20}|$$$, $$$\bf x_{10}$$$, $$$\bf x_{20}$$$, $$$\bf x_{1}$$$ and $$$\bf x_{2}$$$ are the original and separated images from the two echo signals respectively. $$$\bf x_{0}$$$ can be obtained from inverse Fourier transform of the original k-space signals. Finally, the ADC map can be calculated directly by the formula below:
$$\bf D\left(\overrightarrow{r}\right)=-In\left(\frac{\mu x_{1}\left(\overrightarrow{r}\right)}{x_{2}\left(\overrightarrow{r}\right)}\right)/b (3)$$
Where $$$\mu=\left(\frac{2\cos\alpha}{1+\cos\alpha}\right)$$$is the correction factor according to eq.(1).
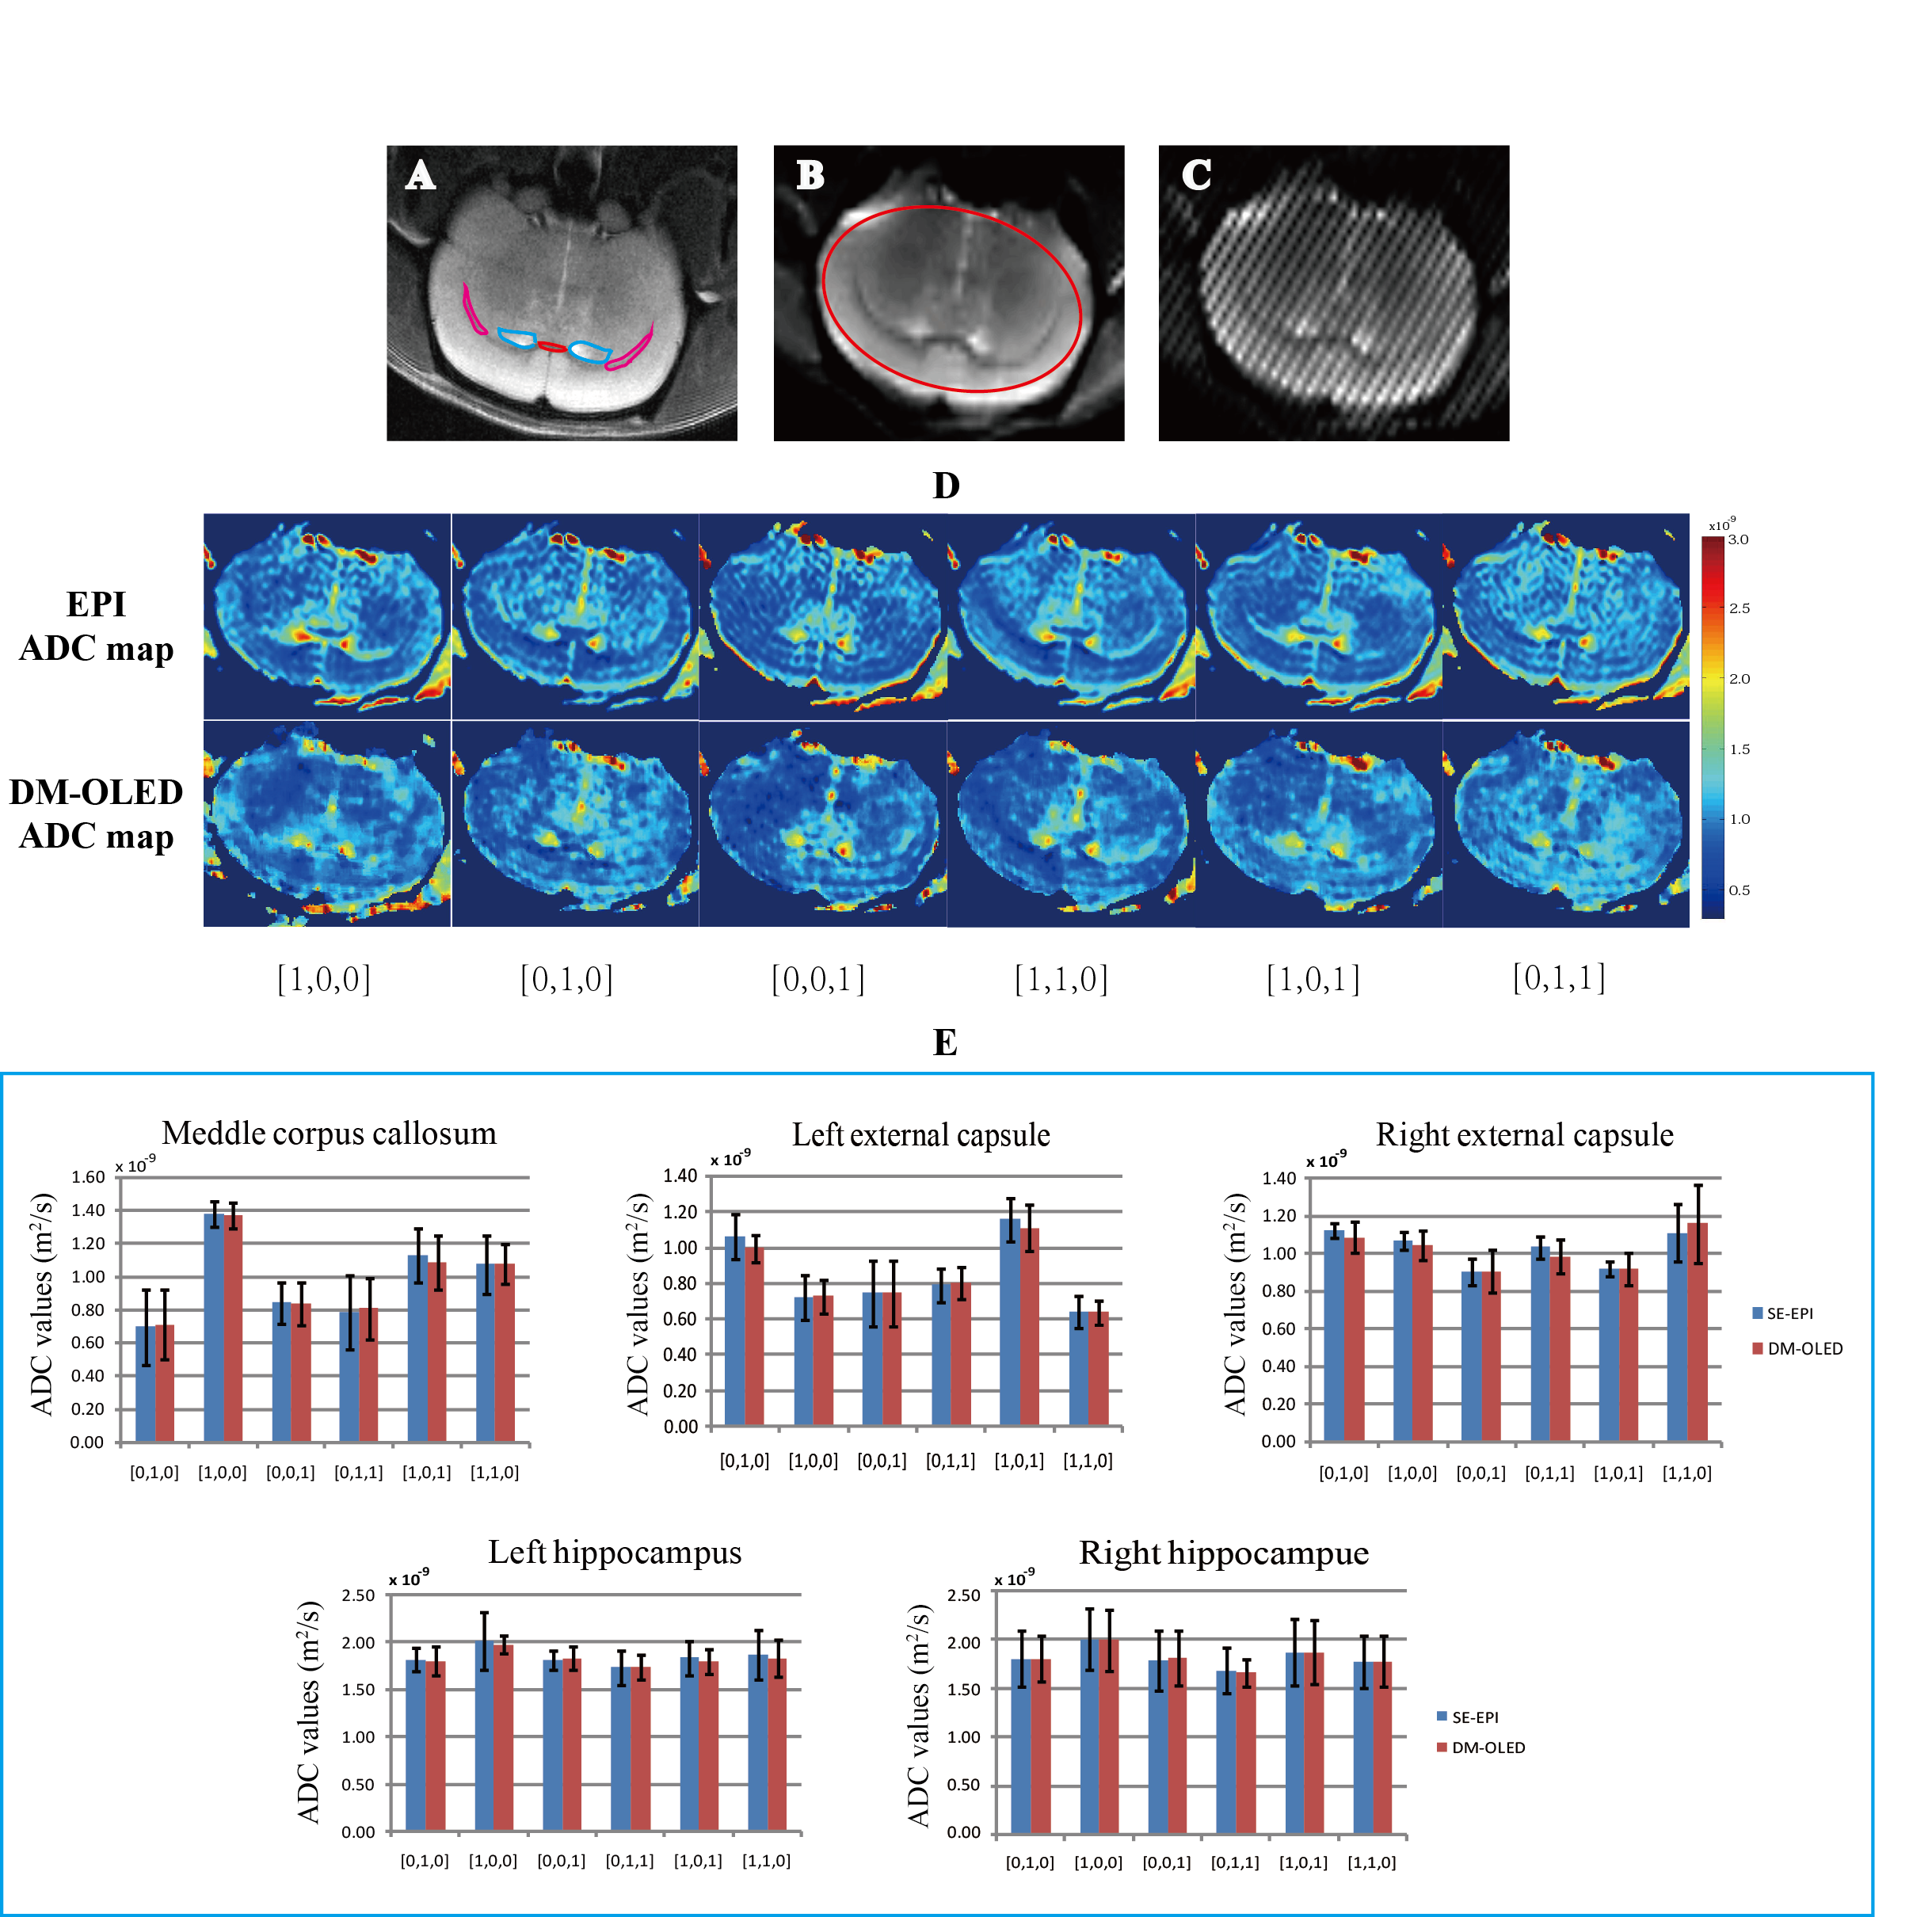
In-vivo experiments were conducted on a 9.4 T Varian MRI system with a 4-channels surface coil. Five healthy Wistar rats were used for brain scanning by DM-OLED and spin-echo echo-planar imaging (SE-EPI) sequences. $$$\alpha$$$=45° was selected for the tests. The duration of a DM-OLED acquisition was about 120ms.The diffusion directions were [1,0,0], [0,1,0], [0,0,1], [1,1,0], [0,1,1] and [1,0,1] when the rats were completely anaesthetized, and the diffusion direction was [1,1,1] when the rats were recovered from deep sleep. Before ADC analysis, linear registration was done to the SE-EPI data.
Result
Fig. 2 illustrates the results of a mouse brain with completely anesthetized. The ADC maps and the segmentation results of DM-OLED were very close to those of SE-EPI, and the fiber orientations reflected by the ADC values reflected the physiological structure reported previously.5 However, bigger deviation appeared in corpus callosum (about 6.17%).The shortest T2 and the relatively small diffusion attenuation for the first echo of DM-OLED in corpus callosum may be the main reasons for the less reliable ADC values.
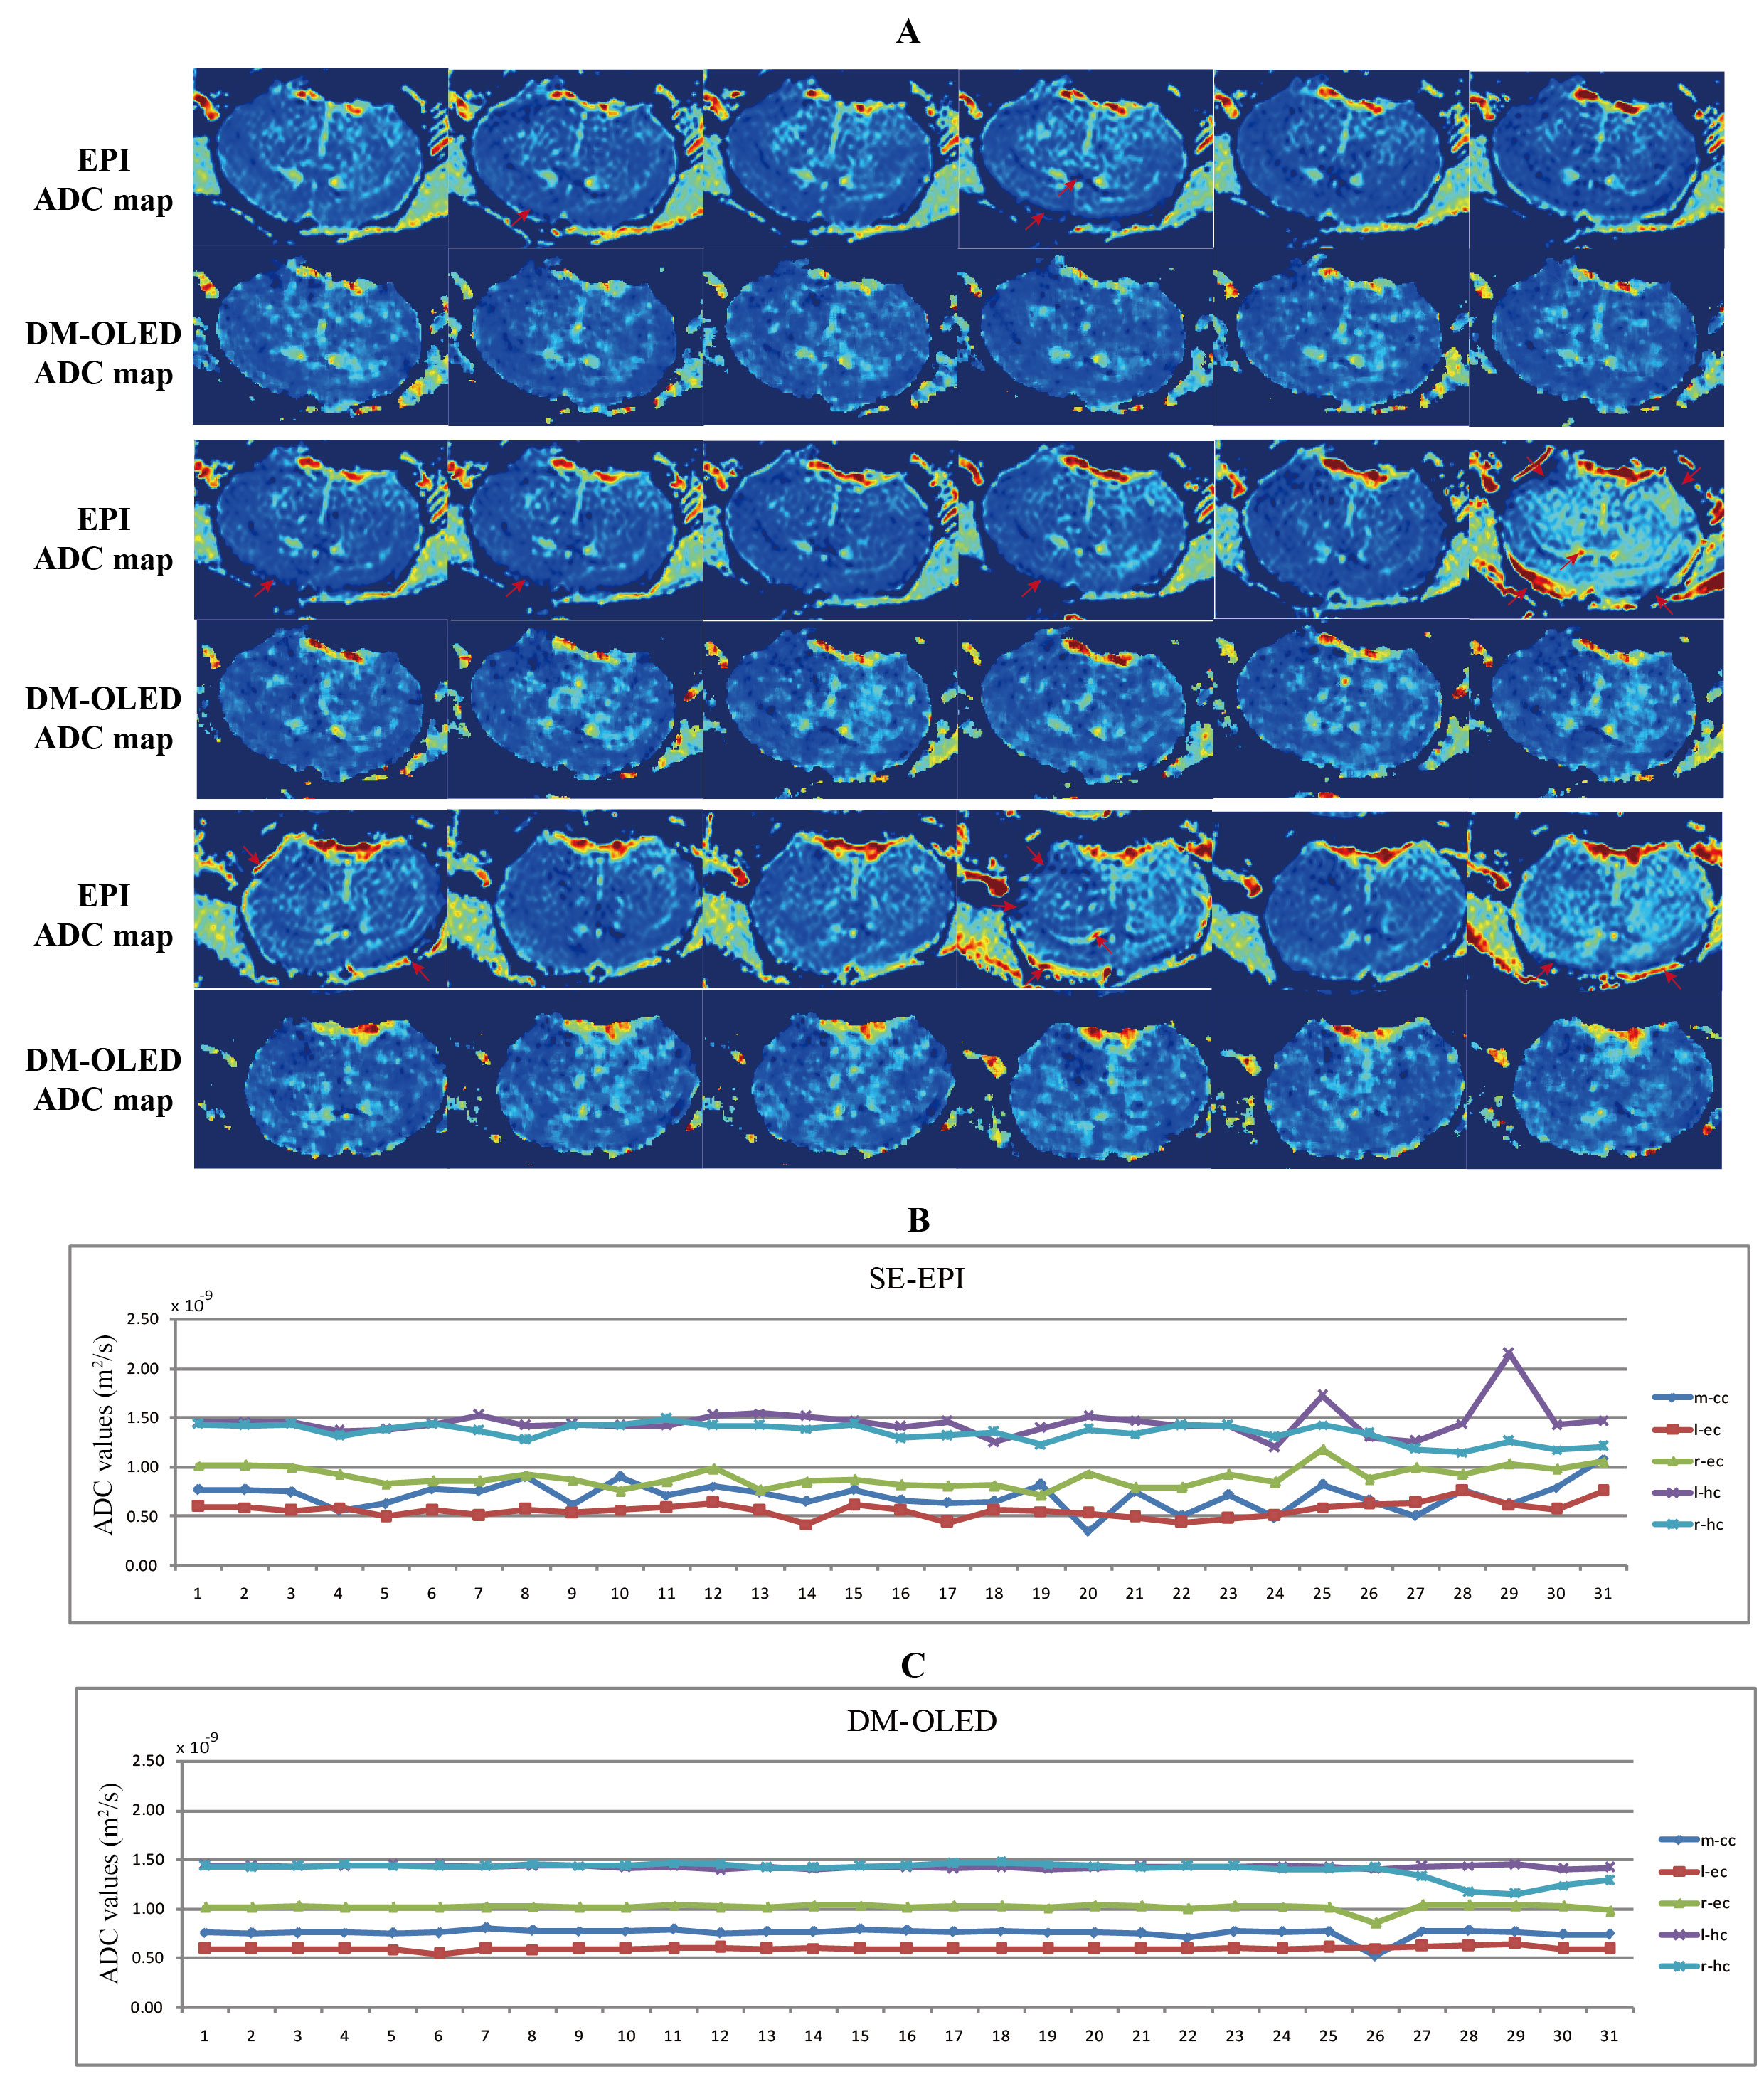
Fig.3 illustrates the results of a mouse brain without anesthesia. Unreasonable values, extreme or negative values were marked by red arrows, which did not appear in the DM-OLED ADC maps, but were quite obvious in the SE-EPI maps because of mis-registration under effects of motion. The segmentation statistics of DM-OLED were highly consistent with SE-EPI in the first three time points while the mouse was still asleep, but were more steady than SE-EPI in the last time course while the mouse began to wake up. The segmentation statistics of the other four rats showed similar tendency as Fig.3B and 3C. The results indicate that DM-OLED is more robust than SE-EPI under motion environment.
Discussion
DM-OLED shows excellent performance in the mouse brain diffusion experiments. Compared with SE-EPI, DM-OLED can generate higher time resolution and produce less motion-incurred errors in the ADC maps because of the short lag time between corresponding diffusion-weighted images. According to Eq.(1), inaccurate flip angle of the refocusing pulses would not affect reconstruction of the ADC values, but non-ideal flip angle of the excitation pulses would make effects. To reduce the effect of non-ideal excitation pulses, the refocusing slice thickness should be smaller than excitation slice thickness. Some areas in DM-OLED ADC maps seem a little smoother than SE-EPI ADC maps, which may be because of the piecewise smooth property of ℓ1-norm regularization with TV constraints in Eq.(2).
Conclusion
As a reliable motion-immune diffusion method, DM-OLED can be boded well for further uses in clinical real-time measurements and fMRI requiring for high temporal resolution.Acknowledgements
We are grateful to the High Magnetic Field Laboratory, CAS for providing 9.4T MRI facility. This work was supported by the NNSF of China under Grants U1632274and 81171331, and Science and Technology Project of Fujian Province, China under Grant 2016Y0078.References
1. A.W.Song, T.K. Truong. Apparent diffusion coefficient dependent fMRI: Spatiotemporal characteristics and implications on calibrated fMRI. International Journal of Imaging Systems and Technology, 2010. 20(1): 42-50.
2. A.W. Song, H. Fichtenholtz, M. Woldorff. BOLD signal compartmentalization based on the apparent diffusion coefficient. Magnetic Resonance Imaging, 2002; 20(7): 521-525.
3. X. Shi, E.G. Kholmovski, S. Kim, et al. Improvement of accuracy of diffusion MRI using real-time self-gated data acquisition. NMR Biomed, 2009; 22(5): 545-50.
4. D.L. Bihan, C. Poupon, A. Amadon, et al. Artifacts and pitfalls in diffusion MRI. Journal of Magnetic Resonance Imaging, 2006; 24(3): 478-88.
5. D.Wu, J. Xu, M.T. McMahon, et al. In vivo high-resolution diffusion tensor imaging of the mouse brain. NeuroImage, 2013; 83: 18-26.
Figures