3496
Comparison of rotenone-induced rat model and 6-OHDA-induced rat model of Parkinson's disease: FA and T2* values analysisLanXiang Liu1, Dan Du1, Tao Zheng2, Yuan Fang1, Yansheng Chen1, Huiling Yi1, Qingyuan He3, Dawei Gao4, and Qinglei Shi5
1Qinhuangdao Municipal No. 1 Hospital, Hebei, People's Republic of China, 2Hebei Medical University, Shijia Zhuang, Hebei, People's Republic of China, 3Peking University Third Hospital, 4Yanshan Universiry, 5Siemens Ltd
Synopsis
The fractional anisotropy (FA) and T2* values of rotenone (RT) and 6-OHDA-induced rat model of PD at different time points were quantitatively analyzed. A larger degree of quantitative parameters variation in 6-OHDA-induced rat group than RT-induced rat group were demonstrated when using quantitative parameters of FA and T2* values. The phenomena observed in this study may be of help in future studies about PD using rat model.
Purpose
In order to lay a foundation in the study of Parkinson’s disease (PD) using rat model, we quantitatively analyzed the fractional anisotropy (FA) and T2* values of rotenone (RT) and 6-OHDA-induced rat model of PD at different time points.Materials and method
Thirty healthy male Sprague-Dawley rats (average age: 2 months) weighing 200-280g were randomly divided into RT group (12 rats), 6-OHDA group (12 rats) and control group (6 rats) using random number table method. These three groups were administered 2µl rotenone dissolved in dimethylsulfoxide (DMSO), 2µl 6-OHDA and the same dose of saline by intracranial injection in the right sides of substantia nigra (SN). The observation of ethological characteristics and the MR scans were performed in 1st, 2nd, 4th, and 6th week after the injection. All data were collected on a MAGNETOM Verio 3T MR scanner (Siemens, Erlangen, Germany). The scanning protocols included T2-weighted sequence, diffusion tensor imaging (DTI) and fast low angle shot (FLASH) sequences. In order to improve the accuracy of the measurements, the positioning of these sequences was aligned. The FA and T2* values of the both sides of SN were measured on FA map and T2* map with the T2 image as a reference. The differences in FA and T2* parameters among the three groups were analyzed using repeated measures ANOVA, and the difference among these groups at the same time points were compared using multivariate method. A P value below 0.05 indicated statistical significance. The pathological changes of PD rat model were confirmed by using immunohistochemistry.Results
Immunohistochemistry analysis revealed the damaged neurons, some nucleus pycnosis, the reduction of TH positive cells and the lighter cytoplasm staining in RT and 6-OHDA-induced rat model groups (Fig1), which indicate the success of model establishment1. In RT group, the FA values of 6th week sub-group in right SN was significantly lower than in any other week sub-groups ([0.220±0.020]con. vs [0.178±0.029]exp. ,PRT-PD, 6st week=0.007) ( Fig2,Table1). No significant difference was observed in the interaction of time and difference between control and experimental groups for T2* values of SN (Fig3, Table2). In the 6-OHDA group, the FA values in right side of SN were significantly lower in the 1st week ([0.262±0.056]con. vs [0.177±0.019]exp. ,P6-OHDA-PD, 1st week=0.016) and higher in the 6th week ([0.248±0.014]con. vs [0.345±0.121]exp. ,P6-OHDA-PD, 6st week =0.011) sub-group than any other week sub-groups(Fig2,Table1). The T2* values of the 6-OHDA-induced group were significant higher in 6th week sub-group than any other week sub-group (Fig3, Table2). Among different time points, the FA values in the right SN of the RT-induced group descend, while in 6-OHDA-induced group ascend.Conclusions
The 6-OHDA induced rat group demonstrated a larger degree of variation than the RT-induced rat group when using quantitative parameters of FA and T2* values. The difference between the RT and 6-OHDA induced rat group about the variation of FA and T2* values should be considered in studying PD using rat model.Acknowledgements
No acknowledgement found.References
1.Shiman R, Akino M. So lubilization and Partial Purification of Tyrosine Hydroxy lase From Bov ine Adrenal Medulla[ J] .Biol Chem, 1971, 246( 5) : 1330- 1334.Figures
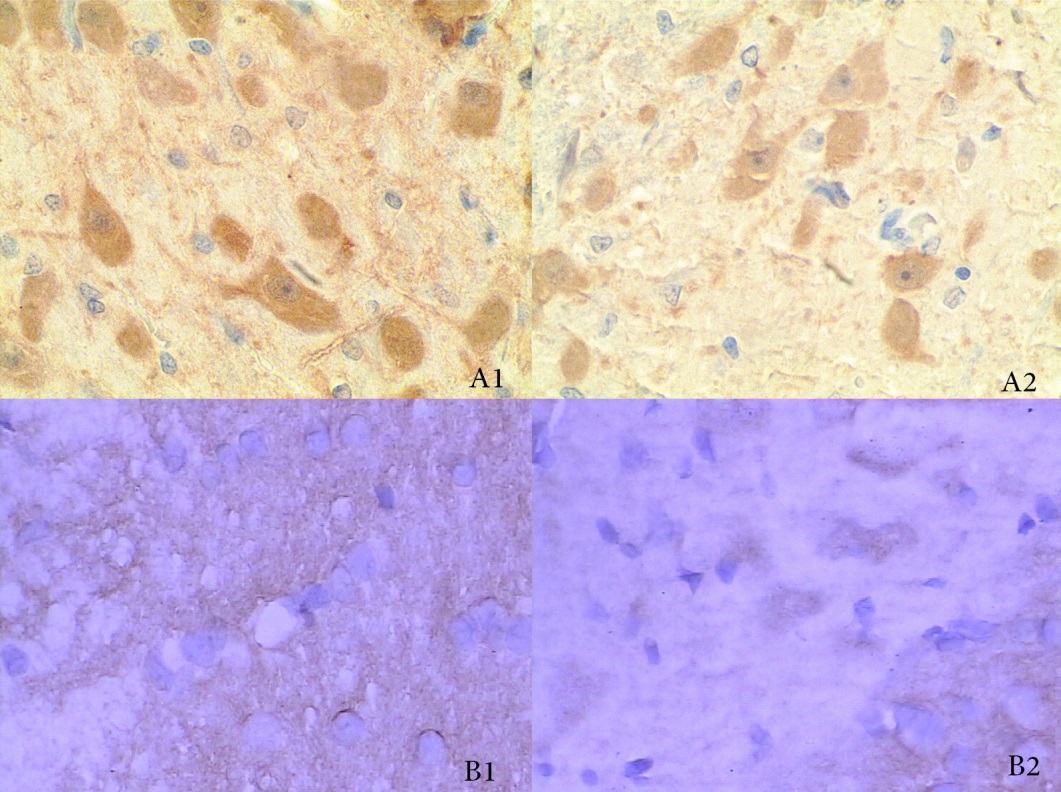
Figure1. Immunohistochemistry (Representative
images of TH positive cells from RT (A1, B1) and 6-OHDA-induced animal models
(A2,B2)
in SN (magnification times: 40×10). Note the damaged morphology part of neuron,
the reduction of TH positive cells)

Figure2. Variation trends of FA values
in right and left sides of SN in RT and 6-OHDA-induced animal groups.
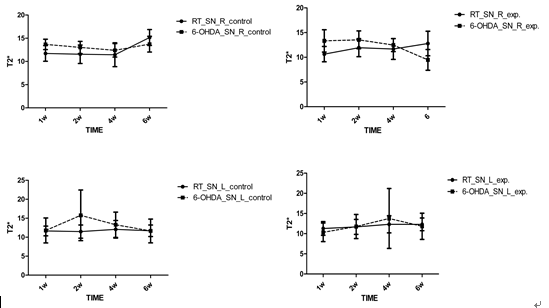
Figure3. Variation trends of T2* values in right and left
sides of SN in RT and
6-OHDA-induced animal groups.
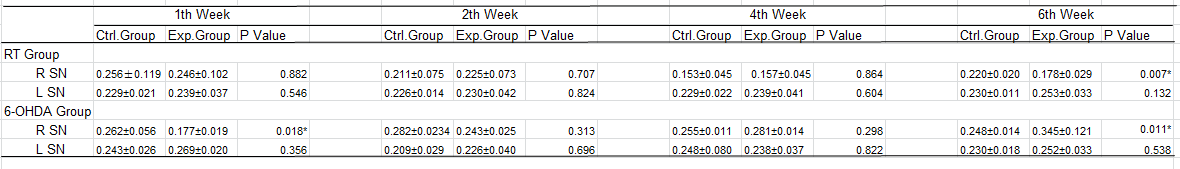
Table1. Comparison of Mean FA values between RT group and 6-OHDA group at the
same time points
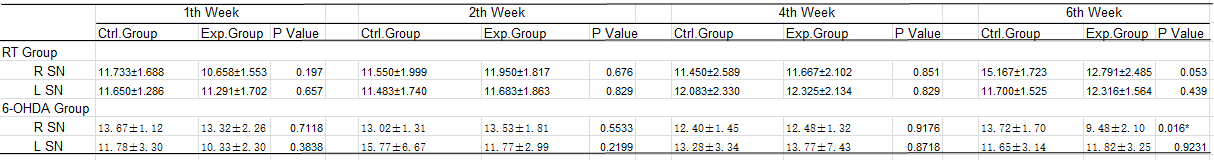
Table2. Comparison
of Mean T2* values between RT group and 6-OHDA group at the same time points