3495
Inferior Fronto-occipital Fasciculus Tractography —— a Comparison of Reconstruction Methods1Center for Brain Imaging Science and Technology, Department of Biomedical Engineering, Zhejiang University, Hangzhou, People's Republic of China
Synopsis
The anatomical definition and functional role of inferior fronto-occipital fascicle (IFOF) in human brain are important but still controversial. Post-mortem dissection has provided detailed and extended cortical terminations of IFOF while diffusion tractography further facilitates the definition of extended terminations through in vivo studies. A careful comparison of fiber reconstruction methods including diffusion tensor imaging, q-ball imaging, generalized q-sampling imaging and diffusion kurtosis imaging (DKI) was conducted. More integrated IFOF tracts were found with DKI, which could benefit the exploration of precise terminations of IFOF, thus a better understanding of its function.
Introduction
The anatomical and functional roles of the inferior fronto-occipital fascicle (IFOF) are still under debate with a historical description connecting the ventral occipital cortex with the inferior frontal and fronto-orbital cortices through the external/extreme capsule and a possible role of semantic processing in language networks 1. Current post-mortem anatomical dissection technique has revealed more detailed and extended cortical terminations of IFOF, while inconsistencies are observed that might be attribute to inter-individual variability 1 or limitation of the technique which depends on the quality of study specimens 2. In vivo diffusion tractography in large samples have facilitated the determination of extended termination territories in superior parietal, middle and superior frontal gyrus consistently. 3-5 In this work, we compared 4 reconstruction methods for IFOF tracking including diffusion tensor imaging (DTI), q-ball imaging (QBI), generalized q-sampling imaging (GQI) and diffusion kurtosis imaging (DKI) to find the suitable method for further exploration of IFOF.Method
The scans were performed on a Siemens 3T Prisma scanner with a 64-channel head coil. High resolution Diffusion images were acquired using a multiband diffusion sequence used in the Lifespan Project 6 (TE/TR=86.80/3300ms, voxel size=1.5x1.5x1.5mm, FOV=210x210x132mm, multi-band factor=4, 6/8 partial fourier, bandwidth= 1880Hz/Px). The diffusion scheme includes 60 diffusion directions each at b=1000, 2000 s/mm2, with 8 b=0 images inserted in every 15 diffusion-weighted images, with a total imaging time of 7:20. The sequence was performed twice at reversed phase encoding directions for the estimation of susceptibility-induced off-resonance field 7, allowing the integrated correction for eddy-current-induced and susceptibility-induced distortions and subject movement using FSL 8. 3D T1 weighted images were also acquired employing a 5-minute magnetization prepared rapid gradient echo sequence (TE/TR=2.32/2300ms, voxel size=0.9x0.9x0.9mm, FOV=240x240mm, 192 axial slices).
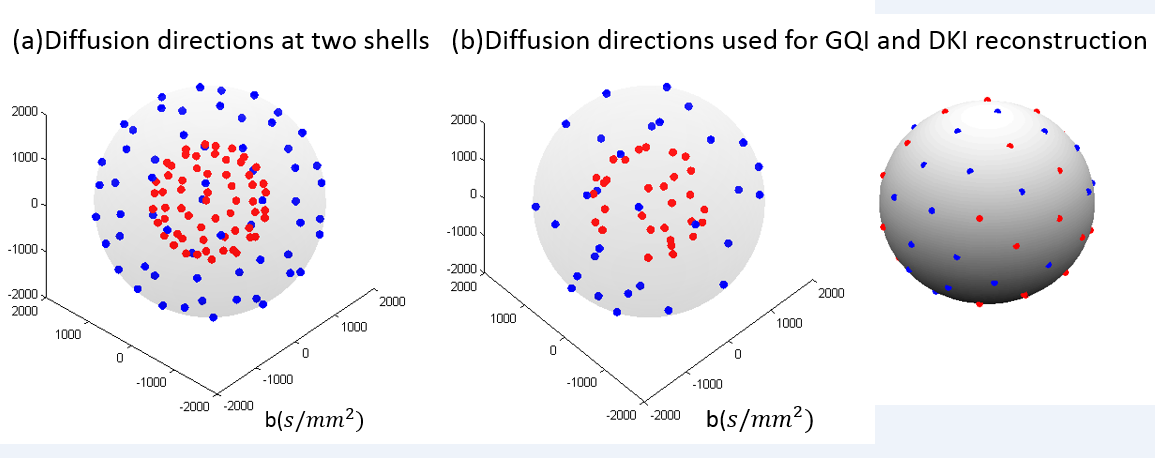
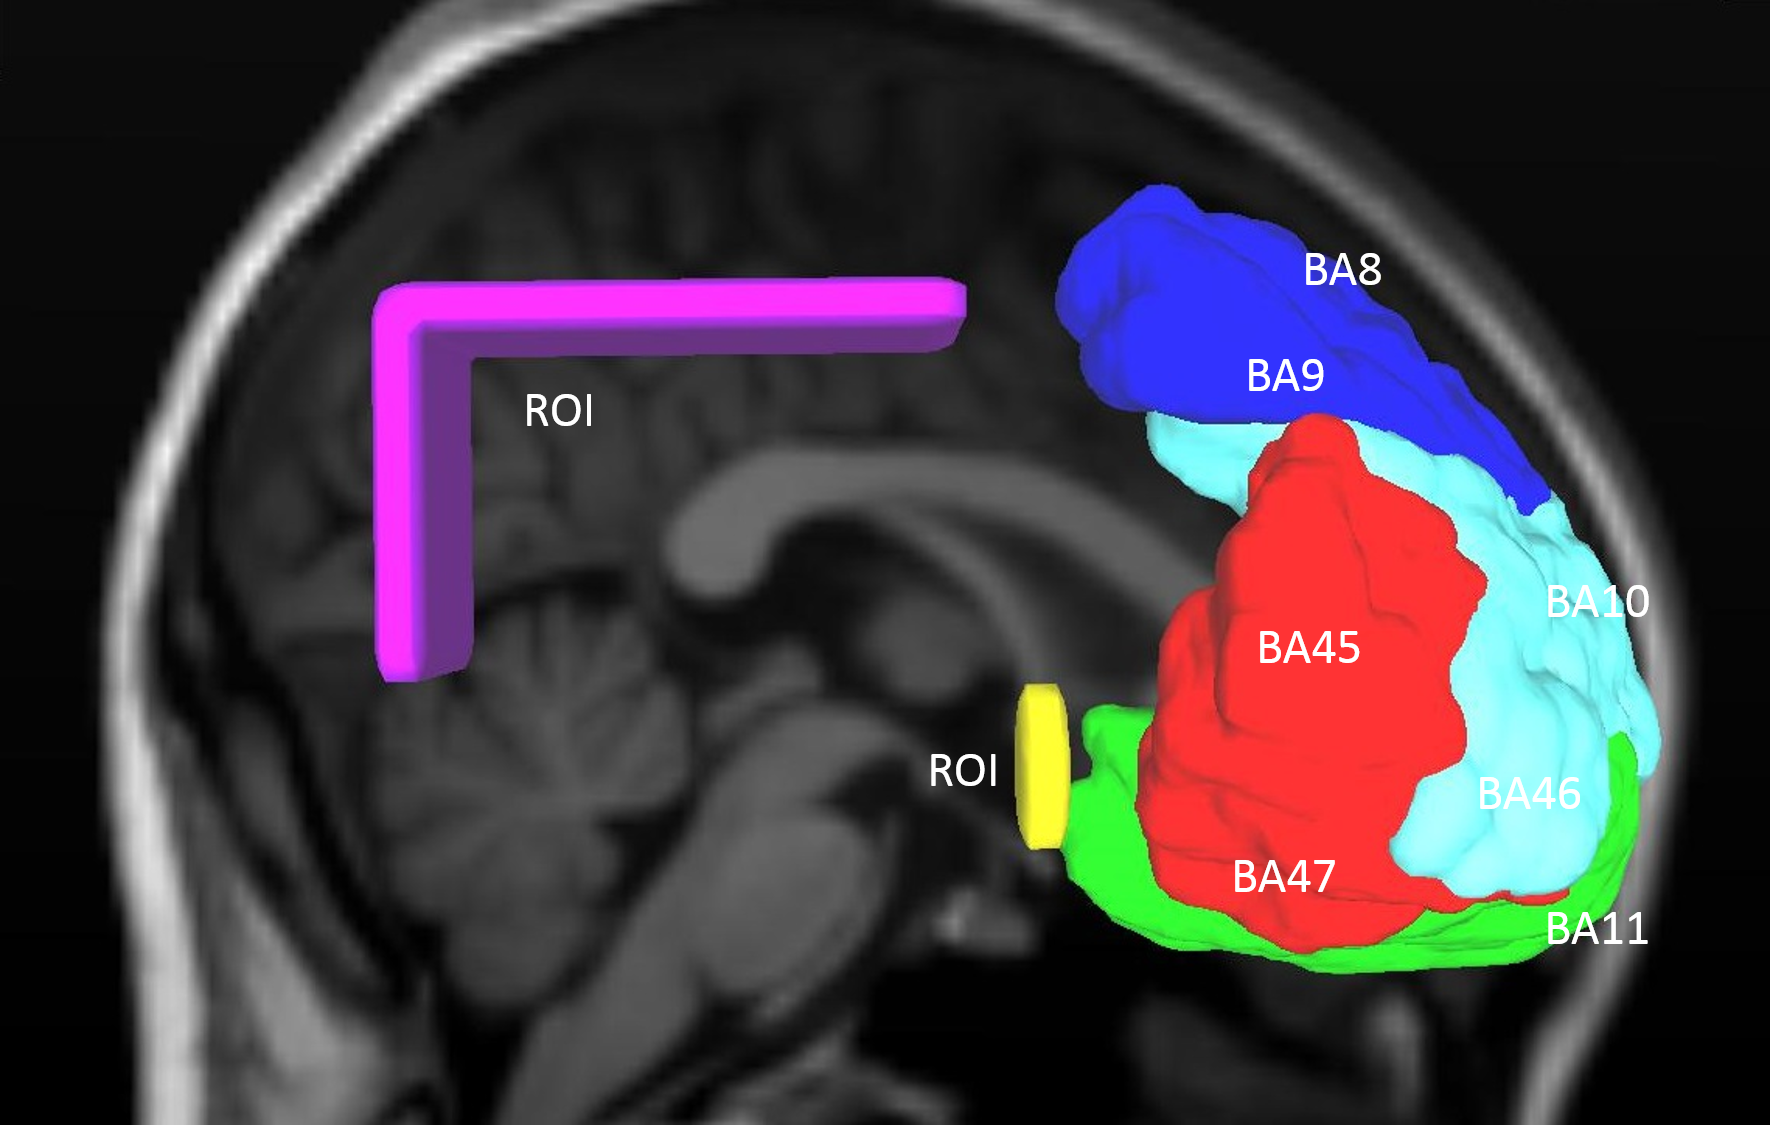
Orientations of diffusion images used for the four reconstruction methods were demonstrated with Figure 1. Orientation distribution function (ODF) reconstruction for DKI was performed at DKE 9 while reconstructions of DTI, QBI and GQI and related tractography were done in DSI studio (http://dsi-studio.labsolver.org). A whole brain deterministic tractography was performed with angle threshold of 50°, and FA threshold of 0.15 for DKI and DTI while QA threshold of 0.065 for GQI, QBI and the CMU-60 template 10 (shown as anatomical reference). The same ROIs were drawn in the right hemisphere to extract tracts passing from frontal areas to parietal and occipital region through the external capsule. These tracts were divided later according to their anterior terminations. The ROIs and anterior termination partitions are show in Figure 2.
Results & discussion
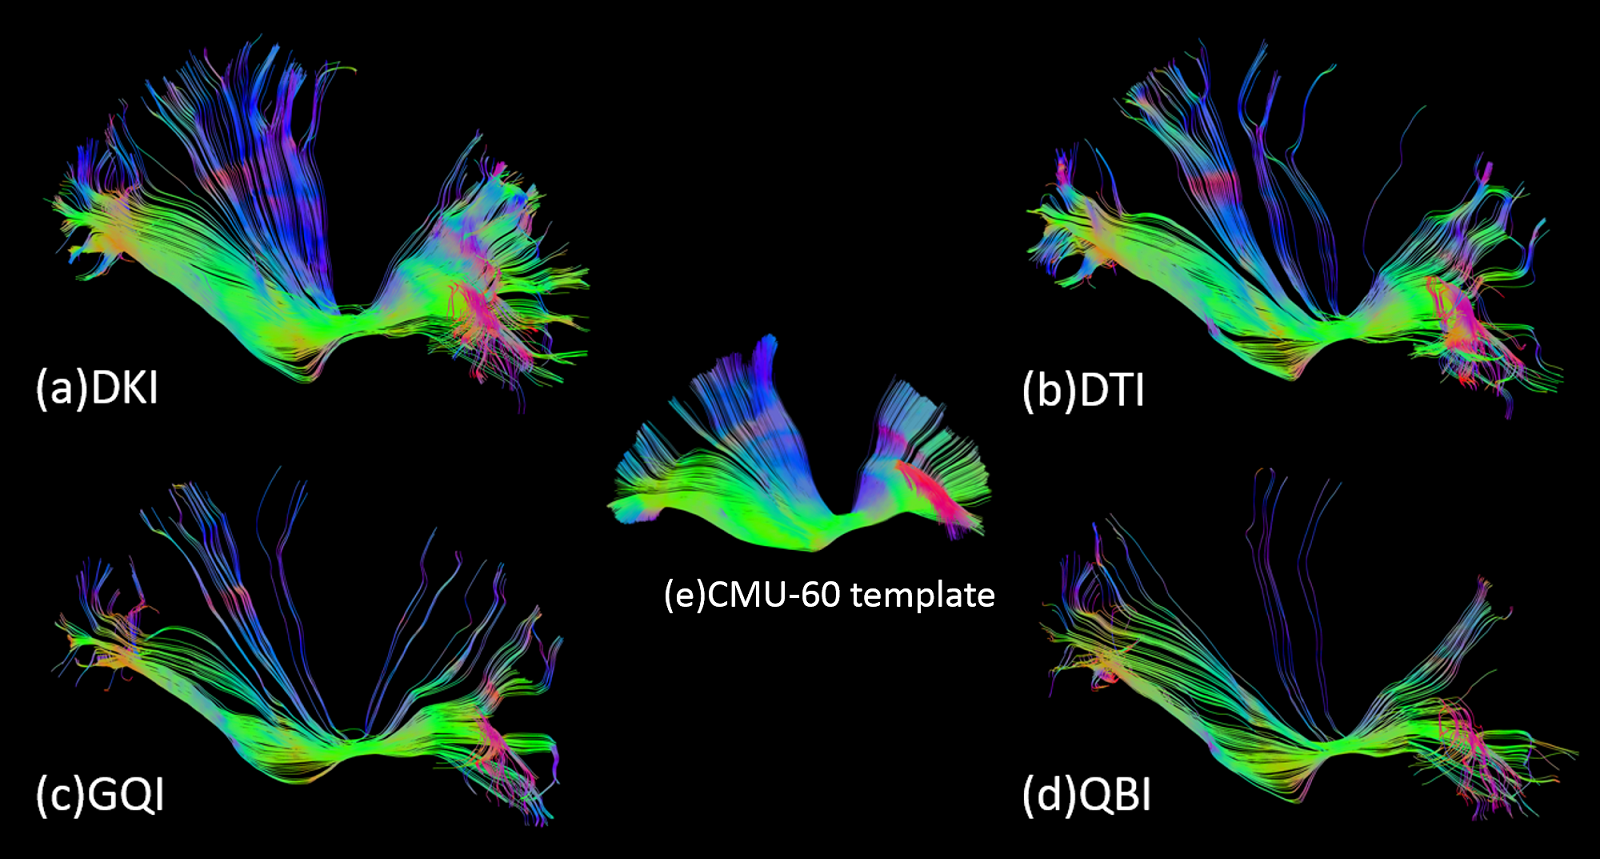
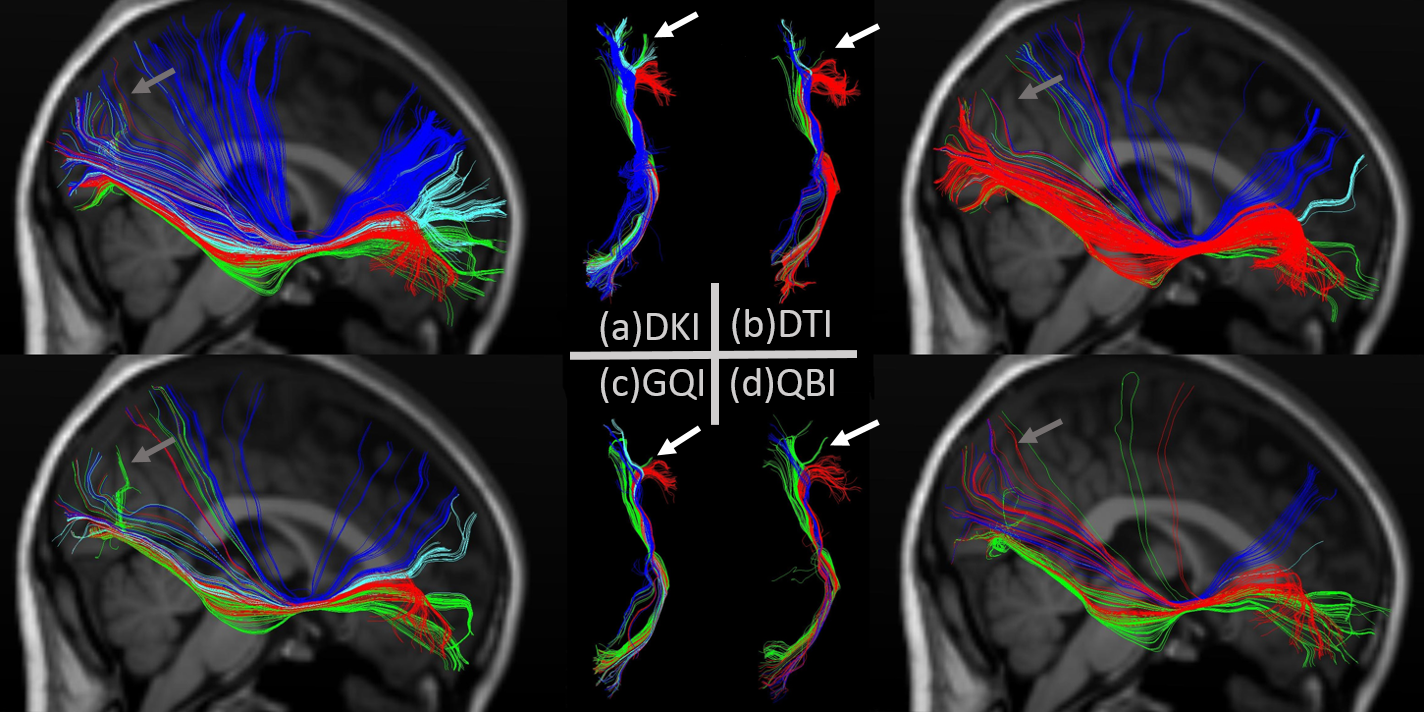
The extracted tracts are shown in Figure 3. Compared to the standard CMU-60 template, DKI shows the most complete result with denser tracts in the superior parietal region and rostral portion of the middle frontal region. QBI shows the fewest tracts to parietal lobe and rostral portion of the middle frontal lobe, that might be attributed to a lower SNR reconstructed from all images at b=2000s/mm2. Further fiber divisions are shown in Figure 4 with all looped or truncated tracts removed. DKI shows integrated tracts from superior frontal to superior parietal and rostral portion of the middle frontal to occipital cortex. DTI shows a deficiency to the lateral fronto-orbital cortex (LOFC) reported to be in 90% right hemispheres 5 but a rather larger connections to the inferior frontal near the LOFC compared to DKI, GQI and QBI. This gives us reasons to believe DTI has mistaken some tracts to LOFC to the inferior frontal since its shortage of handling crossing fibers. GQI shows a lack of tracts to the super occipital region compared to DKI and QBI while QBI shows a lack of tracts from the superior frontal to superior parietal region. The overall results have revealed the superiority of DKI in IFOF tracking. The result is in accordance with a previous theoretical and numerical calculations on a diffusion model of two intersecting fiber bundles 11, showing that DKI has an ODF resolving power similar to the exact ODF and higher than diffusion spectrum imaging (DSI) and QBI.
Previous IFOF studies used isotropic spatial resolution of 2-2.4mm which might include some partial volume effects. In this study the multiband sequence performed at reversed phase encoding directions has achieved a 1.5mm isotropic resolution with higher SNR in the same acquisition time of 2mm-resolution conventional diffusion scans.
Conclusion
The comparison study demonstrated better elucidation of the IFOF tracts from DKI reconstruction, which could help further studies of precise cortical terminations of IFOF that is crucial for the understanding of its function.Acknowledgements
The authors thank Center for Magnetic Resonance Research, University of Minnesota for the providing of C2P multiband diffusion sequence.References
1. Martino J, Brogna C, Robles S G, et al. Anatomic dissection of the inferior fronto-occipital fasciculus revisited in the lights of brain stimulation data. Cortex, 2010; 46(5): 691-699.
2. Martino J, Hamer P C, Vergani F, et al. Cortex-sparing fiber dissection: an improved method for the study of white matter anatomy in the human brain. Journal of Anatomy, 2011; 219(4): 531-541.
3. Caverzasi E, Papinutto N, Amirbekian B, et al. Q-Ball of Inferior Fronto-Occipital Fasciculus and Beyond. PLOS ONE, 2014; 9(6).
4. Wu Y, Sun D, Wang Y, et al. Subcomponents and Connectivity of the Inferior Fronto-Occipital Fasciculus Revealed by Diffusion Spectrum Imaging Fiber Tracking. Frontiers in Neuroanatomy, 2016.
5. Hau J, Sarubbo S, Perchey G, et al. Cortical Terminations of the Inferior Fronto-Occipital and Uncinate Fasciculi: Anatomical Stem-Based Virtual Dissection. Frontiers in Neuroanatomy, 2016.
6. Auerbach E J, Xu J, Yacoub E, et al. Multiband accelerated spin-echo echo planar imaging with reduced peak RF power using time-shifted RF pulses. Magnetic Resonance in Medicine, 2013; 69(5): 1261-1267.
7. Andersson J, Skare S, Ashburner J, et al. How to correct susceptibility distortions in spin-echo echo-planar images: application to diffusion tensor imaging. NeuroImage, 2003; 20(2): 870-888.
8. Andersson J, Sotiropoulos S N. An integrated approach to correction for off-resonance effects and subject movement in diffusion MR imaging. NeuroImage, 2016: 1063-1078.
9. Jensen J H, Helpern J A, Tabesh A, et al. Leading non-Gaussian corrections for diffusion orientation distribution function. NMR in Biomedicine, 2014; 27(2): 202-211.
10. Jarbo K, Verstynen T. Converging structural and functional connectivity of orbitofrontal, dorsolateral prefrontal, and posterior parietal cortex in the human striatum. The Journal of Neuroscience, 2015; 35(9): 3865-3878.
11. Jensen J H, Helpern J A. Resolving power for the diffusion orientation distribution function. Magnetic Resonance in Medicine, 2015; 76(2).
Figures