3494
On Quantitatively Comparing Tractography Algorithms1University of Pennsylvania, Philadelphia, PA, United States
Synopsis
Systematic comparison of tractography algorithms is rendered challenging by the differences in diffusion models and multiple parameters. In this work, we have defined a statistical framework to compare tractography algorithms, from two different perspectives: (1) the volume of generated tracts and (2) number of unbroken fibers. We applied our framework to compare six algorithms (four using tensor model and two using HARDI model) in reconstructing the contralateral corticospinal tract in ten brain tumor patients. Our results demonstrated significant differences between algorithms. These experiments establish our tractography comparison framework which can be used by researchers and tractography challenges for quantitative comparison.
Purpose
Tractography enables the reconstruction of white matter pathways in vivo, using diffusion weighted imaging (DWI). Comparison of tractography algorithms is rendered challenging by the differences in diffusion models (e.g., DTI or HARDI), parameters (e.g., fractional anisotropy (FA)), and sampling methodologies (e.g. deterministic or probabilistic). The current literature mostly relies on visual inspections of tracts of interest (TOIs), which is hard to generalize. Despite existence of statistical models to compare algorithms1, a comprehensive framework is still missing, which we propose here.Methods
We define a statistical framework to compare tractography algorithms, from two perspectives: (1) the change in the volume of TOI by varying parameters and (2) number of unbroken fibers connecting selected regions of interest (ROIs). First, to analyze the volume of the tract, we defined the following linear model,
$$V=a_0+a_1 M+a_2 P+a_3 M*P+a_4 FA+a_5 C+a_6 S, \quad \quad (1)$$
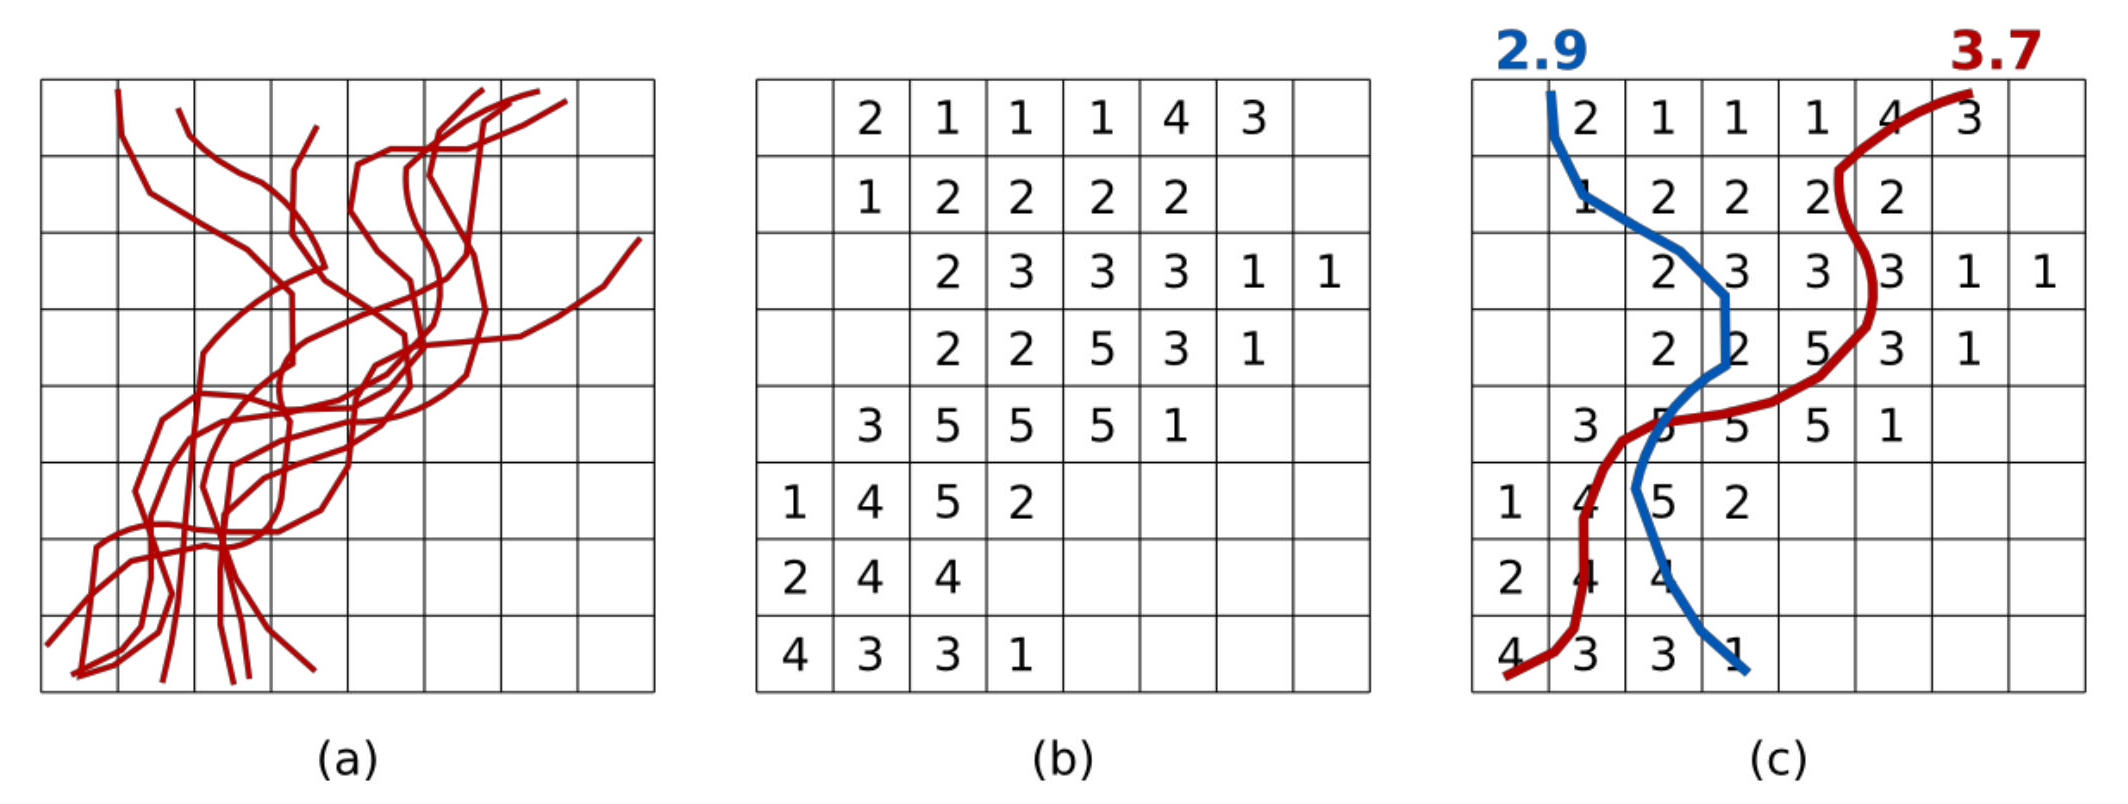
where $$$V$$$ is the volume of the TOI, computed as the number of voxels visited by fibers. The model is used to compare two algorithms at once, with $$$M$$$ is 0 for the first algorithm and 1 for the second. $$$P$$$ is the percentage of fibers of that are included. The model considers gradually increasing number of fibers ($$$P$$$), with fibers being included in the order of their sampling density (that is, from the most sampled fibers to the least sampled fibers). The sampling density of fibers are computed as explained in Figure 1. This procedure enables taking into account redundant fibers. The last three terms correspond to FA, curvature, and step size, respectively. More parameters can be included easily. Once the model is fitted, we query the statistical significance of $$$a_1$$$ (overall increase in volume from the first algorithm to the second) and $$$a_3$$$ (increase in the rate of volume per fiber). Second, we compare algorithms based on unbroken fibers between ROIs. This is especially important to quantify the efficiency of an algorithm in reconstructing challenging pathways, e.g. pathways connecting to the face area of the motor cortex.
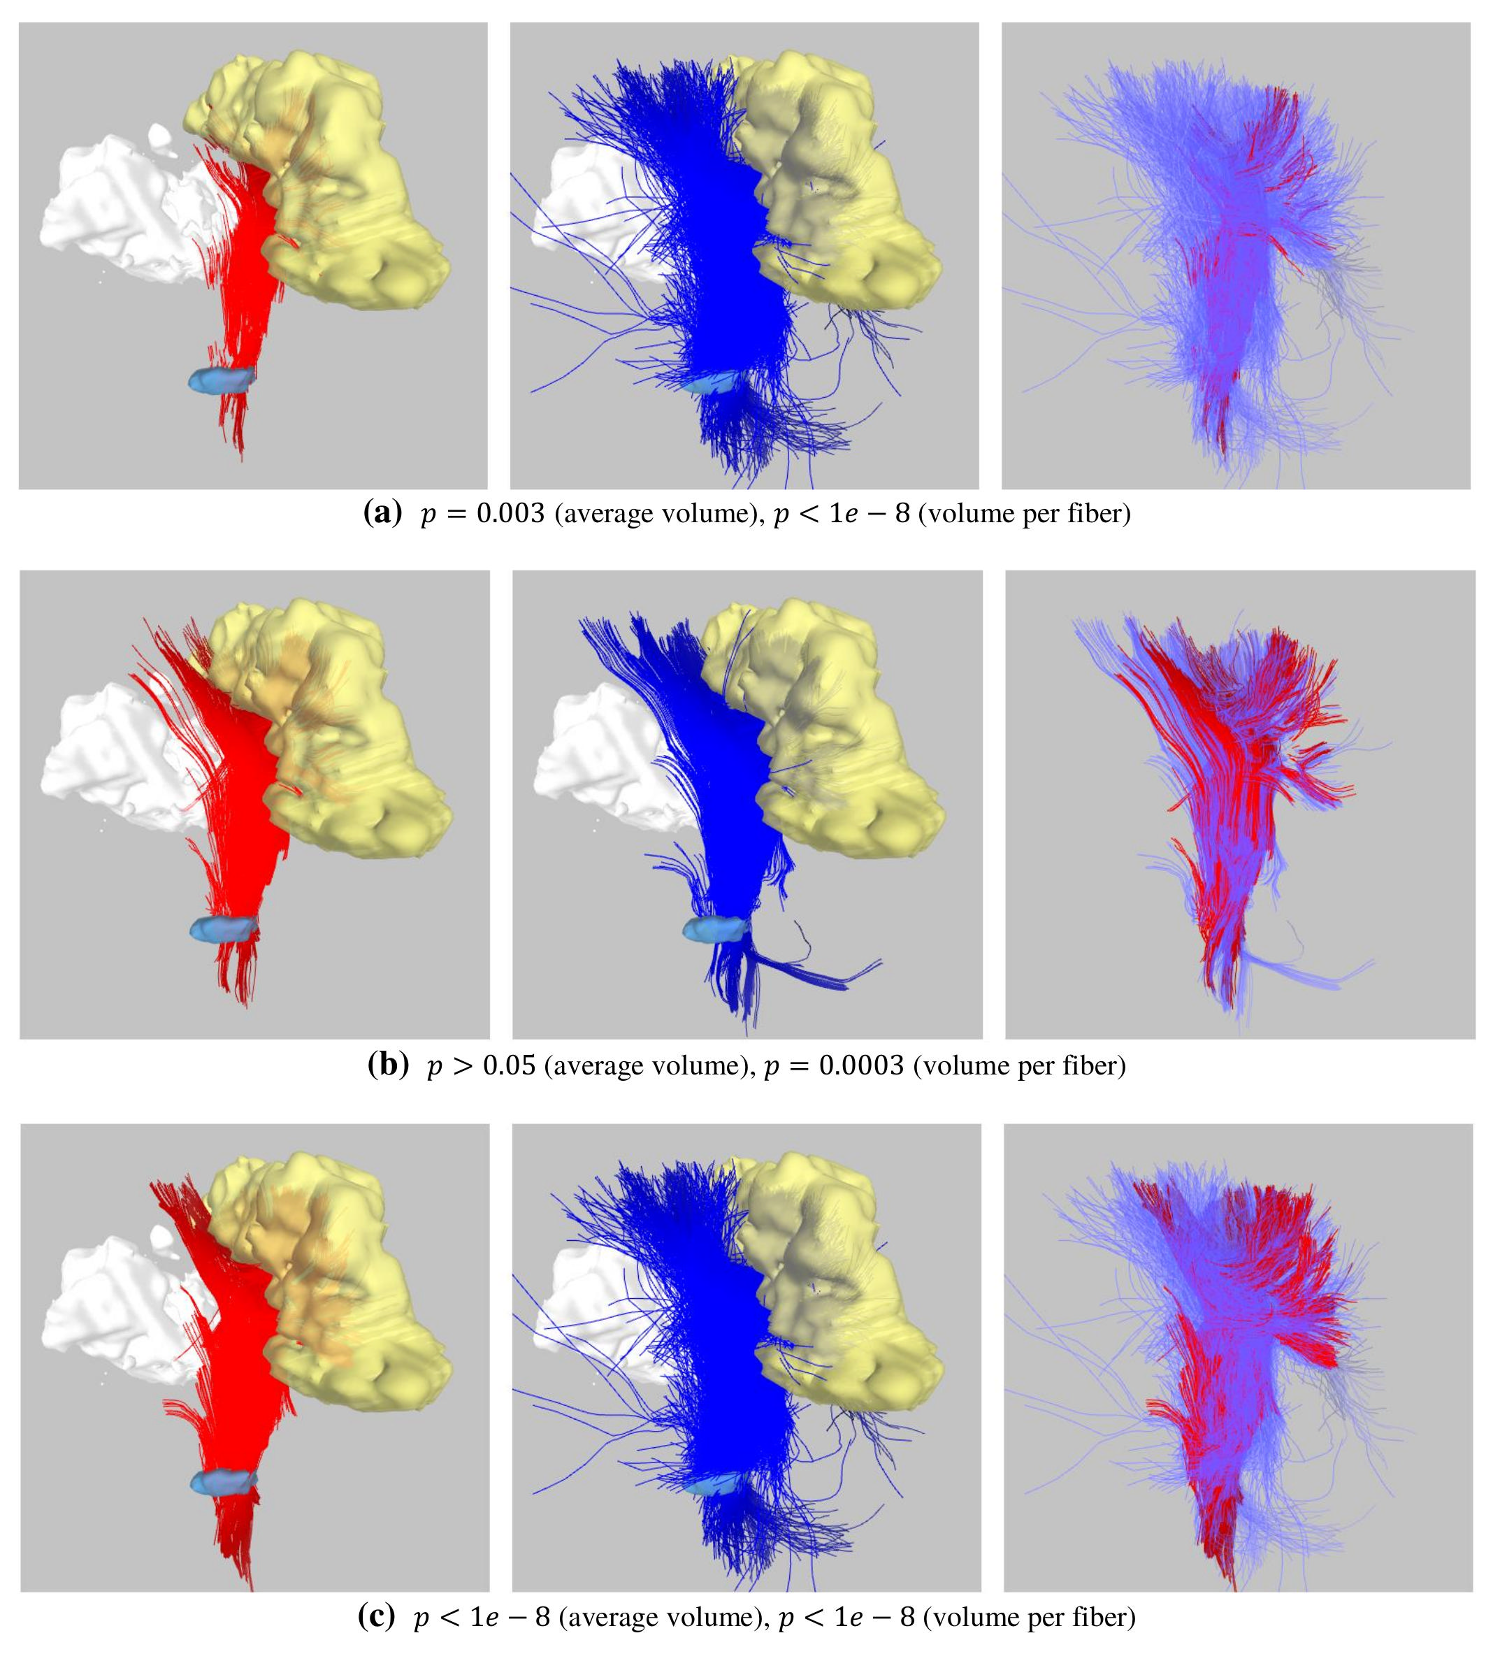
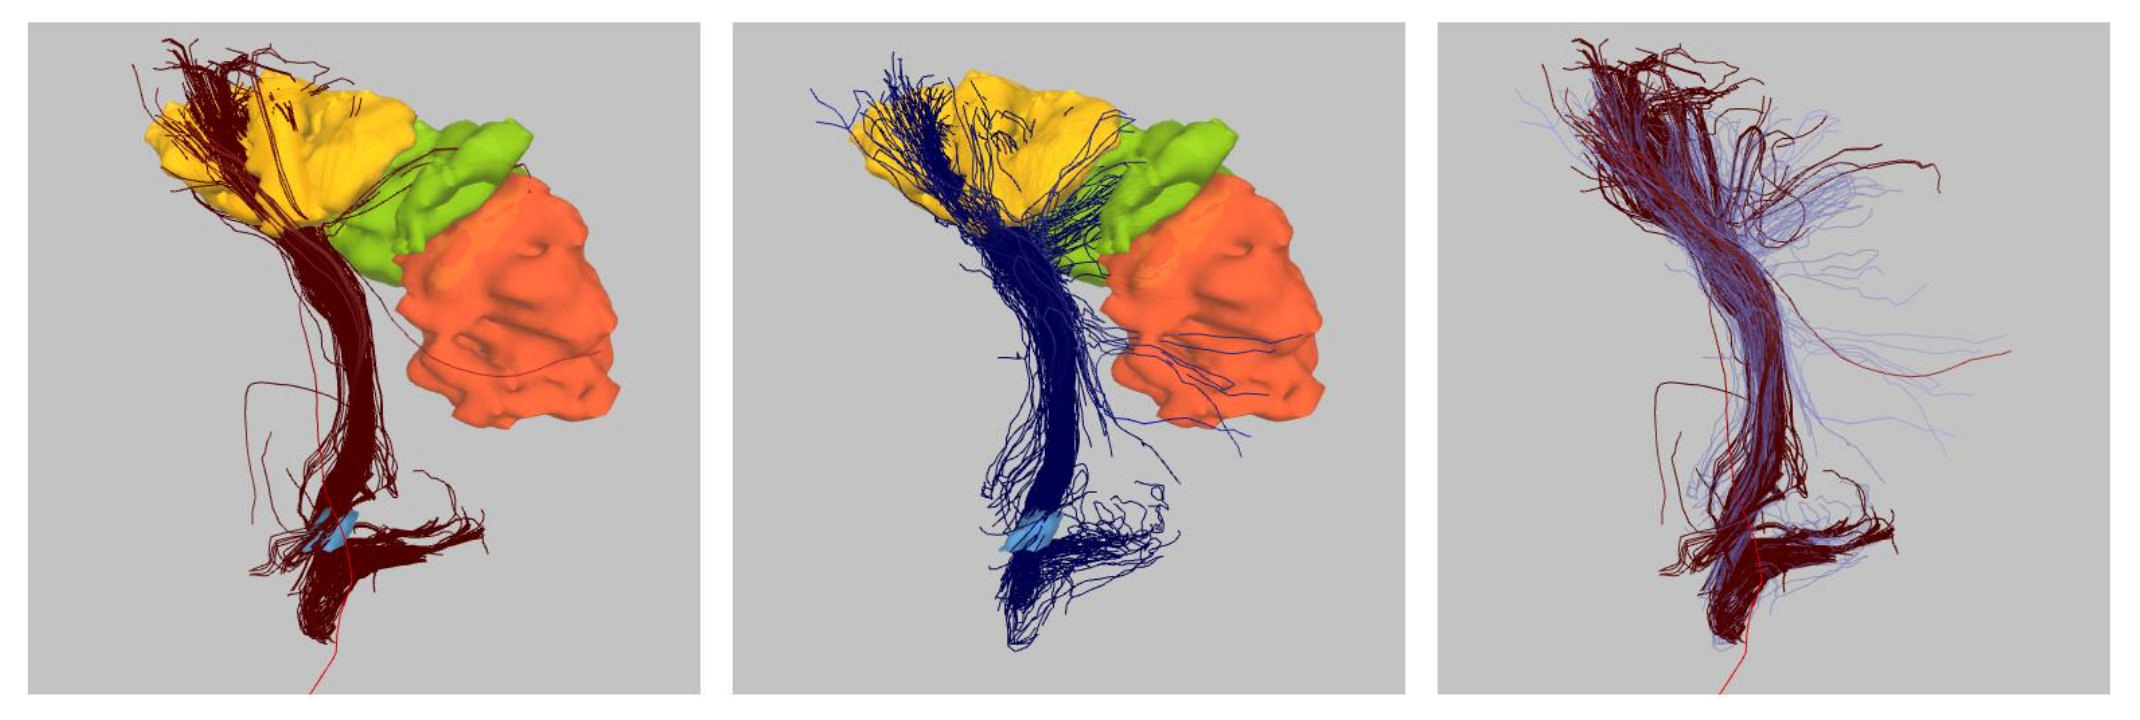
We applied our framework to compare six algorithms in reconstructing the corticospinal tract (CST) in 10 brain tumor patients, on the contralateral side where the CST is intact. DTI data was acquired on a Siemens 3T TrioTim scanner: TR/TE = 5000/86 ms, b-value = 1000 s/mm2, 30 gradient directions, single b0, resolution = 1.7 x 1.7 x 3.0 mm. We compared four deterministic tracking algorithms using tensor models (FACT, RungeKutta (order 4), Tensorline, Streamline)2, as well as one deterministic and one probabilistic algorithm using HARDI model3. We ran each algorithm to generate fibers of whole brain using 4 FA, 3 curvature, and 3 step size thresholds. We then used inclusion and exclusion ROIs to get the CST as cleanly as possible. For the second analysis (i.e., number of unbroken fibers), we considered unbroken fibers between cerebral peduncle and the precentral gyrus (primary motor cortex). We computed the ratio of volume of the motor cortex that was visited by fibers, both for the entire motor cortex and for its subdivisions separately (body, hand, and face regions).
Results
The probabilistic
algorithm generated higher volumes of CST (p<0.05) and had higher rate of
volume per fiber (p<1e-8), as compared to all other methods. There was no
significant change in the overall volume between the four algorithms using
tensor model, with only exception that the Streamline algorithm generated more
volume than the RK4 (p<1e-2). Surprisingly, the FACT algorithm generated
more volume compared to the deterministic algorithm using HARDI model
(p<1e-4). However, the volume per fiber rate was always the lowest for the FACT,
suggesting that it tends to sample redundant fibers. Between the Tensorline and
Streamline algorithms, the Tensorline generated more volume per fiber
(p<1e-3). When compared in terms of unbroken tracts, probabilistic
tractography generated more fibers reaching to entire motor cortex, as compared
to all other methods (p<1e-8). The FACT algorithm performed the worst (p<1e-8).
Regarding other four, the Tensorline performed the best, followed by the
Streamline, RK4, and the HARDI deterministic. Other than the probabilistic algorithm,
no method could generate fibers reaching to face region, with the Tensorline being
an exception in a few subjects when using very high angle thresholds.Conclusion
We have proposed a statistical framework to compare multiple tractography algorithms. Our results demonstrated significant differences between algorithms in reconstructing CST, with probabilistic tracking generating higher volumes. Among deterministic algorithms, the Tensorline performed better than the others. These experiments establish the utility of our tractography comparison framework which can be used by researchers and tractography challenges to quantitatively evaluate algorithm differences.Acknowledgements
This research was supported by the National Institutes of Health (NIH) grant R01-MH092862 (PI: Ragini Verma and C-F Westin).References
1. Tensaouti F, Lahlou I, Clarisse P, Lotterie JA, Berry I. Quantitative and reproducibility study of four tractography algorithms used in clinical routine. J Magn Reson Imaging. 2011;34(1):165-172. doi:10.1002/jmri.22584.
2. Wang R, Benner T, Sorensen AG, Wedeen VJ. Diffusion Toolkit: A Software Package for Diffusion Imaging Data Processing and Tractography. In: Intl Soc Mag Reson Med. ; 2007:3720.
3. Tournier J-D, Calamante F, Connelly A. MRtrix: Diffusion tractography in crossing fiber regions. Int J Imaging Syst Technol. 2012;22(1):53-66. doi:10.1002/ima.22005.
Figures