3492
Tract covariance networks in expert dancers and pianists1Institute of Medical Device and Imaging, National Taiwan University College of Medicine, Taipei, Taiwan, 2Department of Life Science, National Taiwan University, Taipei, Taiwan, 3Institute of Brain Science, National Yang-Ming University, Taipei, Taiwan, 4Integrated Brain Research Unit, Division of Clinical Research, Department of Medical Research, Taipei Veterans General Hospital, Taipei, Taiwan, 5Molecular Imaging Center, National Taiwan University, Taipei, Taiwan
Synopsis
To investigate plasticity of white matter tracts in expert dancers and pianists, we used diffusion spectrum imaging to measure generalized fractional anisotropy (GFA) of 76 major white matter tracts. A novel metric called tract covariance was defined as the correlation between each pair of tracts in variations of the mean GFA values across subjects. As compared with control subjects, expert dancers showed overall enhancement of the tract covariance, whereas expert pianists showed enhancement specific to sensory-motor processing. The findings underline the different effects on white matter tract plasticity following different types of long-term training.
Purpose:
Dancers and pianists receive shared and distinct features of training. Both require long-term and intense physical training to master. Dancers engage the whole body, and require the integration of visual, auditory and motor information. In comparison, pianists engage specific parts of the body and primarily require the integration of auditory and motor information. We hypothesized that these two forms of long-term training offer a unique way to investigate brain plasticity. In the present study we proposed a novel metric called tract covariance, and compared the effects of dance training and piano training on the tract covariance.Methods:
Subjects: Three groups of participants were recruited in this study: 29 expert dancers (age: 22.76 ± 2.65 years, 6 males and 23 females), 31 expert pianists (age: 21.42 ± 1.26 years, 9 males and 22 females) and 37 controls subjects (age: 22.5± 1.68 years, 9 males and 28 females). Dancers and pianists have been receiving professional training and had on average approximately 15 years of experience in their respective disciplines. Controls had on average less than one year in dance and piano practice. Imaging: MRI scans were performed on a 3T MRI system (TIM Trio, Siemens, Erlangen) with a 32-channel phased array coil. T1-weighted imaging utilized a 3D magnetization-prepared rapid gradient echo pulse sequence: TR/TE = 2530/3 ms, flip angle = 7o, FOV = 224 × 256 × 192 mm^3, matrix size = 224 × 256 × 192, and resolution = 1 x 1 x 1 mm^3. Diffusion spectrum imaging (DSI) used a twice-refocused balanced echo diffusion echo planar imaging sequence,1 TR/TE = 9700/136 ms, FOV=200 x 200 mm^2, matrix size = 80 x 80, 56 slices, and 2.5 mm in slice thickness. A total of 102 diffusion encoding gradients with the maximum diffusion sensitivity bmax=4000 s/mm^2 were sampled on the grid points in a half sphere of the 3D q-space with |q| ≤ 3.6 units.2 Analysis: We used whole brain tract-based automatic analysis to obtain a 2D connectogram for each DSI dataset.3 The connectogram provides generalized fractional anisotropy(GFA) profiles of 76 white matter tract bundles. We averaged the 100 values of each tract profile to obtain a mean GFA value for each tract. Tract covariance was defined as the partial correlation (controlling age) between each pair of tracts in variations of GFA values across subjects. We classified 76 tracts into 10 categories according to their anatomical positions. These categories included association fibers(AF) of cortical part, AF of subcortical part, projection fibers(PF) of the cortical spinal tract(CST), PF of the frontal-striatum, PF of the thalamic radiation, callosal fibers(CF) of prefrontal part, CF of motor part, CF of parietal part, CF of temporal part and CF of occipital part. Correlations between pairs of tracts in these 10 categories resulted in a matrix of correlations, containing 55 sub-matrices of the tract covariance matrix. The correlation coefficients were converted into z values based on Fisher's r to z transform. The transformed z values were used to compute a Z statistic which allowed statistical comparison of the group difference in the correlations.4 Statistical comparison of the tract covariance was performed among dancer, pianist and control groups using a nonparametric Kruskal-Wallis one-way ANOVA test procedure.5 Multiple comparisons were corrected using a false discovery rate (FDR) of 0.05.6 To determine the difference between groups, post hoc Mann-Whitney U Test was applied.7Results and Discussion:
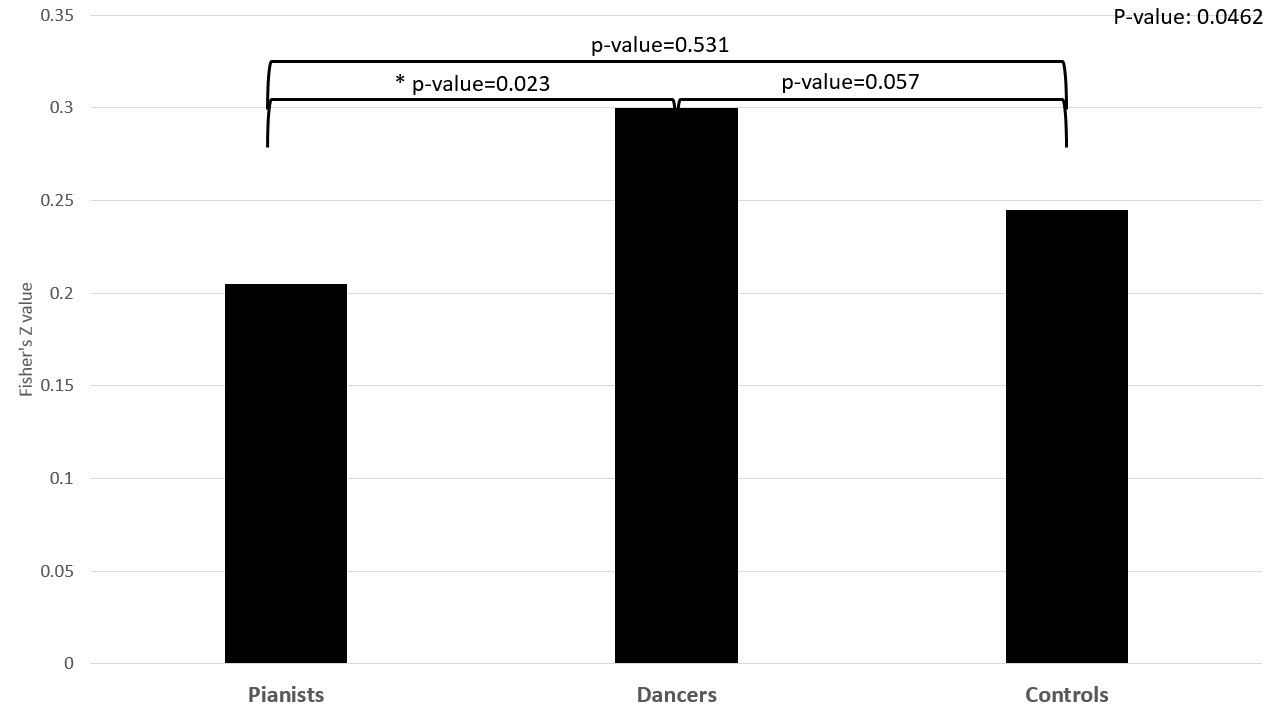
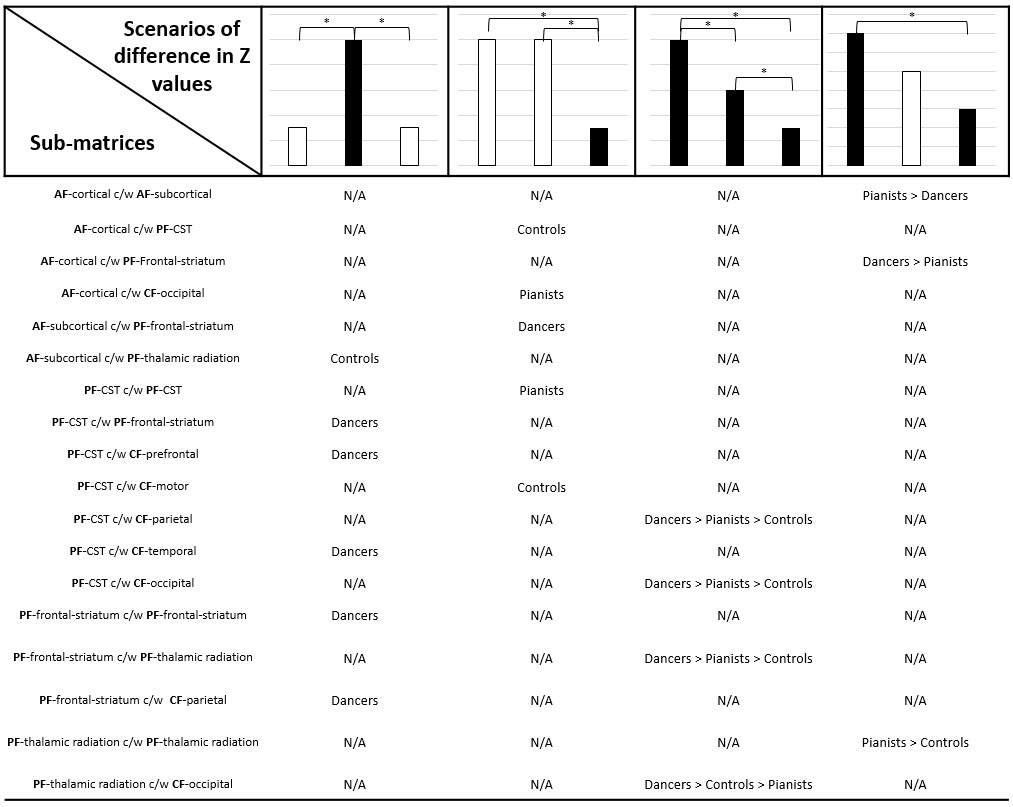
There was a significant difference in the tract covariance among the three groups at the whole brain level (p-value=0.0462)(Figure1). Nonparametric one-way ANOVA of the regional Z values of the tract covariance in 55 sub-matrices revealed 18 sub-matrices(Table 1) that were significantly different among the three study groups(FDR=0.05 after Benjamini-Hochberg corrections for multiple comparisons). A closer look at these 18 sub-matrices showed that dancers had increased tract covariance not only among the PF tracts but also between the PF tracts and other tracts of multiple categories, including the AF of cortical part, CF of prefrontal part, CF of premotor part, CF of parietal part, CF of temporal part and CF of occipital part. Comparing to controls, pianists showed higher tract covariance of the CST tracts with AF of cortical part, CF of parietal part and CF of occipital part. Notably, these tracts are known to involve sensory-motor processing, which is crucial for piano training.8 The results are consistent with our hypothesis that intense whole-body dance training may enhance the correlation of projection fibers with different tracts in multiple categories, leading to an overall enhancement of the tract covariance. In contrast, piano training may result in focused enhancement in effector-specific pathways.Acknowledgements
No acknowledgement found.References
1. Reese, T.G., et al., Reduction of eddy-current induced distortion in diffusion MRI using a twice-refocused spin echo. Magn. Reson. Med. 2003; 49 (1), 177–182.
2. Kuo, L.W., et al., Optimization of diffusion spectrum imaging and q-ball imaging on clinical MRI system. NeuroImage. 2008; 41 (1), 7–18.
3. Chen Y, Lo Y, et al., Automatic whole brain tract-based analysis using predefined tracts in a diffusion spectrum imaging template and an accurate registration strategy. Human Brain Mapping. 2015; 36(9):3441-3458.
4. Cohen, J. Cohen. P. Applied multiple regression/correlation analysis for the behavioral sciences. Hillsdale, NJ: Erlbaum; 1983.
5. Kruskal WH, et al. Use of ranks in one-criterion variance analysis. Journal of the American Statistical Association. 1952; 47:583-621. Addendum. 1953; 48:907-911.
6. Benjamini, Y., et al., The control of the false discovery rate in multiple testing under dependency. Ann. Stat.2001;29(4):1165-1188.
7. Kasuya, et al., Mann–Whitney U test when variances are unequal. Animal Behaviour, 2001;61.6:1247-1249.
8. Bengtsson, et al., Extensive piano practicing has regionally specific effects on white matter development. Nature neuroscience, 2005;8.9: 1148-1150.
Figures