3491
Towards a connectome atlas of the C57Bl6 mouse brain using ex vivo ultra-high field diffusion MRI1Grenoble Institut des Neurosciences, Université Grenoble Alpes, Grenoble, France, 2INSERM U1216, Grenoble, France, 3Unité Mixte de Service IRMaGe, Grenoble Alpes Hospital, Grenoble, France, 4Unité Mixte de Service 3552, CNRS, Grenoble, France, 5NeuroSpin, CEA Saclay, Gif-sur-Yvette, France
Synopsis
Diffusion MRI is a powerful tool to investigate the structural connectivity of the brain and to characterize its microstructure. In this study, we propose to adapt the white matter bundles clustering approach - previously achieved on humans - to the mouse in order to establish the foundations of a novel atlas of the structural connectivity. To this aim, 3D High Angular Resolution Diffusion Imaging (HARDI) was performed ex vivo on C57Bl6 mice brains (100µm isotropic) at 9.4T and clusters of fibers were computed using an automated procedure across the entire brain.
Purpose
Diffusion MRI (dMRI) is a powerful tool to investigate the structural connectivity of the brain and to characterize its microstructure. Ultra-high field preclinical MRI systems, which allow to reach a much higher spatial and angular resolution, offer the possibility to segment white matter bundles in a similar way to what was previously achieved in humans. In this study, we propose to adapt the massive clustering approach of Guevara [1] to the mouse in order to establish the foundations of a novel atlas of the structural connectivity. To this aim, 3D High Angular Resolution Diffusion Imaging (HARDI) was performed ex vivo on C57Bl6 mice brains and clusters of fibers were eventually computed using an automated procedure.Methods and Materials
Animals – The MRI protocol was applied to seven ex vivo C57Bl6 mice (3 females, 4 males, 9 – 11 weeks old). Following intracardiac perfusion (4% paraformaldehyde + Gd-DOTA), the animal was decapitated and the fixed head was imaged.
Post-processing – Data analysis was performed using the Connectomist toolbox [2]. After data registration, orientation distribution functions (ODFs) were computed using the analytical Q-ball model [3]. A deterministic regularized streamline tractography [4] was performed to infer a dense whole brain connectogram per animal (~300 000 connections) using the following parameters: 1 seed per voxel, aperture angle of 30°. The connectivity matrix was computed using a mouse brain atlas composed of 148 regions [5]. The intra-subject clustering pipeline was tuned to match the anatomy of C57Bl6 mice brains: only one segment was selected corresponding to the entire brain, the percentage of bundle extraction was set to 30% for the two clustering steps. After dividing the input connectogram into 10 length groups, a 2-steps hierarchical clustering was applied (average number of clusters of 40, average cluster size of 2000 voxels). Eventually, the centroid of each bundle was computed using the mean fiber approach.
Results
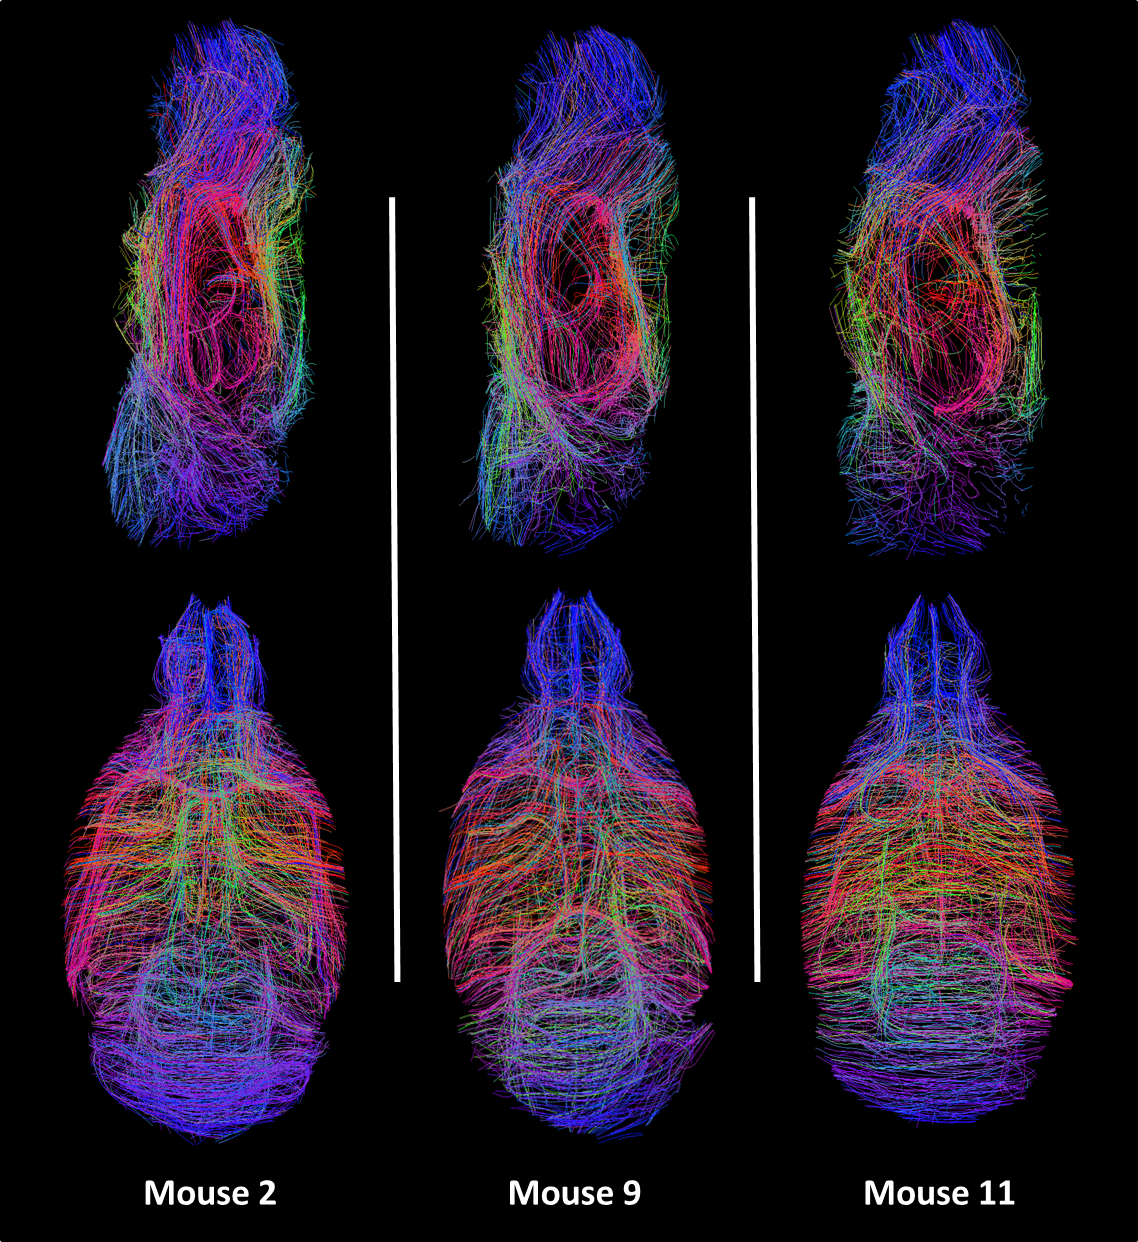
The diffusion data (Fig. 1) underwent deterministic regularized streamline tractography. Fig. 2a allows for a better understanding of the complex whole-brain white matter tractogram of Fig. 2b, with the characterization of the different fiber length computed. Fibers from 6 to 9 mm long represent the largest group in a fixed C57Bl6 mouse brain. Measuring connectivity matrices also permits to disentangle the data by emphasizing the main pathways within the brain (Fig 3b). As expected, the corpus callosum (label 122) is strongly linked with the regions composing the cerebral cortex with a 51% standard deviation. Other regions show a much higher standard deviation, as for instance the cingulum region (label 125). This may be related to its relatively small size: the cingulum represents less than 0.1% of atlas volume. Fig. 4 represents the centroids of the fiber bundles (mean fiber bundles) after computation of intra-subject fiber clustering for 3 typical mice. A reduction factor of over 250 in the number of fibers was seen after this step. Some heterogeneities of the pathways are visible but we can still find the same main fiber bundles.Discussion
In this study, we show the successful measurement of ex vivo high-resolution whole-brain 3D diffusion in seven C57Bl6 mice. The complexity of the atlas – with numerous small size regions (only 13 regions out of 148 represent over half the volume of the atlas) - requires a perfect matching on the diffusion dataset to preserve a low standard deviation. An 8 seeds per voxel (instead of 1) regularized deterministic tractography will be used to consolidate our results during the next step of this project consisting of an inter-subject fiber clustering that will allow us to build the C57Bl6 mouse connectivity atlas itself.Acknowledgements
This project is partially funded by the DS0402 2014 program French National Research Agency (ANR) - project ANR-14-CE13-0030 "PHYSIOBS"Grenoble MRI facility IRMaGe was partly funded by the French program “Investissement d’Avenir” run by the ‘Agence Nationale pour la Recherche’ ; grant 'Infrastructure d’avenir en Biologie Santé' - ANR-11-INBS-0006
References
1. Pamela Beatriz Guevara Alvez. Inference of a human brain fiber bundle atlas from high angular resolution diffusion imaging. Other. Universite Paris Sud - Paris XI, 2011. English.< NNT : 2011PA112123>.<tel-00638766 >
2. D. Duclap, A. Lebois, B. Schmitt, O. Ri, P. Guevara, M. L, B. V, P. F, M. J-F, and P. C. Connectomist-2.0: a novel diffusion analysis toolbox for brainvisa. In Proceedings of the European Society Magnetic Resonance in Medicine and Biology, 2012.
3. M. Descoteaux, E. Angelino, S. Fitzgibbons, and R. Deriche. Regularized, fast and robust analytical q-ball imaging. Magn. Reson. Med., 58:497-510, 2007.
4. M. Perrin, C. Poupon, Y. Cointepas, B. Rieul, N. Golestani, C. Pallier, D. Riviere, A. Constantinesco, D. Le Bihan, J. f. Mangin, and C. H. Strasbourg. Fiber tracking in q-ball fields using regularized particle trajectories. In Proc. of IPMI, pages 52-63, 2005b.
5. E. Calabrese, A. Badea, G. Cofer, Y. Qi, and G. Allan Johnson. A Diffusion MRI Tractography Connectome of the Mouse Brain and Comparison with Neuronal Tracer Data, Cereb. Cortex first published online June 5, 2015 doi:10.1093/cercor/bhv121
Figures
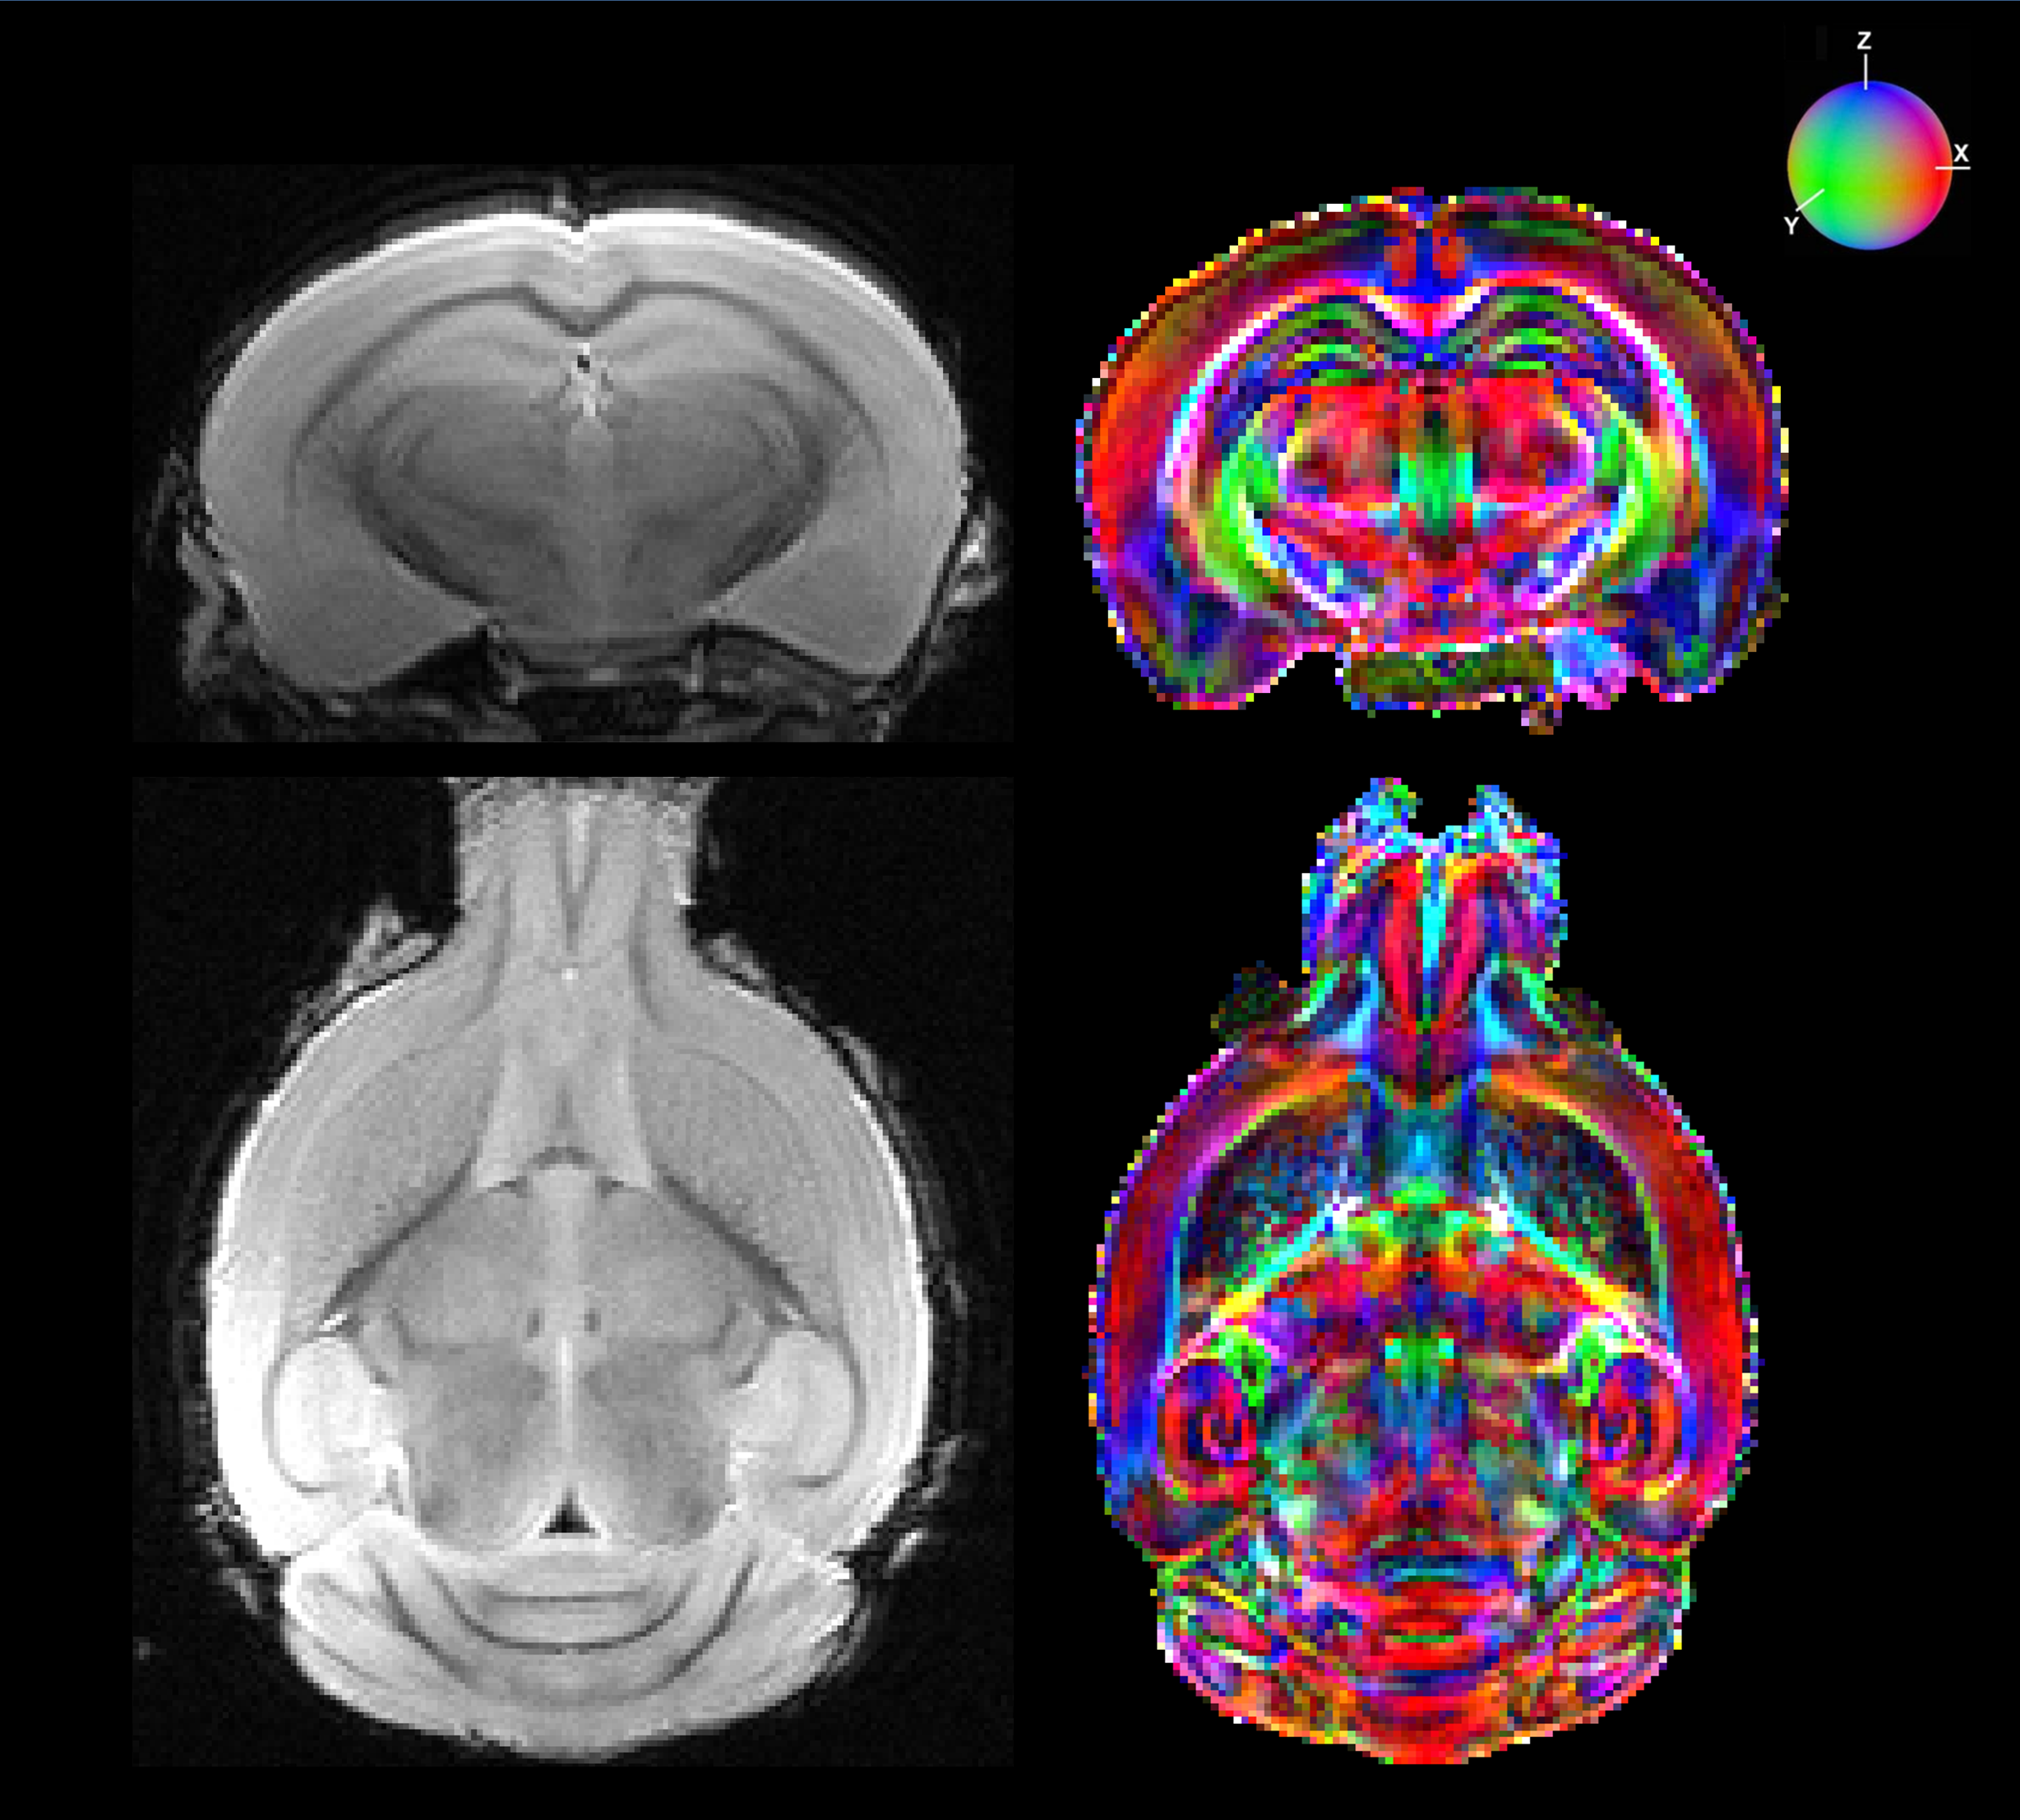
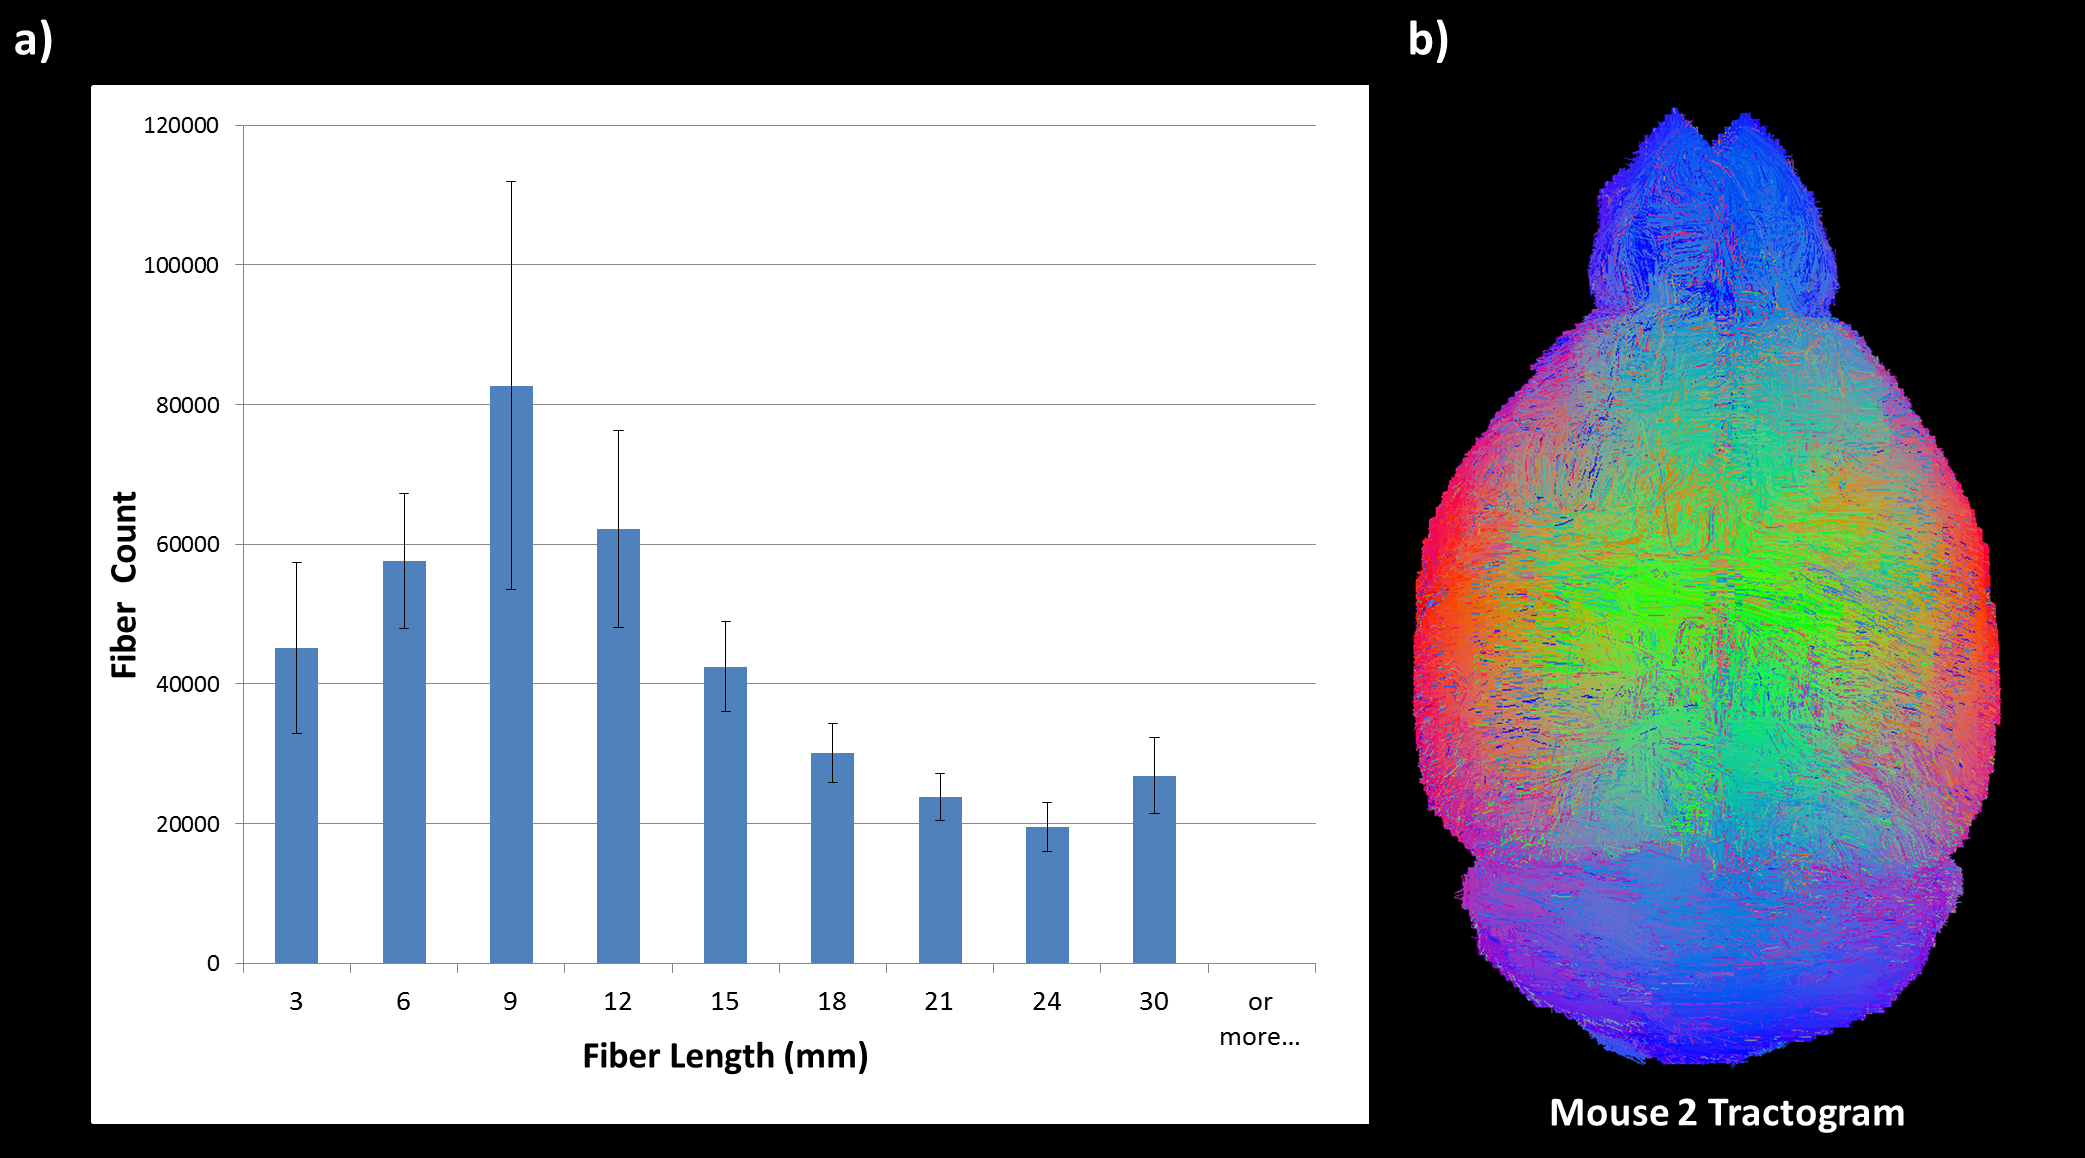
Fig. 2 : (a) Average of the number of fibers found in each length interval (0-3/3-6/6-9/9-12/12-15/15-18/18-21/21-24/24-27/27-30 mm or more) for the seven mice after deterministic regularized tractography (Mean ± SD).
(b) Whole tractogram for one C57Bl6 mouse (~ 400 000 fibers). On this figure, color is not related to fiber direction and is used for visualization purposes.
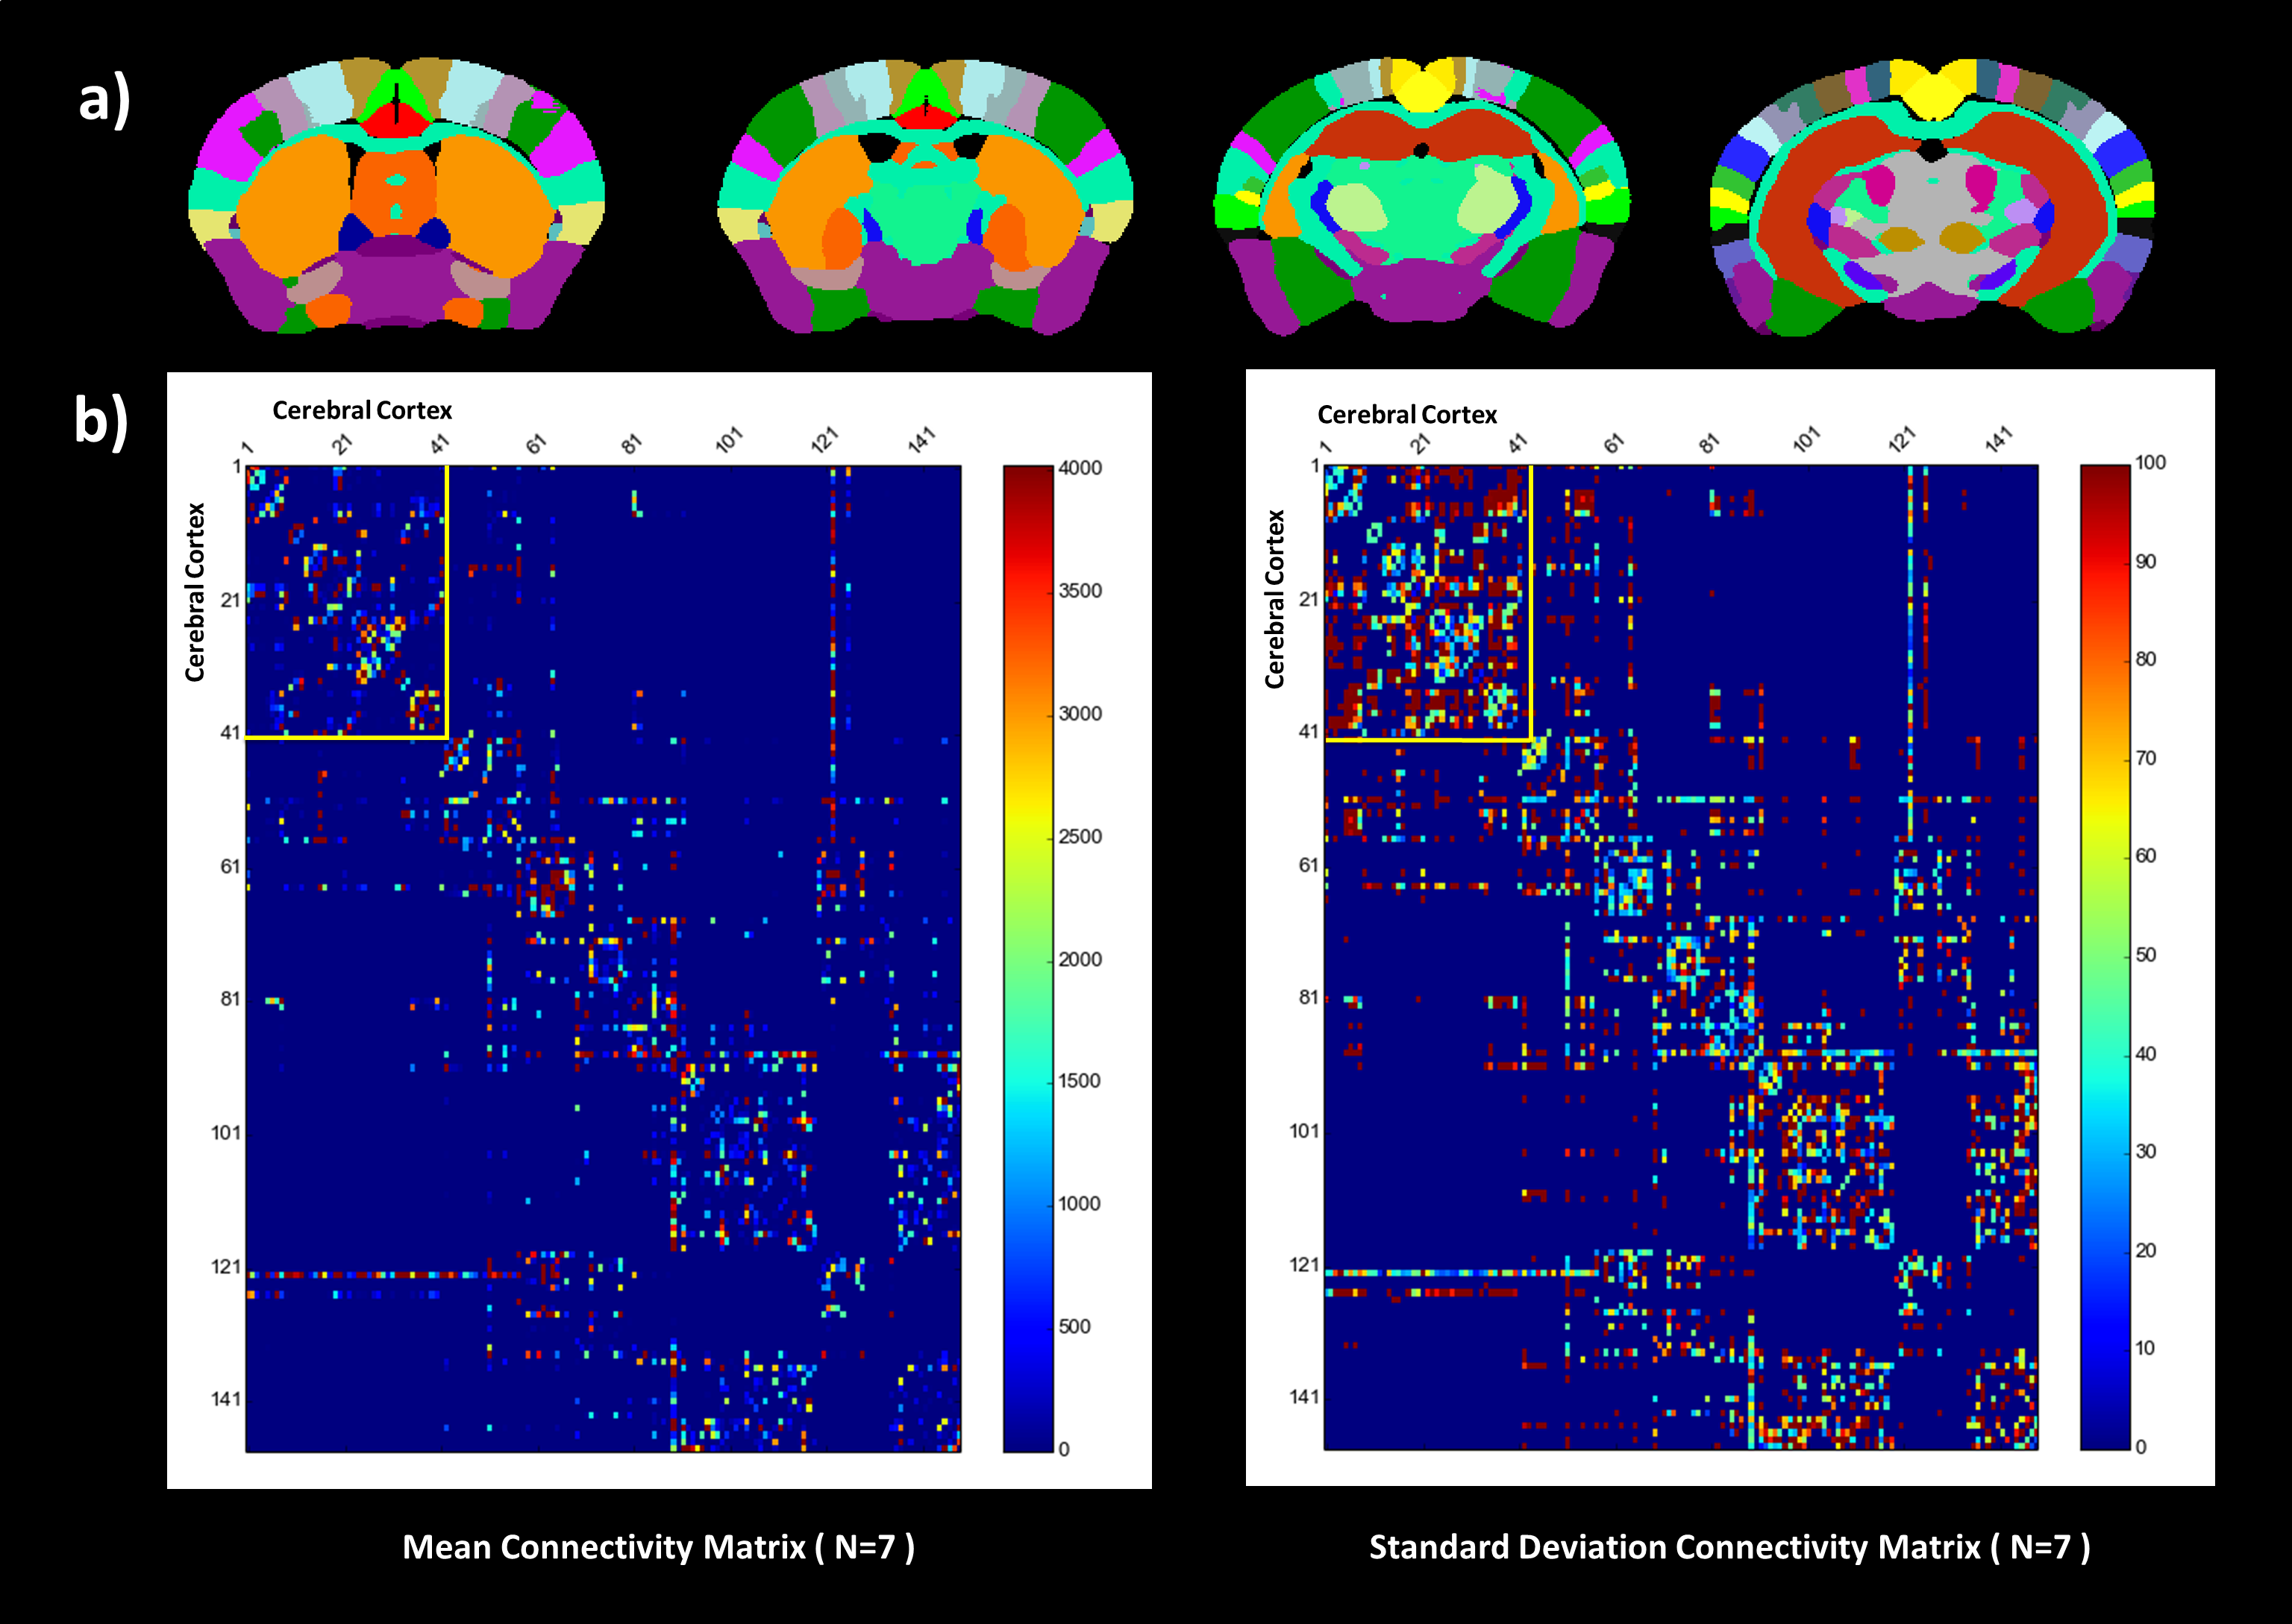
(b) Mean (left) and standard deviation (expressed in percentage of the mean) (right) connectivity matrices for seven C57Bl6 mice. The up-left corner – yellow box – represents the regions of the cerebral cortex. Label 122 and 125 respectively represent the corpus callosum and the cingulum.