3488
Impact of white-matter hyperintensities on tractography1Sherbrooke Connectivity Imaging Lab (SCIL), Université de Sherbrooke, Sherbrooke, QC, Canada, 2INCIA, UMR 5287, Université de Bordeaux, EPHE PSL Research University, Talence, France
Synopsis
A common way to seed tractography is thresholding the Fractional Anisotropy (FA). This technique is problematic for aging diffusion MRI studies because the FA decreases dramatically in regions of White Matter Hyperintensities (WMH) and thus, the tractography can erroneously start or stop in these WMH regions. We show the importance for tractography pipelines to correct for WMH in their tracking masks. We show that the non-correction can lead to approximately 15% erroneous streamlines, which are false connections that can pollute the structural connectome and lead to misinterpretations.
Purpose
Most tractography processing pipelines are designed and tuned to work on healthy control datasets. Pathological brains are often not well suited for tractography. This is the case for aging datasets where 90% of subjects older than 60 years show White-Matter Hyperintensities (WMH) on MRI images1. Previous studies have reported a decrease of Fractional Anisotropy (FA) in regions of hyperintensities2. Decreased FA in WMH will certainly have an impact on the seeding and stopping criteria of fiber tracking algorithms. This abstract presents the effects and the importance of dealing with these hyperintensities on the tracking masks and on the principal fiber orientation distribution function (fODF) directions.Methods
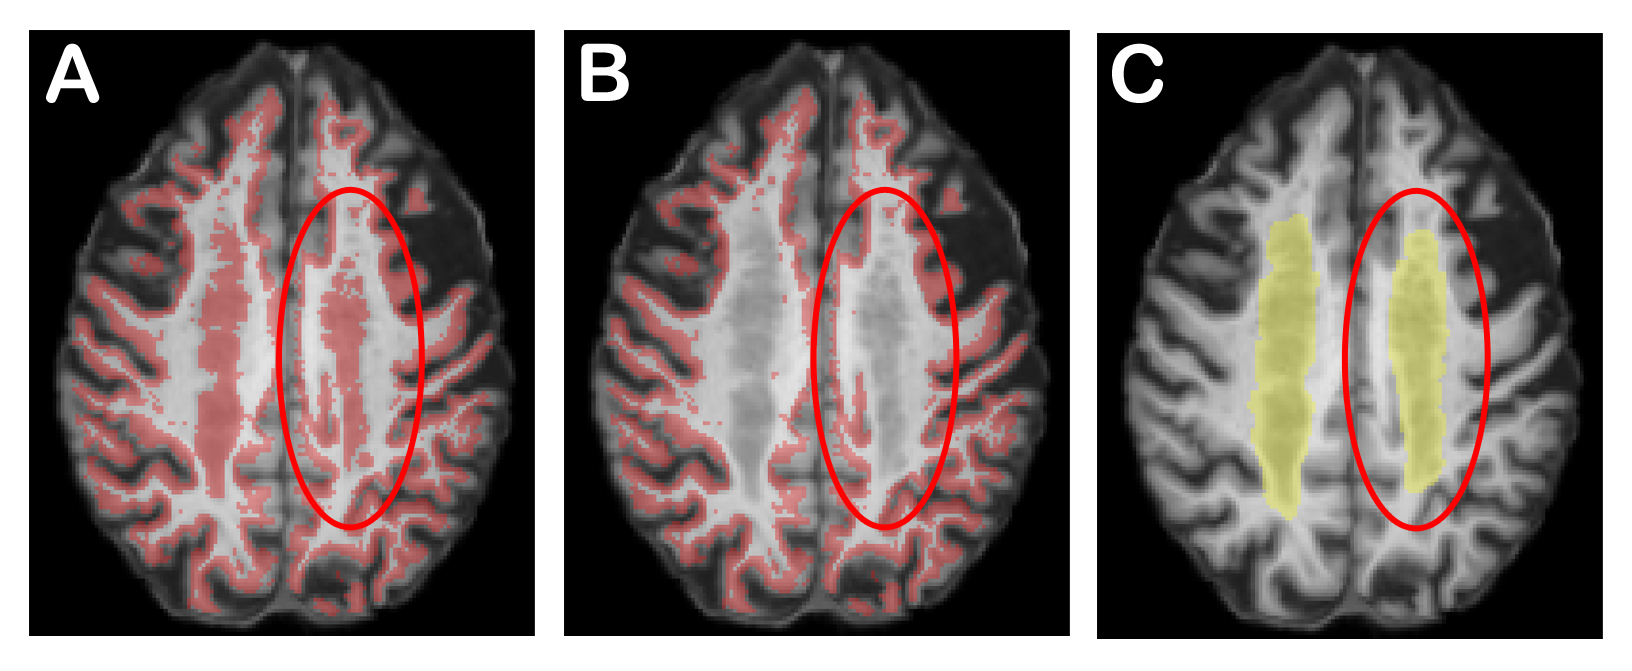
Datasets are acquired on a 3.0T Philips Achieva from 5 older subjects (mean age: 86.32 years). On each subject, we have a diffusion weighted images with 22 directions (b = 1000s/mm2 and voxel size: 2x2x2 mm3) and a 1mm isotropic T1-weighted image and a 0.72×1.20×5 mm3 FLAIR sequence3. Severity of WMH was evaluated by two trained operators according to the Fazekas4 rating scale. Using this visual scale, we selected subjects with an extensive halo of WMH (grade 3). We compute white-matter (WM), gray-matter (GM) and cerebrospinal (CSF) maps with Statistical Parametric Mapping5 and a WMH probability mask with the Lesion Segmentation Tool6. We compute the fODF7 with maximal Spherical Harmonic order of 68. We then generate include, exclude and WM-GM interface tracking masks as in9. The main problem with these masks is that the voxels with WMH are considered like GM voxels (see Figure 1). However, the WMH should be in the WM mask. To correct for this problem, we remove them from the interface (Figure 1.B) and we add them accordingly in the include and exclude masks. Then, we perform anatomically constrained probabilistic tractography using the Particle Filtering Tractography (PFT)9 with one seed per voxel from the GW-WM interface.
To study the impacts of hyperintensities on tractography, we do PFT with and without tracking mask correction. We extract the number of seeds and streamlines in both results as well as quantify streamlines through WMH.
Results
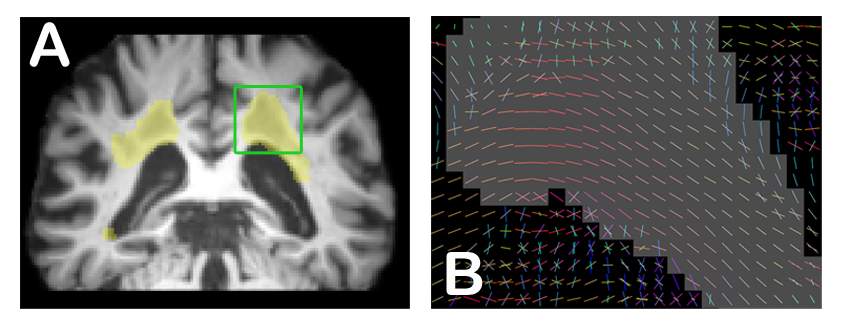
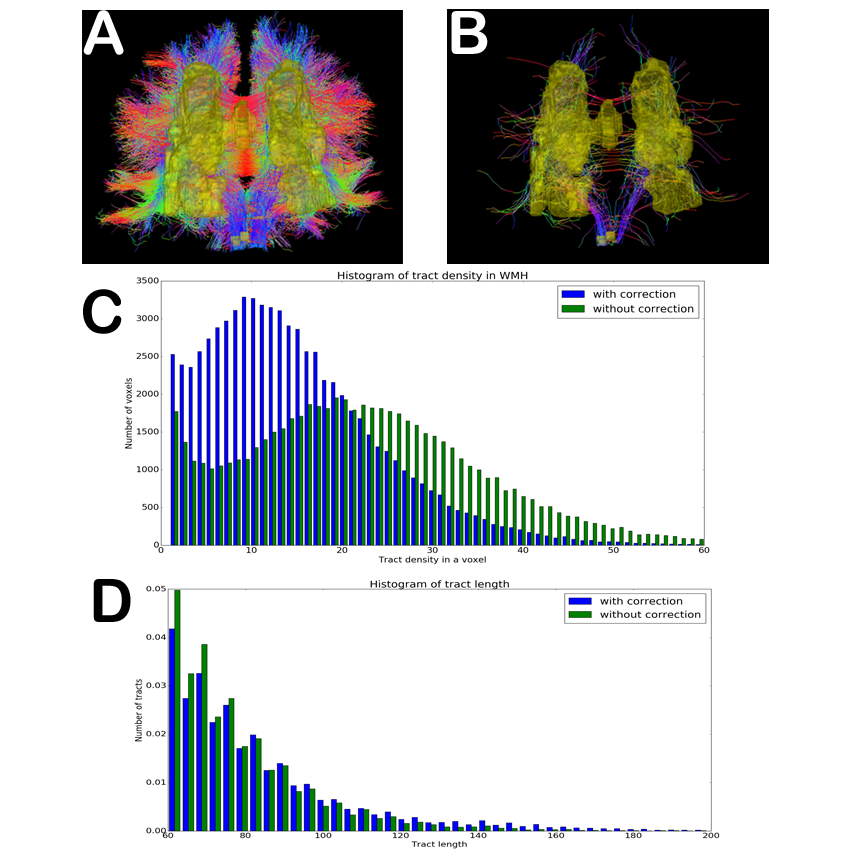
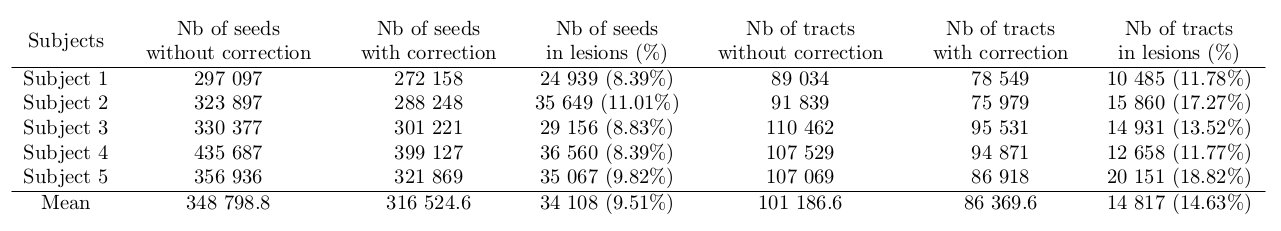
We notice that the principal fODF direction is preserved (Figure 2) under hyperintensity masks and that tractography should be allowed to explore these regions. Figures 3A and 3B show erroneous streamlines that start or finish in WMH masks, with and without mask correction. We see far less erroneous streamlines with mask correction. Figure 3C shows important difference in streamline density in WMH between both tractograms, which highlight that with mask correction, there is a large amount of streamlines able to traverse the lesion masks. Figure 3D shows the difference of streamlines length and shows that there are more long range connections (> 60mm) with mask correction. Finally, Table 1 highlights some differences between tractography with and without tracking mask correction. First, when accounting for proper lesion masks, 9.51% of seeds are deleted (34,108 false seeds on a total of 348,799 seeds) and there are 14.63% less streamlines (14,817 false streamlines on a total of 101,186).Discussion
A common way to seed tractography is thresholding the FA10. This is problematic for aging diffusion MRI studies because the FA decreases dramatically in regions of WMH and thus, the tractography is forbidden to explore the white-matter structure before it even started tracking. This can lead to erroneous seeds and broken streamlines in regions of hyperintensities11. Other studies12,13 have used tractography on different brain pathologies aging. To bypass the lesion problem in Multiple Sclerosis, studies decided to set manually a seeding mask12,13 and use target masks12, which are manually intensive, dependent on the expert neuroanatomist and very hard to deploy on large cohorts. Here, we show that given a good lesion mask segmentation, one should fill the white matter mask and make sure WMH do not appear in the GW or WM-GM interface masks. This is a critical step to seed and apply tractography with anatomical constraints9,14.Conclusion
White matter hyperintensities have an impact on fiber tracking masks, which impact the quality of the whole tractogram and will impact connectivity and connectome studies. However, principal fiber ODF directions under the lesion masks seem to be preserved and coherent, and hence, the tractography algorithm should be allowed to explore them and should be allowed to stop in them. The non-correction of tracking masks or the tractography based on thresholding FA could lead to approximately 15% erroneous streamlines, which are false connections that can mislead interpretations. The next step is to include more subjects and quantify the impact of WMH on the brain connectivity in aging studies.Acknowledgements
No acknowledgement found.References
[1] F.-E. de Leeuw et al., “Prevalence of cerebral white matter lesions in elderly people: a population based magnetic resonance imaging study. The Rotterdam Scan Study,” J Neurol Neurosurg Psychiatry, vol. 70, no. 1, pp. 9–14, Jan. 2001.
[2] A. Pelletier et al., “Age-Related Modifications of Diffusion Tensor Imaging Parameters and White Matter Hyperintensities as Inter-Dependent Processes,” Front. Aging Neurosci, p. 255, 2016.
[3] C. Bernard et al., “Time course of brain volume changes in the preclinical phase of Alzheimer’s disease,” Alzheimer’s & Dementia: The Journal of the Alzheimer’s Association, vol. 10, no. 2, p. 143–151.e1, Mar. 2014.
[4] F. Fazekas, J. B. Chawluk, A. Alavi, H. I. Hurtig, and R. A. Zimmerman, “MR Signal Abnormalities at 1.5 T in Alzheimer’s Dementia and Normal Aging,” AJNR Am J Neuroradiol, vol. 8, no. 3, pp. 421–426, May 1987.
[5] W. D. Penny, K. J. Friston, J. T. Ashburner, S. J. Kiebel, and T. E. Nichols, Statistical Parametric Mapping: The Analysis of Functional Brain Images. Academic Press, 2011.
[6] P. Schmidt et al., “An automated tool for detection of FLAIR-hyperintense white-matter lesions in Multiple Sclerosis,” NeuroImage, vol. 59, no. 4, pp. 3774–3783, Feb. 2012.
[7] J.-D. Tournier, F. Calamante, and A. Connelly, “Robust determination of the fibre orientation distribution in diffusion MRI: non-negativity constrained super-resolved spherical deconvolution,” Neuroimage, vol. 35, no. 4, pp. 1459–1472, May 2007.
[8] E. Garyfallidis et al., “Dipy, a library for the analysis of diffusion MRI data,” Front. Neuroinform, vol. 8, p. 8, 2014.
[9] G. Girard, K. Whittingstall, R. Deriche, and M. Descoteaux, “Towards quantitative connectivity analysis: reducing tractography biases,” Neuroimage, vol. 98, pp. 266–278, Sep. 2014.
[10] A. N. Voineskos et al., “Age-related decline in white matter tract integrity and cognitive performance: a DTI tractography and structural equation modeling study,” Neurobiol. Aging, vol. 33, no. 1, pp. 21–34, Jan. 2012.
[11] O. Ciccarelli, M. Catani, H. Johansen-Berg, C. Clark, and A. Thompson, “Diffusion-based tractography in neurological disorders: concepts, applications, and future developments,” Lancet Neurol, vol. 7, no. 8, pp. 715–727, Aug. 2008.
[12] E. Martínez-Heras et al., “Improved Framework for Tractography Reconstruction of the Optic Radiation,” PLoS ONE, vol. 10, no. 9, p. e0137064, 2015.
[13] A. Klistorner, C. Wang, C. Yiannikas, S. L. Graham, J. Parratt, and M. H. Barnett, “Progressive Injury in Chronic Multiple Sclerosis Lesions Is Gender-Specific: A DTI Study,” PLoS ONE, vol. 11, no. 2, p. e0149245, 2016.
[14] R. E. Smith, J.-D. Tournier, F. Calamante, and A. Connelly, “Anatomically-constrained tractography: Improved diffusion MRI streamlines tractography through effective use of anatomical information,” NeuroImage, vol. 62, no. 3, pp. 1924–1938, Sep. 2012.
Figures