3487
White Matter Fiber Tractography with Fiber Ball Imaging1Medical University of South Carolina, Charleston, SC, United States
Synopsis
An investigation into the minimum b-value necessary to characterize the fiber orientation density function (fODF) with fiber ball imaging (FBI) for white matter fiber tractography (WMFT) is presented. Using high angular resolution diffusion imaging (HARDI) data, we assessed the angular difference between principal directions across b-values using a high b-value benchmark, as well as the number of fiber crossings based on fODF peak detection. WMFT was performed using the reconstructed fODFs and was viewed qualitatively. Overall, the results indicated convergence near b = 4000 s/mm2 suggesting this to be the minimum b-value needed for FBI-WMFT.
Introduction
Q-ball imaging (QBI) is based on the observation that the Funk transform of single b-value shell high angular resolution diffusion imaging (HARDI) data provides an approximation for a diffusion orientation distribution function (dODF).1 This dODF is able to resolve intravoxel fiber crossings and has been widely applied for white matter fiber tractrography (WMFT). Recently, it has been shown that the inverse Funk transform of single shell HARDI data yields an estimate for a fiber orientation density function (fODF), provided a sufficiently large b-value is employed.2 This method is known as fiber ball imaging (FBI). The FBI fODF will typically have a higher sensitivity and resolving power than the corresponding dODF from QBI, and therefore can potentially be the basis of improved WMFT. Here we investigate the dependence of the FBI fODF on b-value in the human brain, as well as the corresponding WMFT, to determine the minimum b-value needed for applying this method.Methods
HARDI data were collected from two healthy subjects on a 3T Siemens Trim Trio scanner. Each dataset consisted of a non-diffusion weighted (b = 0) volume (20 excitations/slice) and six b-value shells having b-values of 1000, 2000, 3000, 4000, 5000, and 6000 s/mm2 with 128 diffusion encoding directions per shell. Other imaging parameters were: number of slices = 40, TE = 149 ms, TR = 7200 ms, and voxel size = 3X3X3 mm3. Using in-house Matlab scripts, fODFs for each shell were calculated from the inverse Funk transform, and WMFT was generated with a deterministic fiber tracking algorithm. The b = 6000 s/mm2 shell was used a benchmark, since the accuracy of FBI is expected to improve with increasing b-values.2 Conventional diffusion metrics were calculated using diffusional kurtosis estimator3 with the b = 0, 1000 and 2000 s/mm2 shells. White matter voxels were defined as those with a fractional anisotropy exceeding 0.2. Quantitative analysis included the average angular difference over all white matter voxels between the principal fODF direction (as identified by the largest fODF peak) for each b-value relative to the principal fODF direction for b = 6000 s/mm2, as well as the number of detected fiber directions per voxel for each b-value. For each b-value, the number of fiber directions found inside each white matter voxel were binned into three groups: single, double and multiple (>2) direction voxels. Finally, a qualitative comparison was performed of the fODFs and the corresponding FBI-based tractography across b-values in regions that are known to have a high density of crossing fibers. DSIstudio4 was used to depict the fODFs and for plotting the fiber tracks.Results
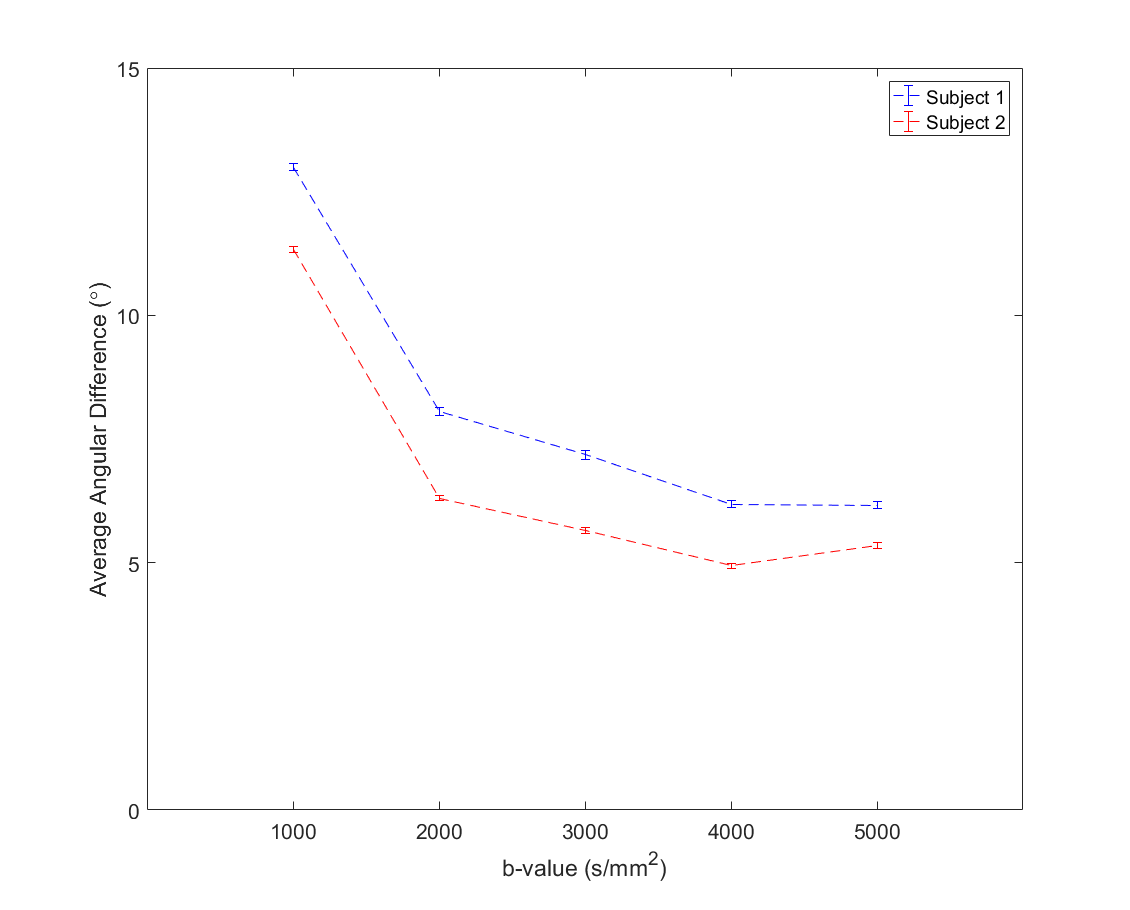
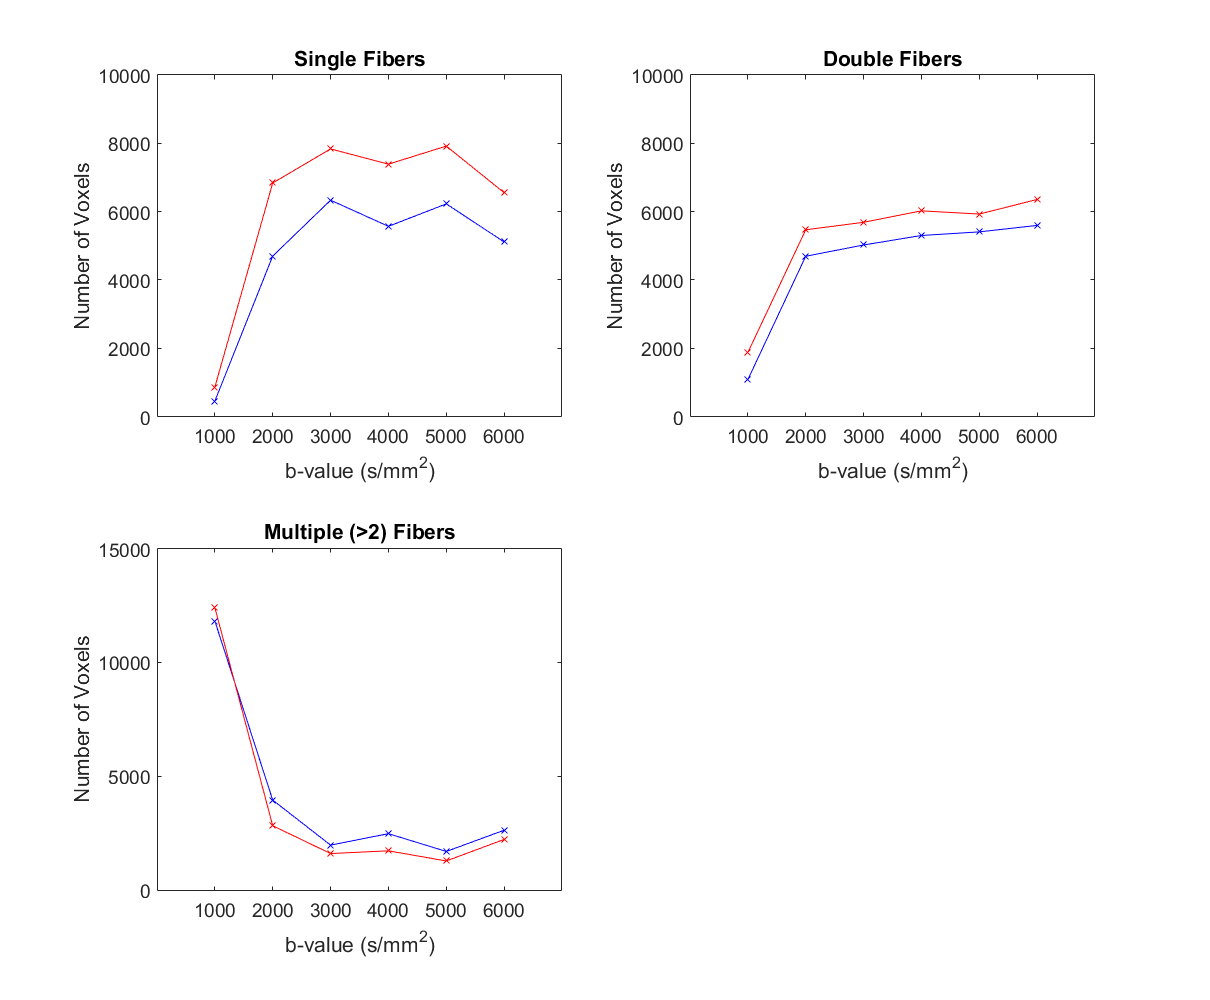
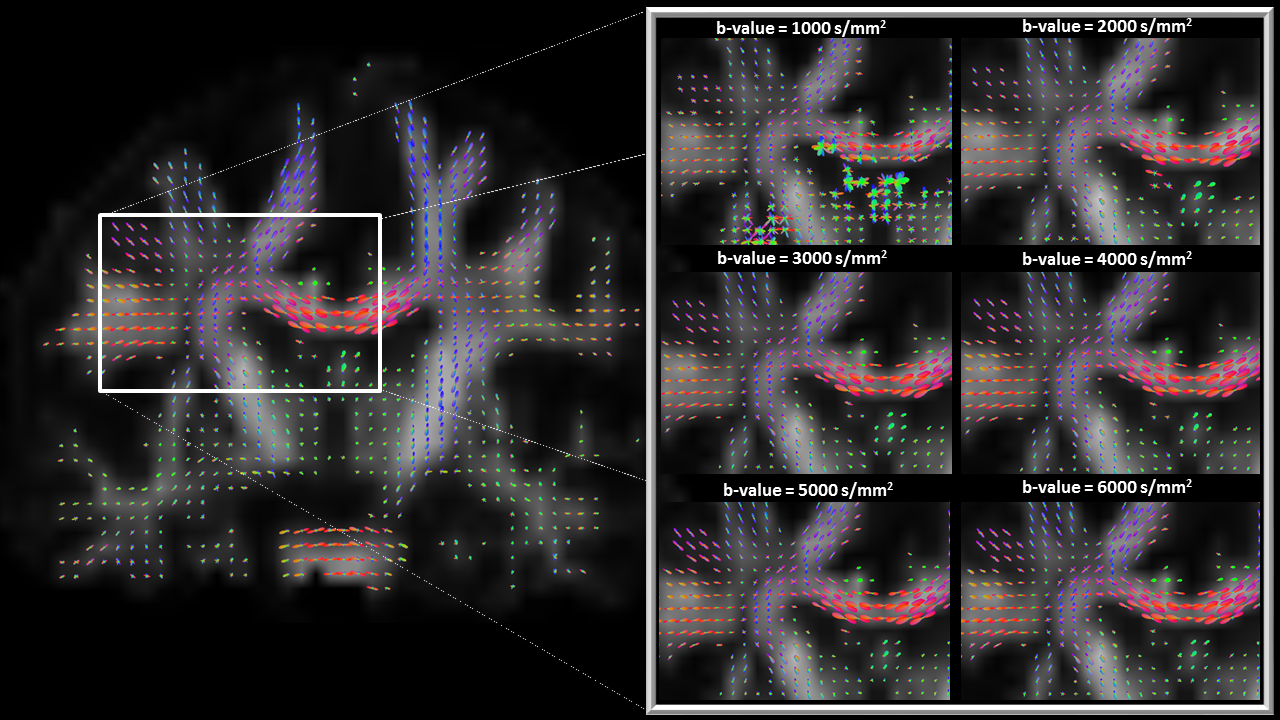
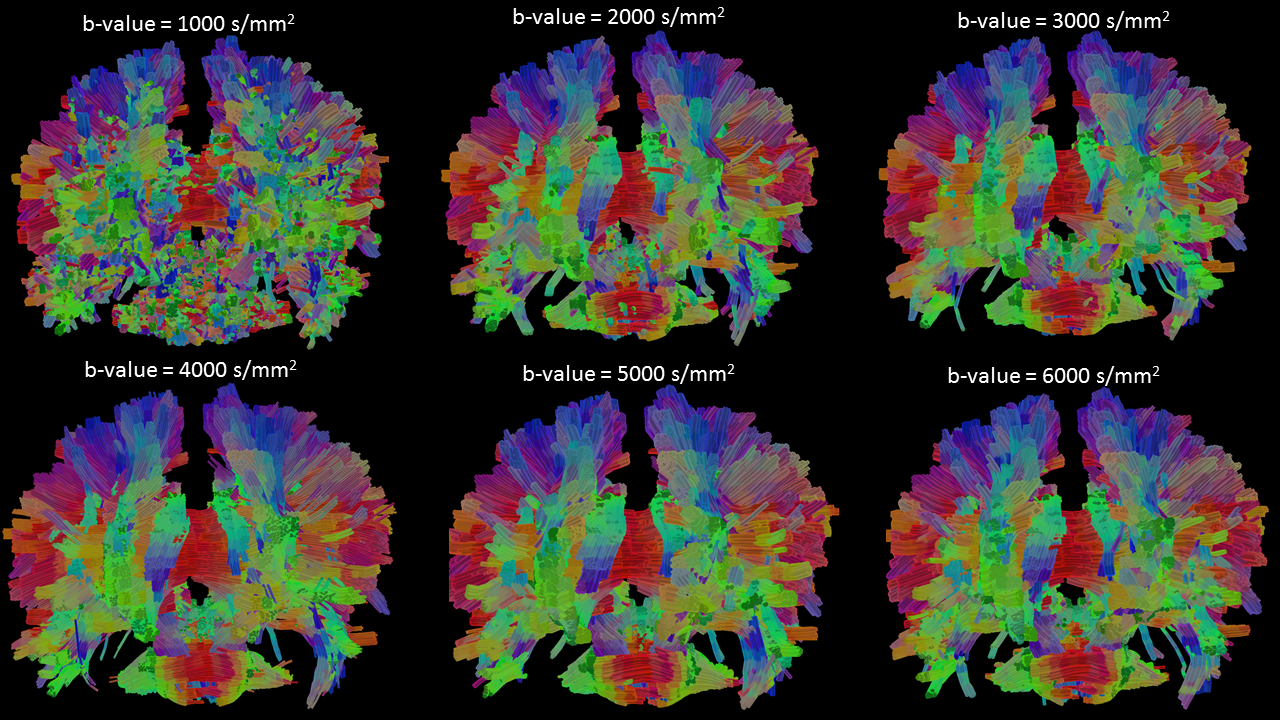
In both subjects, the smallest angular differences occurred for b = 4000 and 5000 s/mm2, with a steady increase as the b-value was lowered below b = 4000 s/mm2 (Fig. 1). The number of fiber crossings detected was relatively unchanged for all the shells with b ≥ 3000 s/mm2, while the b = 1000 s/mm2 shell showed a large number of multiple fiber crossings likely due to the effect of signal noise which is more prominent at lower diffusion weightings (Fig. 2). Visually, the fODFs all look quite similar for b ≥ 4000 s/mm2 (Fig. 3). For b ≤ 3000 s/mm2, some striking differences become apparent in the fODFs relative to those for the higher b-values. Similar trends may be seen for the FBI-based fiber tracks shown in Fig. 4 with subtle changes between b = 3000 s/mm2 and b = 4000 s/mm2.Discussion
Theoretically, the accuracy of FBI is expected to improve with increasing b-value, and the fODFs should eventually converge for sufficiently high b-values. Our results are in accord with this prediction. In particular, the number of fiber crossings as shown in Fig. 2 and the qualitative comparisons of Figs. 3 and 4 give consistent results for b ≥ 4000 s/mm2. Moreover, the quantitative comparison in Fig. 1 of the principal fiber directions relative to the directions for b = 6000 s/mm2 showed the smallest differences for b ≥ 4000 s/mm2, which presumably reflects higher accuracy and better resolving power of FBI. This suggests b = 4000 s/mm2 as a reasonable minimum b-value for FBI-based fiber tractography. This same criterion has also been proposed for FBI based on an independent analysis.5 In summary, FBI-based fiber tractography appears to be feasible for b-values greater than or equal to about b = 4000 s/mm2.Acknowledgements
No acknowledgement found.References
1. Tuch DS. Q-ball imaging. Magn Reson Med. 2004;52(6):1358-1372.
2. Jensen JH, Russell Glenn G, Helpern JA. Fiber ball imaging. Neuroimage. 2016;124(Pt A):824-833.
3. Tabesh A, Jensen JH, Ardekani BA, Helpern JA. Estimation of tensors and tensor-derived measures in diffusional kurtosis imaging. Magn Reson Med. 2011;65(3):823-836.
4. Yeh FC, Wedeen VJ, Tseng WY. Generalized q-sampling imaging. IEEE Trans Med Imaging. 2010;29(9):1626-35.
5. McKinnon ET, Jensen JH, Glenn, GR, Helpern, JA. Dependence on b-value of the direction-averaged diffusion-weighted imaging signal in brain. Magn Reson Imaging. 2016; online ahead of print.
Figures