3486
Prediction vision recovery of Neuromyelitis optica spectrum disorders (NMOSDs) with multivariate pattern analysis: a DTI study1radiology department, Chinese PLA General Hospital, beijing, People's Republic of China, 2Key Laboratory of Molecular Imaging, Institute of Automation, Chinese Academy of Sciences, 3School of Mechanical, Electrical & Information Engineering, Shandong University
Synopsis
To explore if a DTI protocol could provide a model to predict the degree of vision recovery in NMOSDs patients. 37 patients were employed in the study, including 20 patients of well vision recovery and 17 patients of poor vision recovery. With the diffusion measure of multiple white and grey matters as features, a Lasso-Logistic regression model and a Support Vector Machine (SVM)-based classification model were constructed. The results show area under curve (AUC) of 0.7618 (P=0.008) and accuracy (ACC) of 0.7297 (0.006). The method shows promising prediction performance, and it has the potential to improve the clinical treatment design.
Introduction
NMOSDs are severe autoimmune inflammatory condition of the central nervous system (CNS), typically causing blindness-causing optic neuritis (ON). Thus, prediction of the degree of visual recovery in NMOSDs patients has important significance in design treatment plan. However, no reliable methods have yet been identified. In comparison of different imaging methods, DTI appears to be the most reliable and sensitive method for brain damage detection in NMOSDs.1 The pathological process of demyelination in the optic nerves contributes significantly to visual impairment, but optic nerve DTI is influenced by its small size and artifacts of around structures.2 Although the visual pathway were explored by using DTI and demonstrated to have some correlation with vision recovery,3 but it is believed that demyelination of the optic nerve follows the compromise of the blood brain barrier and more extensive grey and white matter damage were involved. Whether there are radiological features in other regions of brain except visual pathways that contribute to degree of recovery has not been well studied. Our objective was to explore if a short imaging protocol (<6 minutes), implemented with standard hardware, could provide a useful in vivo imaging model to help predict the degree of vision recovery in NMOSDs-ON patients.Methods
Patients fulfilling diagnostic criteria for NMOSDs accompanying with ON were recruited. All patients are AQP4 antibody-seropositive. Patients' visual acuity (VA) was scored as demonstrated by Wingerchuk et al.(1999).4 Patients received high-dose methylprednisolone as recommended by Wingerchuk and Weinshenker (2014)5 and Toosy et al. (2014) 6. These patients were followed up clinically within the next 6 months to assess vision recovery. Patients with VA score increasing at least 3 points were classified to be well recovered, and patients with no VA increase or increased less than 3 points were classified to be poor recovered. Thereby, 37 NMOSDs-ON Patients were employed in the current study, including 20 patients of well vision recovery and 17 patients of poor vision recover. MRI scanning was performed on a 3-T MR scanner (Discovery750, GE Healthcare) with 32-channel head coil. The main sequence is a single-shot echo planar imaging DTI sequence. Diffusion parameters, including fractional anisotropy (FA), mean diffusivity (MD), axial diffusion (AD), radial diffusion (RD), averaged in 24 white matter tracts and grey matter which related to the disease were obtained individually. With the totally 96 diffusion measure as features, a Lasso-Logistic regression model was employed to select the features most contributed to well recovery and poorly recovery groups. Subsequently, the prediction model of Support Vector Machine (SVM)-based classification model were constructed with the selected features and we can add the selected features to the model to prediction.Results
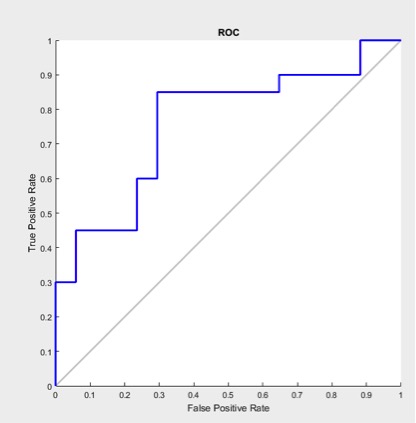
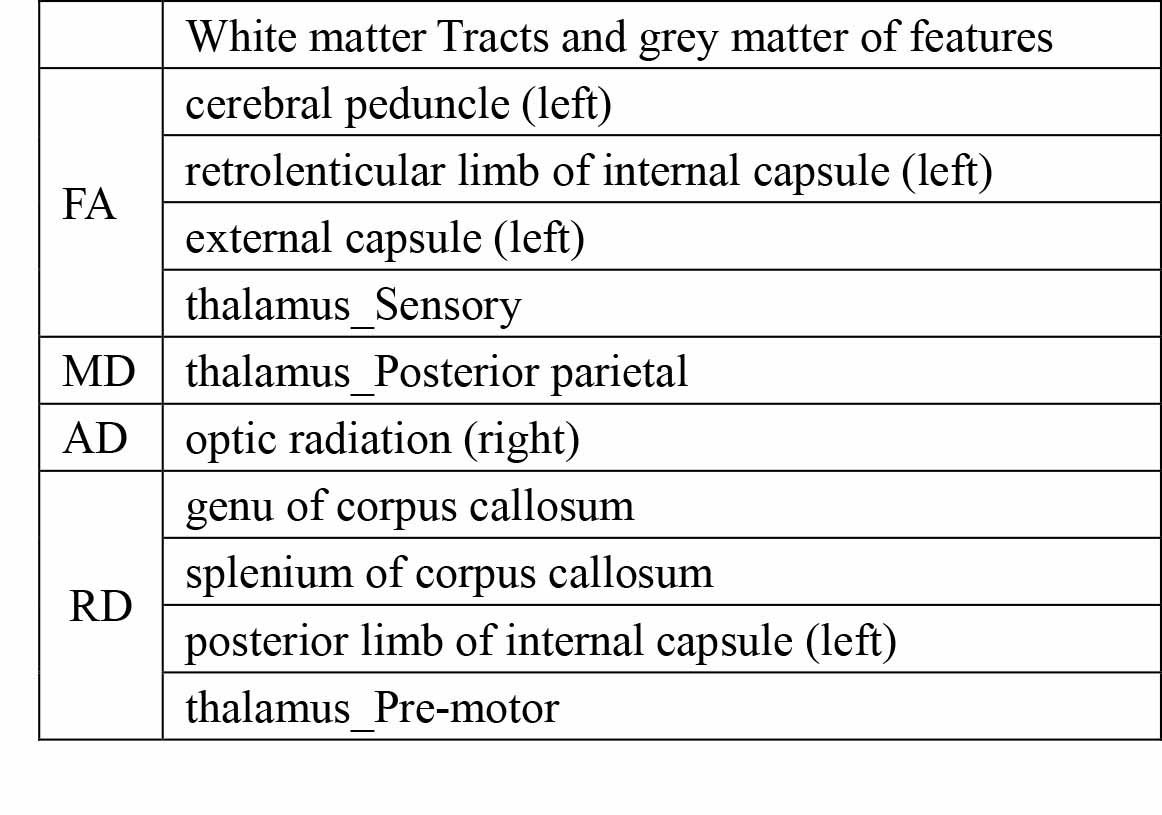
A Lasso-Logistic regression model employed to select the features most contributed to well recovery and poor recovery classification. The selected 11 features were as follows: FA of left cerebral peduncle , left retrolenticular limb of internal capsule , left external capsule and thalamus_sensory. MD of thalamus_posterior parietal. AD of thalamus_posterior parietal. RD of genu of corpus callosum, splenium of corpus callosum, left posterior limb of internal capsule and Thalamus_pre-motor ( Table 1). The receiver operating characteristic curve (ROC) curve was plotted and demonstrated in Fig.1. Area Under Curve (AUC) of 0.7618 (P=0.008) and accuracy (ACC) of 0.7297 (0.006) were obtained by leave-one-out cross validation. The P values were acquired with 500 permutations.Discussion
In the present study, we used multivariate pattern analysis with brain DTI parameters to predict the vision recovery in NMOSDs patients. We found 11 features that have strongly correlation with the degree of vision recovery. Hereby, the prediction model of SVM-based classification was constructed with the selected features. Previous study focused on DTI parameters between patients and healthy people7 and used DTI measurements of white matter tract integrity in the visual pathways to predicted vision acuity.8 This is the first study to report DTI parameters from more extensive correlative grey and white matter by SVM-based classification model, yet accurate predictive vision recovery of AUC of 0.7618 (P=0.008) and ACC of 0.7297 (0.006). A promising classification method has been suggests that multiple region influenced vision recovery besides visual pathways.Conclusion
The present study may provide us with promising method to combine more extensive features of brain DTI for vision recovery prediction, thus, it has crucial significance in formulate a treatment scheme. Further study should aim at the NMOSDs patients who during the new onset to decrease a selection bias of relapsing times, disease duration. This would allow for evaluation brain damage of NMOSDs-ON in more detail.Acknowledgements
No acknowledgement found.References
1. F. Pache, H. Zimmermann, C. Finke, et al. Brain parenchymal damage in neuromyelitis optica spectrum disorder – A multimodal MRI study. Eur Radiol?. 2016 Mar 24. [Epub ahead of print]
2. Smith SA, Williams ZR, Ratchford JN, et al. Diffusion Tensor Imaging of the Optic Nerve in Multiple Sclerosis: Association with Retinal Damage and Visual Disability. AJNR Am J Neuroradiol. 2011 Oct;32(9):1662-8.
3. Raz N, Bick AS, Ben-Hur T, Levin N2. Focal demyelinative damage and neighboring white matter integrity: an optic neuritis study. Mult Scler. 2015 Apr;21(5):562-71.
4. Wingerchuk, D.M., Hogancamp, et al. The clinical course of neuromyelitis optica (Devic's syndrome). Neurology. 1999 Sep 22;53(5):1107-14.
5. Wingerchuk, D.M., Weinshenker, et al. Neuromyelitis optica (Devic's syndrome). Handb. Clin. Neurol. 2014.122, 581–599.
6. Toosy, A.T., Mason, et al. Optic neuritis. Lancet Neurol. 2014.13, 83–99.
7. Rueda Lopes FC, Doring T, Martins C, et al. The role of demyelination in neuromyelitis optica damage: diffusion-tensor MR imaging study.Radiology. 2012 Apr;263(1):235-42.
8. Naismith RT1, Xu J, Tutlam NT, et al. Radial diffusivity in remote optic neuritis discriminates visual outcomes. Neurology. 2010 May 25;74(21):1702-10.
Figures