3484
Hyper-connectivity of the Seizure Onset Zone: A Potential Epilepsy Biomarker at 7T1Radiology, Icahn School of Medicine at Mount Sinai, New York, NY, United States, 2Wake Forest University, Winston-Salem, NC, United States, 3Neurology, Icahn School of Medicine at Mount Sinai, New York, NY, United States
Synopsis
The present study aims to identify the connectivity of the seizure onset zone (SOZ) in patients with MRI-negative epilepsy. Motivated by recent findings of aberrant white matter structure in epilepsy we hypothesized differences in structural connectivity. To test this we compared structural connectivity in a group of 8 epilepsy subjects and 8 healthy controls. We also investigated differences in connectivity in SOZ and non-SOZ areas in the epilepsy group. Hyper-connectivity was found in epilepsy subjects compared to controls. Additionally, hyper-connectivity was found in SOZ compared to non-SOZ related regions. These findings may have implications for diagnosis and surgical intervention in MRI-negative epilepsy.
PURPOSE
Locating the seizure onset zone (SOZ) in non-lesional epilepsy patients can be challenging with current clinical approaches. Epileptic seizures result from hyper-excited and overly-synchronous neuronal firing in the cerebral cortex [1]. This hyper-activity originates in the SOZ, and propagates to adjacent regions via white matter fibers [1] . Previous investigations of epileptic seizures have found both hyper and hypo-connectivity between various brain regions, however conclusive evidence of altered connectivity of the suspected SOZ in MRI-negative patients has not yet been identified [2]. Given recent findings of aberrant white matter structure in non-lesional epilepsy we hypothesize that differences in structural connectivity [3,4]. Here, we compare structural connectivity of eight non-lesional epilepsy patients and 8 healthy controls using 7T MRI. METHODS
8 healthy control subjects and 8 epilepsy patients without lesions on clinical MRI scans were scanned using a 7T whole body scanner (Siemens Magnetom) under an approved IRB protocol. The MRI protocol consisting of a T1-weighted MP2RAGE sequence (0.7 mm isotropic resolution) and high-angular-resolved diffusion-weighted dMRI (1.05 mm isotropic resolution, 68 directions). Diffusion-weighted images were corrected for distortions and registered to T1-weighted images.
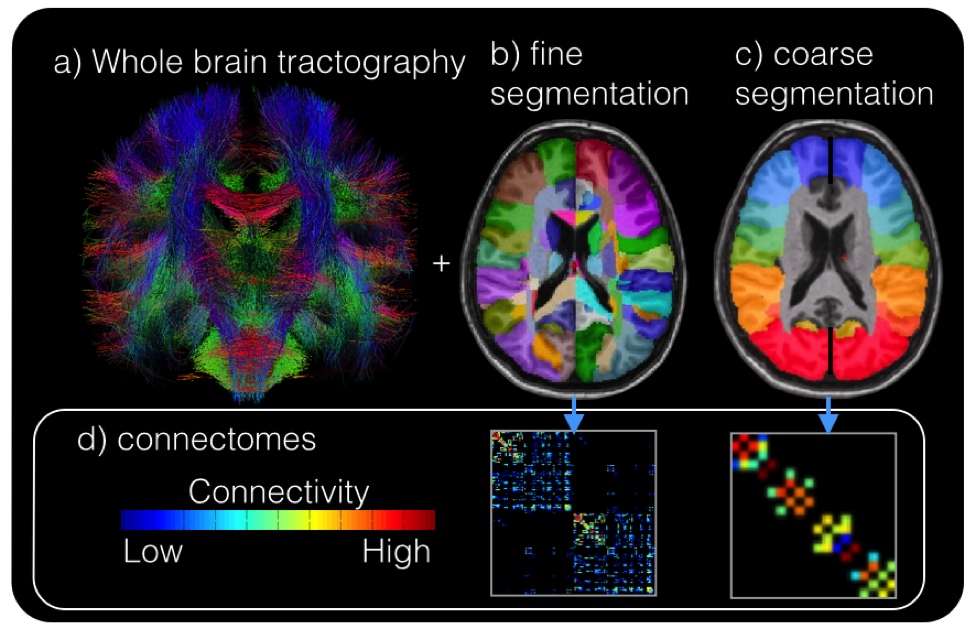
Cortical and subcortical segmentations were obtained using FreeSurfer software (http://freesurfer.net/). Whole brain tractography (Figure 1a) was performed using spherical deconvolution and the iFOD2 [5] algorithm and SIFT in MRTRIX3 to obtain 10,000,000 fibers. Structural connectivity matrices were calculated by counting tracks connecting each region in the FreeSurfer segmentation (Figure 1b). Because suspected SOZ are identified on a very coarse scale (often by lobe) the structural connectivity matrix (Figure 1d) was resampled onto a coarser segmentation (Figure 1c) consisting of the following 18 regions (9 per hemisphere): Superior Frontal, Mid-Frontal, Inferior Frontal, Pre-central, Post-central, Superior Parietal, Temporal Parietal, Temporal, and Occipital.
A normative connectivity map was computed by averaging the connectivity maps of the 8 healthy controls. As an initial assessment of aberrant connectivity, for each epilepsy subject, regions 2 or more standard deviations (SD) from the normative connectivity matrix (edgewise) were identified (Figure 1).
For subjects with epilepsy, suspected SOZ was determined by experienced neurologists. In order to compare connections in the suspected SOZ for each subject, regions in the SOZ were grouped together and compared to all other regions. Connectivity values were normalized to the normative distribution by z-score to remove region variations in connectivity. The mean connectivity of all the SOZ regions and non-SOZ regions were computed for each epilepsy subject and compared using a paired t-test.
RESULTS/DISCUSSION
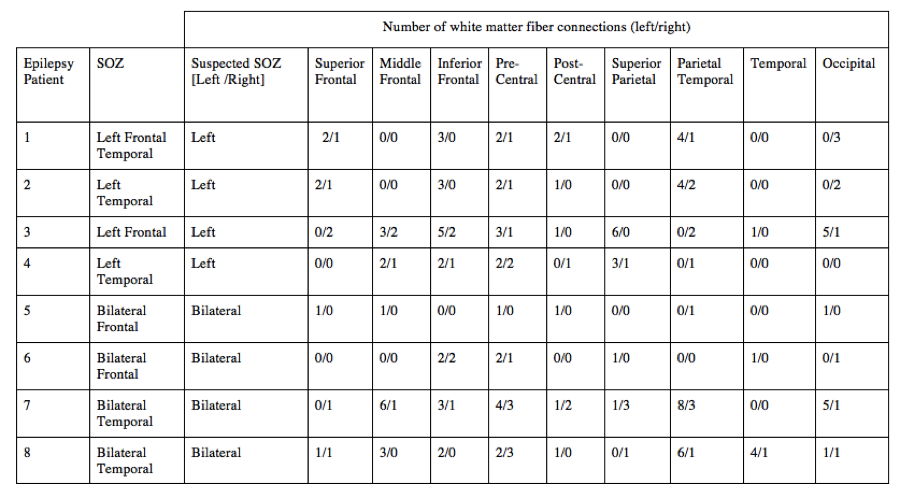
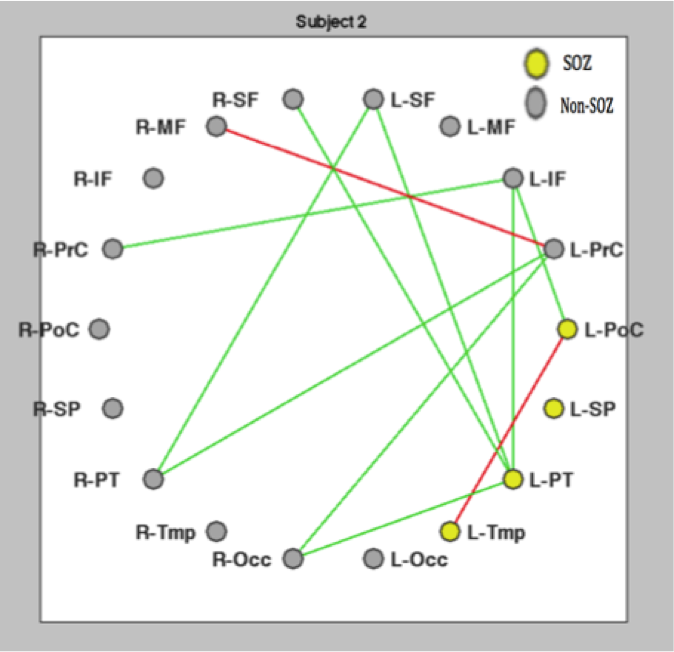
Table 1 quantifies the location and number of hyper-connected nodes (greater than 2 SD above the mean) for the eight epilepsy subjects. Connectivity diagrams, example in Figure 2, show the same data as Table 1 but in graphical form for one exemplary subject. Note the left parietal-temporal region (L-PT, Figure 2) in the seizure onset zone with 4 hyper-connections (Table 1, row 2, 3rd to last column). Overall, there were regions of increased connectivity in all eight epilepsy subjects as shown by the prevalence of hyper-connections. Notably, there were no nodes with connectivity densities that differed from the average controls by two or more SD for any of the control subjects. This is consistent with previous studies that have linked seizure activity to increases in white matter fiber volume in the brain.2 The mean number of hyper-connected nodes in the suspected seizure onset zone for the eight epilepsy subjects (M= 1.604, SD= 1.156), was significantly greater than the mean number of hyper-connections to the regions not associated with the suspected SOZ (M=0.978, SD=0.626), p= 0.047.
CONCLUSIONS
In non-lesional epilepsy patients, nodes in the suspected SOZ were found to be hyper-connected compared non-SOZ regions. The findings in this study may have implications for diagnosing and treating patients with MRI-negative epilepsy, especially those that are also refractory to pharmacological intervention. Future work will increase the total number of subjects analyzed in this experiment.Acknowledgements
FUNDING- NIH R00 NS070821-03, NIH R01 CA202911 and the TMII seed funds.References
1. Elshoff L, Muthuraman M, Anwar AR, Deuschl G, Stephani U, et al. (2013) “Dynamic Imaging of Coherent Sources Reveals Different Network Connectivity Underlying the Generation and Perpetuation of Epileptic Seizures”. PLoS ONE 8(10): e78422.
2. Ji GJ, Zhang Z, Xu Q, Zang YF, Liao W, Lu G (2014) Generalized tonic-clonic seizures: aberrant interhemispheric functional and anatomical connectivity. Radiology 271(3):839–847.
3. Goc J, Hartl E, Noachtar S, et al. DTI Analysis of U-fibre density images localises the epileptogenic zone better than FA or MD. In Proceedings of Annual Meeting of OHBM 2016; p. 3166.
4. RL O’Halloran, R Feldman, L Marcuse, M Fields, B Delman, S Frangou, P Balchandani. U-Fiber Quantification for Assessment of Focal, Non-Lesional Epilepsy with 7T Diffusion- Weighted MRI. Submitted to Neuroimage Clinical 11-7-2016. NICL-16-583. Under Review.
5. Tournier J, Calamante F, Connelly A. Improved probabilistic streamlines tractography by 2nd order integration over fibre orientation distributions. In: Proc. 18th Annual Meeting of the Intl. Soc. Mag. Reson. Med.(ISMRM) 2010. p.1670.
Figures