3482
Hemispheric asymmetries and grey matter projections of the arcuate fasciculus: an along-tract study of diffusion and localization properties with deterministic and probabalistic tractography1Department of Biomedical and NeuroMotor Sciences, University of Bologna and Functional MR Unit, Policlinico S. Orsola - Malpighi, Bologna, Italy, 2Department of Physics and Astronomy, University of Bologna, Italy, 3Centro Enrico Fermi, Roma, Italy
Synopsis
We studied the arcuate fasciculus in both cerebral hemispheres in 29 healthy subjects, by evaluating GM projections and along-tract diffusion properties and tract curvature, obtained with three tractography methods: probabilistic ball-and-sticks model, deterministic and probabilistic spherical deconvolution. In all subjects we detected the arcuate in both hemispheres. For all the tractography methods we measured a bigger tract volume on the left, but detected more tracts branching towards GM terminations on the left only with the probabilistic methods, that influenced both the tract curvature and its diffusion parameters. The probabilistic tractography methods better described arcuate connectivity, which is more complex in the left hemisphere.
Introduction
The arcuate fasciculus (AF) is a white matter (WM) tract of the fronto-parietal-temporal network. Post-mortem and MRI studies show that the AF mainly connects the frontal Broca’s area for language production, and the temporal Wernicke’s area for its comprehension1. Most AF studies are focused on the left hemisphere, given its typical linguistic dominance, however the right AF is also involved in some linguistic tasks and could play an important role in linguistic recovery after left hemisphere damage2.Methods
29 healthy subjects (F/M= 14/15, age [mean±sd]= 38±18 y) underwent a standardized brain MRI protocol (1.5T GE scanner), including T1-weighted volumetric and DW imaging (TR=10 s, b=900 s/mm2, 7 volumes with null b-value, 64 diffusion gradient directions , voxel=1.25x1.25x3 mm3). Tractography was performed using: probabilistic ball-and-sticks (BS) model3, deterministic and probabilistic spherical deconvolution (SD) 4. Tractographic ROIs were drawn in the MNI-152 space, localizing the seed in the WM underlying the angular gyrus5 and targets in the frontal and temporal lobe grey matter (GM) (Harvard-Oxford probabilistic atlas, th=25%). AF connectivity distributions were thresholded at 10% with respect to maximum of connectivity. Along-tract statistics were restricted to the portion of the tract before its branches towards GM terminations. The AF was divided in fifteen segments by parameterizing the monotonic increase along the longest geodesic distance (Fig1, top). For this purpose, we evaluated the second eigenvector of the Laplacian matrix, calculated on the thresholded tract mesh surface6. For each segment, diffusion parameters and centroid coordinates (x,y,z) were evaluated. A non-parametric paired test, the Wilcoxon signed-rank, was used for left-right comparisons, with a significant level set at p<0.05 and corrected by the FDR (False Discovery Rate) method for multiple comparisons.Results
We were able to track the AF in both the hemispheres in all subjects with all the three tractography methods, obtaining different results (Fig2). However, we excluded three subjects from the deterministic SD statistics, for whom the right AF did not survive thresholding. Whole tract (Tab1) and along-tract statistics (Fig3) showed hemispheric asymmetries for all methods, in AF volume and diffusion parameters. The AF tract volume increased using probabilistic rather than deterministic tractography. Regarding centroid coordinates, the AF had a greater curvature in the right temporal lobe compared to the left; this difference was found with all tractography methods. In the frontal tract portion of the AF, however, segment centroids were more inferiorly located on the left; this difference was only found by the probabilistic methods (Fig4)Discussion
AF identification is frequently suboptimal, especially using deterministic methods, likely due to the presence of crossing fibers, which are more present in the right hemisphere7,8. However, post mortem fiber dissection studies show that the AF is present in both hemispheres9. In our study, we were able to perform AF tractography with all three tractography methods in both hemispheres of every subject. As expected, the AF volume changed with the method employed, according to the ability of each to resolve crossing fibers. The hemispheric differences in diffusion parameters and tract localization reflect AF shape differences between hemispheres (Fig1, bottom), depending in part on how the AF reaches its GM terminations. The lower FA in the left hemisphere reflects the presence of the tract branching towards the superior temporal gyrus BA22 and the more inferiorly located GM terminations (middle temporal gyrus BA21, fusiform gyrus BA37, the inferior temporal gyrus BA20). The BA22 AF projections are well detected by the probabilistic SD method (Fig2, bottom) and could explain both the lower left FA and the different AF curvature across the hemispheres. Moreover, the more inferior localization of the frontal AF segment centroids on the left hemisphere, found with the probabilistic methods, reflects the presence of a lateral branch towards premotor cortex BA6, located posteriorly to the inferior frontal gyrus BA 44-45.Conclusion
These results are in agreement with other probabilistic tractography studies that extend the classical Broca’s and Wercnicke’s areas to others GM terminations and that also consider right hemisphere AF connectivity10. To our knowledge, this is the first study that quantitatively mapped the geometry of the AF tract and compared different algorithms using along-tract statistics. This tractography approach, especially probabilistic SD, could be integrated with fMRI analysis, as it allows the evaluation of GM terminations and hemispheric differences.Acknowledgements
No acknowledgement found.References
1. Dick AS, Tremblay P. Beyond the arcuate fasciculus: consensus and controversy in the connectional anatomy of language. Brain. 2012 Dec;135(Pt 12):3529-50.
2. Forkel SJ, Thiebaut de Schotten M, Dell'Acqua F, Kalra L, Murphy DG, Williams SC, Catani M. Anatomical predictors of aphasia recovery: a tractography study of bilateral perisylvian language networks. Brain. 2014 Jul;137(Pt 7):2027-39.
3. Behrens TE, Woolrich MW, Jenkinson M, Johansen-Berg H, Nunes RG, Clare S,Matthews PM, Brady JM, Smith SM. Characterization and propagation of uncertainty in diffusion-weighted MR imaging. Magn Reson Med. 2003 Nov;50(5):1077-88.
4. Tournier JD, Calamante F, Connelly A. MRtrix: Diffusion tractography in crossing fiber regions. International Journal of Imaging Systems and Technology 2012 Mar; 22 (1): 53–66.
5. Giorgio A, Watkins KE, Chadwick M, James S, Winmill L, Douaud G, De Stefano N,Matthews PM, Smith SM, Johansen-Berg H, James AC. Longitudinal changes in grey and white matter during adolescence. Neuroimage. 2010 Jan 1;49(1):94-103.
6. Chung MK, Seo S, Adluru N, Vorperian HK. Hot Spots Conjecture and Its Application to Modeling Tubular Structures. Mach Learn Med Imaging. 2011 Sep;7009:225-232.
7. Catani M, Allin MP, Husain M, Pugliese L, Mesulam MM, Murray RM, Jones DK. Symmetries in human brain language pathways correlate with verbal recall. ProcNatl Acad Sci U S A. 2007 Oct 23;104(43):17163-8.
8. Chen JL, Kumar S, Williamson VJ, Scholz J, Griffiths TD, Stewart L. Detection of the arcuate fasciculus in congenital amusia depends on the tractography algorithm. Front Psychol. 2015 Jan 21;6:9.
9. Martino J, De Witt Hamer PC, Berger MS, Lawton MT, Arnold CM, de Lucas EM, Duffau H. Analysis of the subcomponents and cortical terminations of the perisylvian superior longitudinal fasciculus: a fiber dissection and DTI tractography study. Brain Struct Funct. 2013 Jan;218(1):105-21.
10. Rilling JK, Glasser MF, Preuss TM, Ma X, Zhao T, Hu X, Behrens TE. The evolution of the arcuate fasciculus revealed with comparative DTI. Nat Neurosci. 2008 Apr;11(4):426-8.
Figures
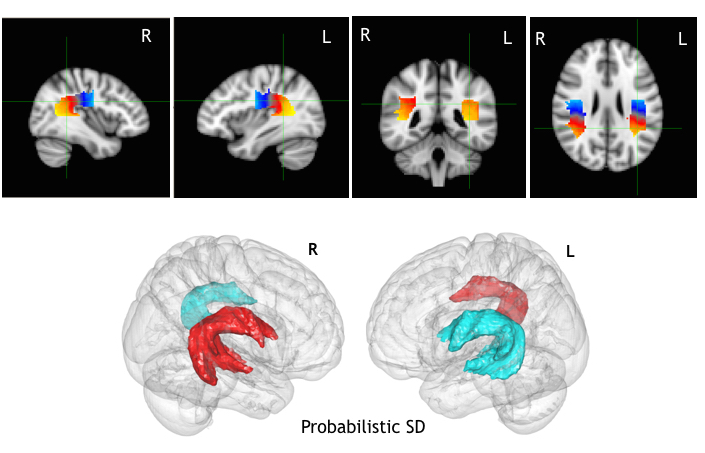
Fig 1
Top: anatomical projections of the along-tract AF division for the probabilistic SD tractography on the MNI-152 brain. Scale intensity from blue=1st segment to yellow 15th segment. In the image the mean value across the subjects of the AF segmentation is shown. Bottom: Group variability mesh surface for the left (blue) and right (red) AF, thresholded at 20% of the subjects and displayed on the on the MNI-152 brain.
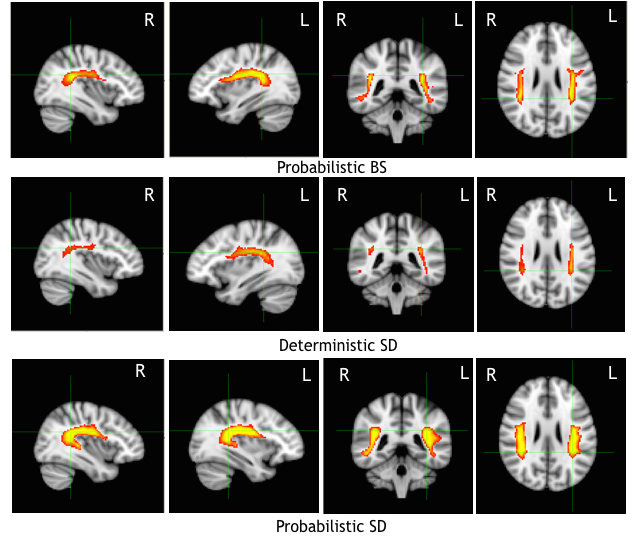
Fig 2
Group variability (GV) maps across subjects thresholded at 20% of the subjects and displayed on the MNI-152 brain. The intensity scale represents the percentage of communality of the AF across subjects, the maximum (yellow) is reached when all the subjects share that AF results. Top: GV map of probabilistic BS. Middle: GV maps of deterministic SD. Bottom: GV of probabilistic SD.
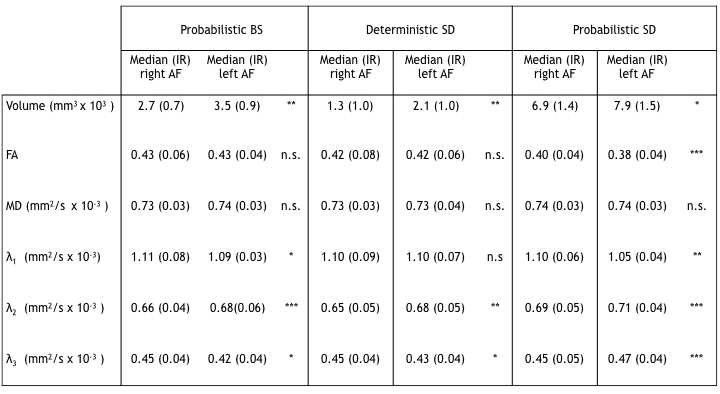
Tab 1
Wilcoxon signed rank test results comparing the right and left AF tractography results, for the three proposed algorithms: probabilistic BS, deterministic and probabilistic SD. In the table the volume and diffusion parameter median and interquartile range (IR) values for the right and left AF are shown, with the associated p-value: n.s. not significant, * p-value < 0.05, ** p-value < 0.01 , *** p-value < 0.001 .
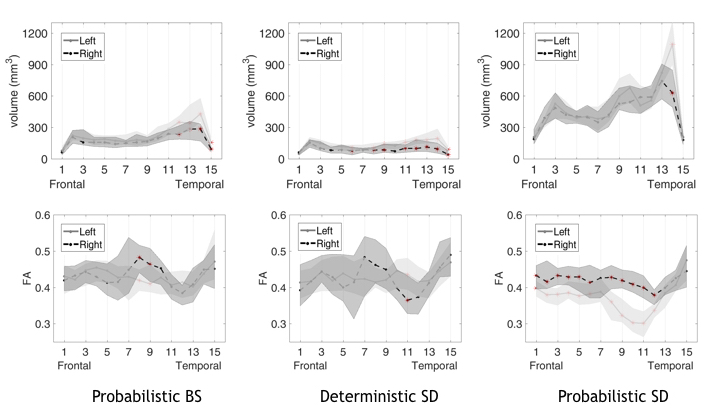
Fig 3
Volume and FA along-tract statistics. In the plot the median values and interquartile range are reported as a shaded area,for the different tractography methods. The red asterisks mark significant left-right differences after the FDR correction. Tract volume was greater on the left mostly in the temporal portion. FA values were lower on the left with respect to right: in the parietal tract portion with the probabilistic BS, in most of the AF segments with probabilistic SD. On the contrary, the deterministic SD algorithm measured a lower FA on the right only in one segment of the parietal-temporal portion.
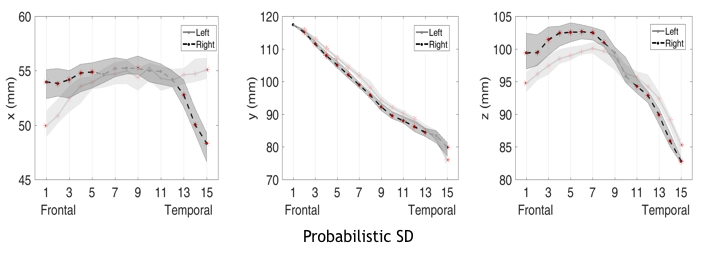
Fig 4
Along-tract mapping of the AF segment centroids, evaluated for the probabilistic SD tractography. In the plots the right and left AF results are shown; red asterisks mark significant left-right differences after FDR correction. The x-coordinate is orientated lateral-midsagittal symmetrically for the left and right hemisphere, the y-coordinate anterior-posterior, the z coordinate superior-inferior.