3481
Visualizing White Matter Fiber Tracts of the Human Brain in Augmented Reality: Initial Experience with the Microsoft HoloLens1Bernard and Irene Schwartz Center for Biomedical Imaging, Center for Advanced Imaging Innovation and Research, Department of Radiology, New York University School of Medicine, New York, NY, United States
Synopsis
The objective of this study was to create a workflow to view 3D fiber tracts derived from diffusion spectrum imaging (DSI) in augmented reality (AR) and to test the application of visualizing tractography models in AR. Visualizing tractography in AR may allow for enhanced comprehension of the connectivity in the brain which could impact patient care and management.
Introduction
DSI is a useful magnetic resonance imaging (MRI) technique that can be used to characterize the three-dimensional (3D) diffusional displacement of water molecules in a model-free approach.1,2 3D fiber tracts may be generated using DSI or other diffusion MRI methods. The resulting fiber tracts are typically presented on a two-dimensional (2D) display that cannot effectively show depth information. Augmented Reality (AR) is an exciting technology that may help to overcome these limitations by allowing the user to visualize 3D data in the real world. The purpose of this study was 1) to create a workflow to visualize fiber tracts derived from DSI in the Microsoft HoloLens, an AR headset capable of rendering 3D holograms in the real world and 2) to perform an initial evaluation of the added value of visualizing the 3D fiber tracts in AR to the clinical workflow.Methods
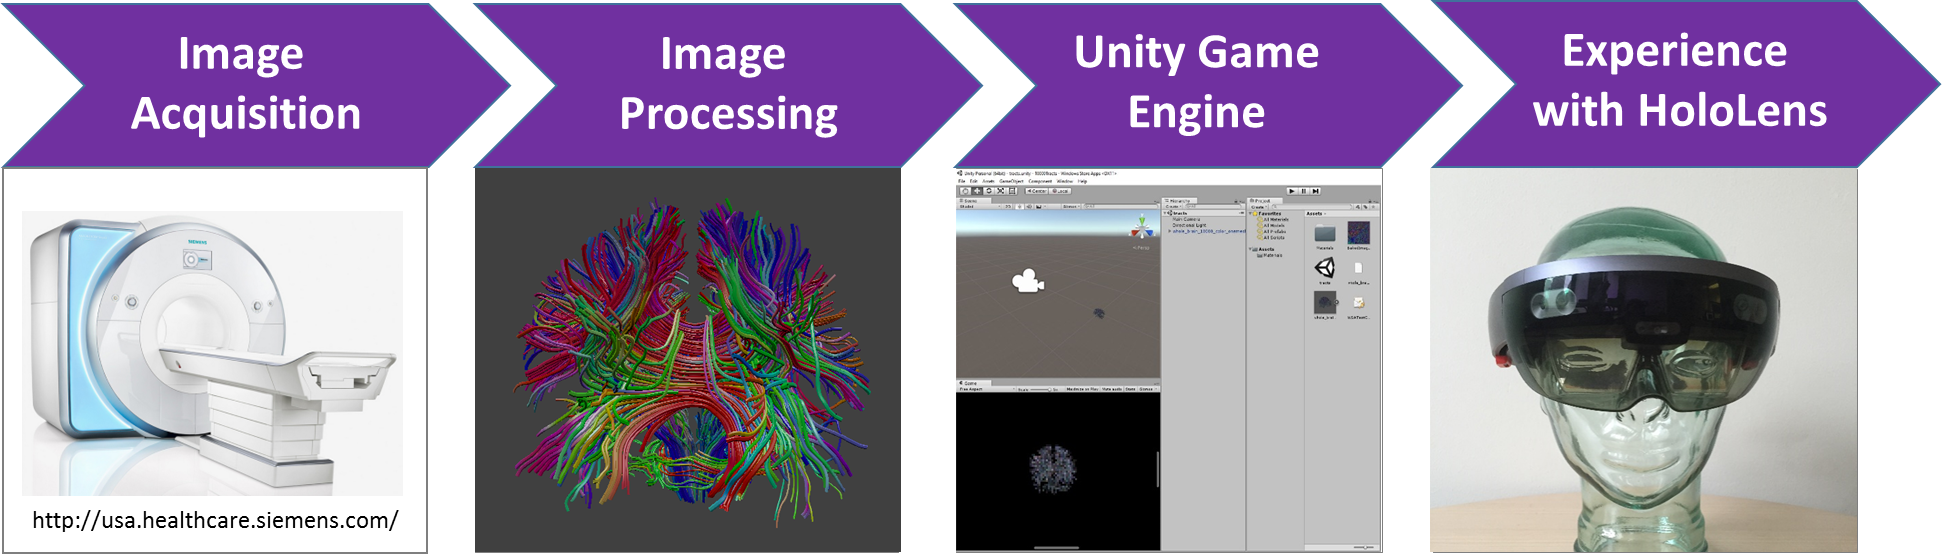
DSI was performed in one healthy brain on a clinical 3T scanner (Skyra, Siemens, Erlangen) with a 32-channel head coil using a radially symmetric q-space sampling scheme (RDSI).3 A single-shot twice refocused spin echo sequence4 was used with the following sequence parameters: bmax -4000s/mm2, TE/TR=114/2600ms, 2.2mm3 resolution, field of view 220 x200mm, 60 slices, parallel imaging (2x GRAPPA) and multiband acceleration of two5, one b0 acquisition, one average, 10:49min. Fiber tracts were generated with a modified streamline tracking algorithm as implemented in DSI Studio (http://dsi-studio.labsolver.org, 1000 tracts, uniformly distributed seed points). A 3D surface mesh with embedded color maps was generated using a custom made script (Python) in Blender (http://www.blender.org). The mesh was then exported in .obj format so that it could be imported directly into the Unity game engine, version 5.4 (Unity Technologies, San Francisco, CA, USA). The model was finally deployed into the Microsoft HoloLens headset for viewing in AR. An outline of the process used to produce the virtual fiber tracts is shown in Figure 1. Fiber tracts were evaluated by two experienced radiologists and three magnetic resonance physicists with expertise in diffusion imaging. Questions regarding which method of viewing was preferred and whether the HoloLens model would be helpful for surgical planning were asked.Results
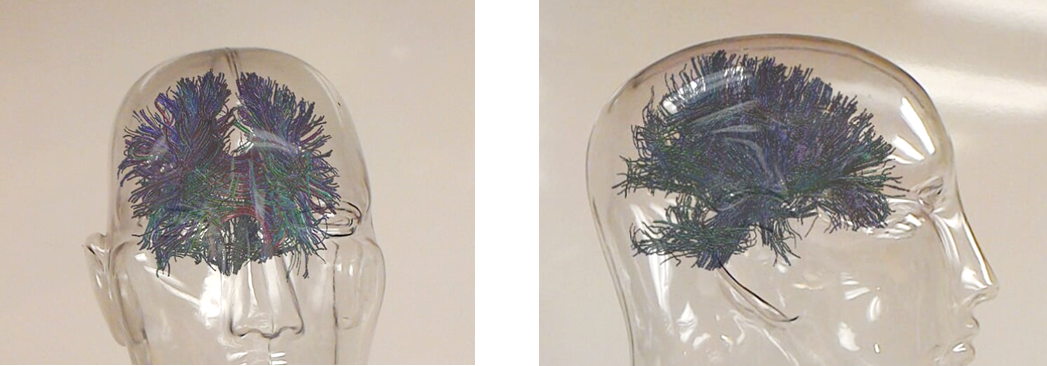
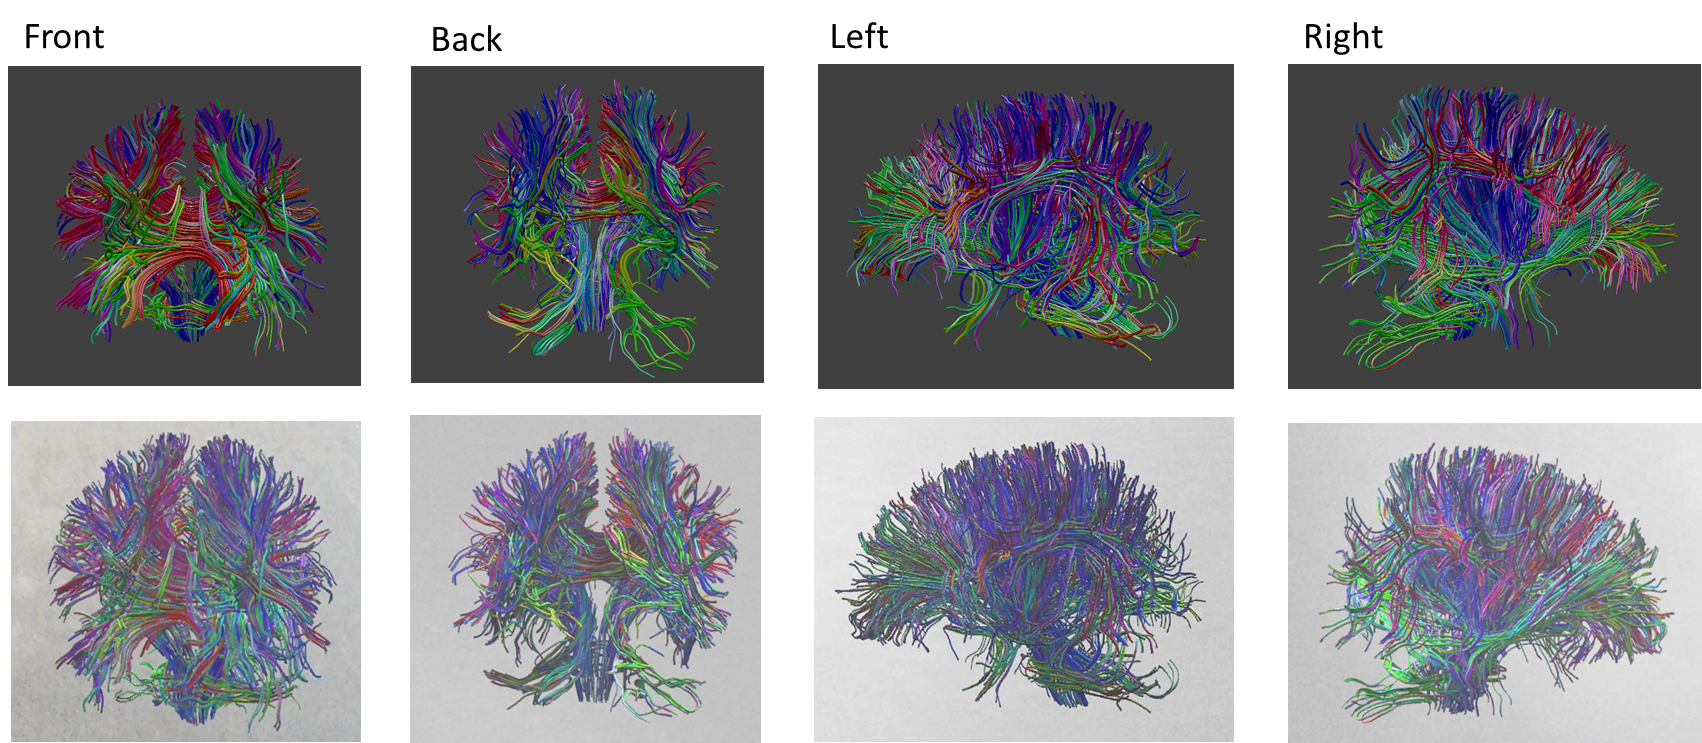
Our developments have permitted stereoscopic 3D exploration of white matter fiber tracts in AR using the Microsoft HoloLens (Figure 2). The AR model permitted a good visual match to the original 3D surface mesh (Figure 3). A short video of the AR fiber tracts is shown in Figure 4. For the model evaluation, four out of five (80%) of the reviewers preferred the AR model over the computer model. In addition, all believed that the AR model would be helpful for surgical planning due to the advanced 3D spatial visualization and ability to view from different angles.Discussion
We have developed a method to visualize DSI tractography in AR using the Microsoft HoloLens. Our results suggest that visualization of white matter fiber tracts in AR facilitates navigation through the complex fiber tract models, thus helping to gain better insight in the connectivity in the brain.Conclusion
This study demonstrates that it is feasible to create 3D models of fiber tracts that can be implemented and viewed in AR. Visualization in AR provides physicians and surgeons with a more realistic depiction of the anatomy and may have great impact in surgical planning and navigation.Acknowledgements
This work was supported by the Center for Advanced Imaging Innovation and Research (www.cai2r.net), a NIBIB Biomedical Technology Resource Center (NIH P41 EB017183).References
1. Callaghan PT. Principles of nuclear magnetic resonance microscopy. Oxford: Oxford University Press; 1993.
2. Wedeen VJ, Hagmann P, Tseng WY, Reese TG, Weisskoff RM. Mapping complex tissue architecture with diffusion spectrum magnetic resonance imaging. Magn Reson Med. 2005; 54:1377-1386.
3. Baete SH, Yutzy S, Boada FE. Radial q-Space Sampling for DSI. Magn Reson Med. 2016;76:769-780.
4. Reese TG, Heid O, Weisskoff RM, Wedeen VJ. Reduction of eddy-current-induced distortion using a twice-refocused spin echo. Magn Reson Med. 2003;49:177-182.
5. Setsempop K, Cohen-Adad J, Gagoski BA, Raij T, Yendiki A, Keil B, Wedeen VJ, Wald LL. Improving Diffusion MRI using simultaneous multi-slice echo planar imaging. Neuroimage. 2012;63:569-580.
Figures