3480
REPRODUCIBILITY OF GRAPH METRICS ESTIMATED FROM ALTERNATIVE STRATEGIES OF NETWORK WEIGHTING:EVIDENCES FROM REPEAT MRI SCANS1SCHOOL OF MEDICINE, Institute of Psychological Medicine and Clinical Neurosciences, Cardiff University School of Medicin, CARDIFF, United Kingdom, 2SCHOOL OF MEDICINE, Cardiff University Brain Research Imaging Center (CUBRIC), School of Psychology, Cardiff University, Cardiff, United Kingdom, CARDIFF, United Kingdom, 3SCHOOL OF PSYCHOLOGY, Cardiff University Brain Research Imaging Center (CUBRIC), School of Psychology, Cardiff University, Cardiff, United Kingdom, CARDIFF, United Kingdom, 4SCHOOL OF PSYCHOLOGY, CARDIFF, United Kingdom
Synopsis
ABSTRACT
Introduction:
Structural brain networks constructed from diffusion MRI (dMRI) have been demonstrated in both healthy and disease groups. However, few studies have addressed the problem of the reliability of network metrics extracted from the structural brain networks. Complementary, different weighting strategies can be followed to weight the strength of connection between two ROIs. Here, we presented a test-retest reliability approach of network metrics over ten different network-weighting strategies based on repeat dMRI scans. Additionally, we quantified the recognition accuracy of the identification of each each subject over the cohort for each of the ten scenarios.
Methods
Participants
All participants were recruited through the School of Psychology, Cardiff, Wales, UK. All participants were undergoing or had previously completed a university degree course, were right handed as assessed with the Edinburgh Handedness Inventory3 and of Caucasian origin. Exclusion criteria were a current episode or a history of neurological and psychiatric disorders, drug or alcohol abuse and medication that may have an impact on the structure of the brain. For assessment, the general health questionnaire was used4 .
Structural MRI scanning
T1-weighted structural scans were acquired using an oblique axial, 3D fast-spoiled gradient recalled sequence (FSPGR) with the following parameters: TR=7.9 ms, TE=3.0 ms, inversion time=450 ms, flip angle=20°,1 mm isotropic resolution, with a total acquisition time of approximately 7 min.
Diffusion MRI scanning
High angular resolution diffusion-weighted imaging (HARDI) data were acquired in the Cardiff University Brain Research Imaging Centre (CUBRIC) on a 3T GE Signa HDx system (General Electric, Milwaukee, USA). For further details of the MRI protocol see6.
Proposed Network Weighting Schemes and Network Analysis
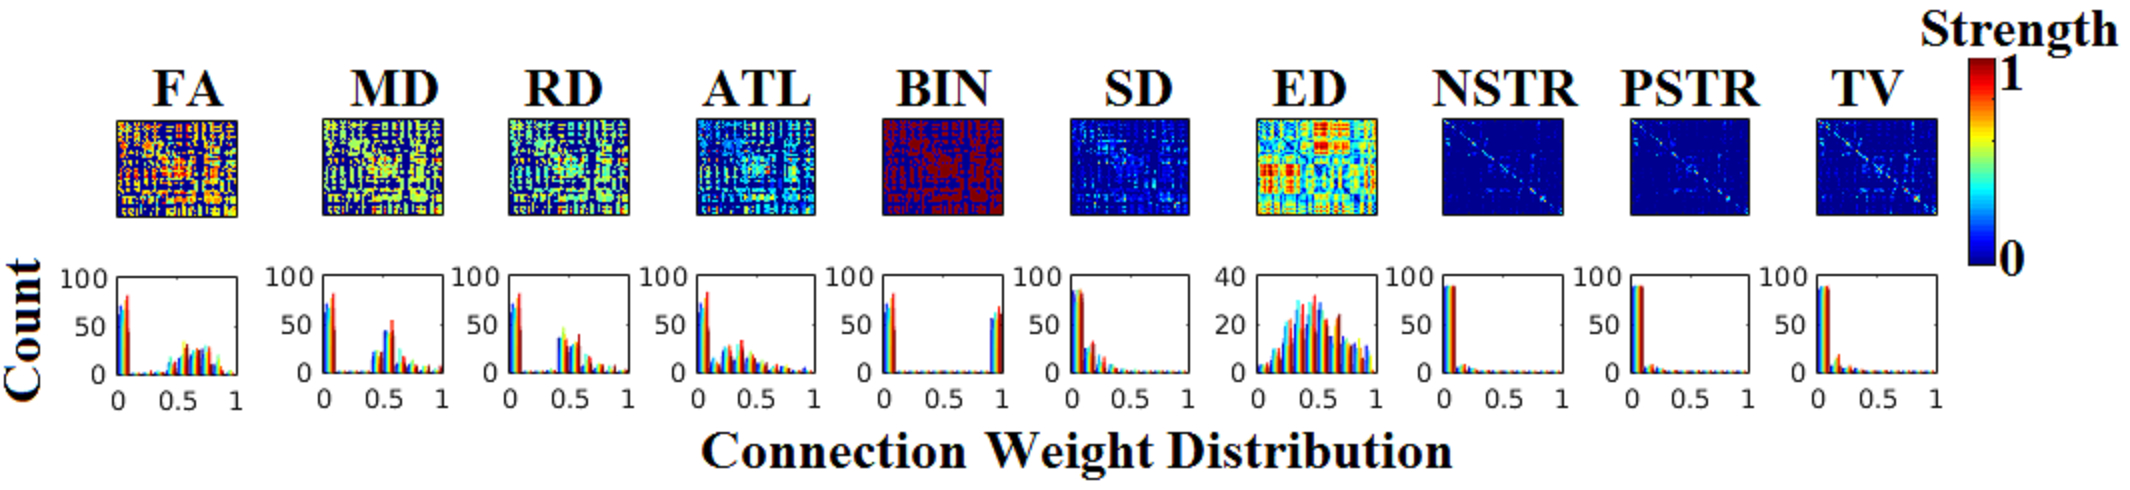
To evaluate the reliability of graph metrics, we constructed structural brain networks from five repeat scans of five healthy volunteers by using deterministic tractography with the damped Lucy-Richardson algorithm7 (step size = 0.5mm, angle threshold = 35°, seed point resolution = 2mm2, length threshold=30~500mm, FOD threshold = 0.05). Connectivity was inferred between cortical regions of the automated atlas labelling (AAL-90) atlas8 For each network, ten dMRI-derived metrics were used for edge weights: (1) Fractional anisotropy (FA); (2) mean diffusivity (MD); (3) radial diffusivity (RD); (4) average tract length (ATL); (5) binary (BIN); (6) streamline density (SD) (7) Euclidian distance (ED); (8) number of streamlines (NSTR); (9) percentage of streamlines (PSTR); (10) tract volume (TV).
Reliability of Network Metrics
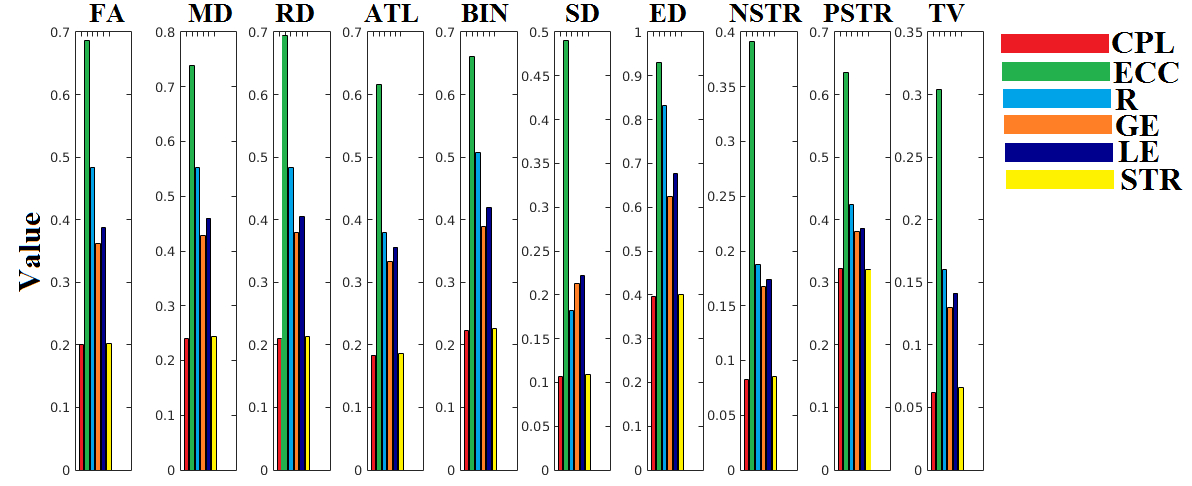
We investigated how network topology over the ten versions of a structural brain networks decreased the within variation across repeat scans. In each case, we quantified characteristic network metrics from each scan and we quantified reliability of basic six graph-theoretic measures using the intraclass correlation coefficient (ICC)1. Since these measures are an essential prerequisite for more complex analyses, their reliability is crucial to the ultimate interpretation of such networks.
Recognition Accuracy
Based on structural brain networks, we followed a multi-class classification scheme based on the tensorial treatment of brain networks with main scope to predict each subject over the rest using leave one out cross-validation scheme (LOOCV) 2.
Results:
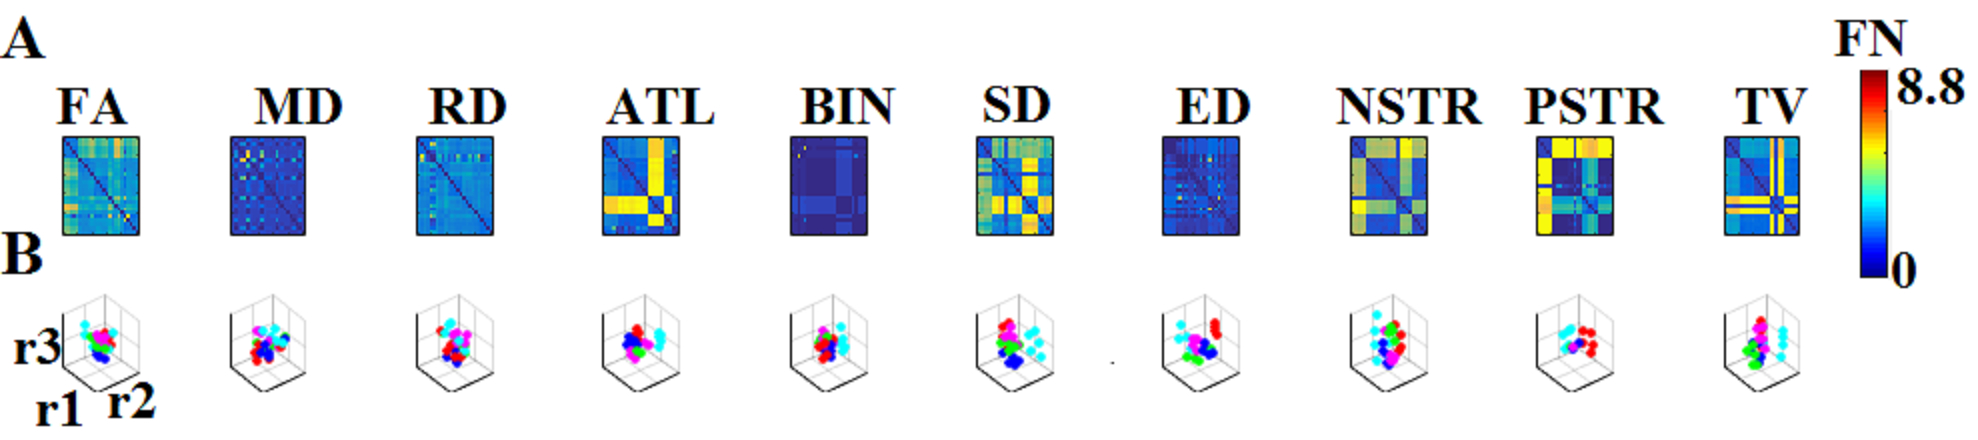
An exemplar of structural brain network over ten different network weighting strategies is presented in Fig.1. Using Frobenius norm as a similarity index applied to the laplacian transformations of structural brain networks across the subjects and scans (5 x 5), we demonstrated the similarity matrices of the whole cohort for each of the ten network weighting strategies (Fig.2A). Additionally, we embedded this similarity matrices in a common 3D space using multidimensional scaling (Fig.2B).
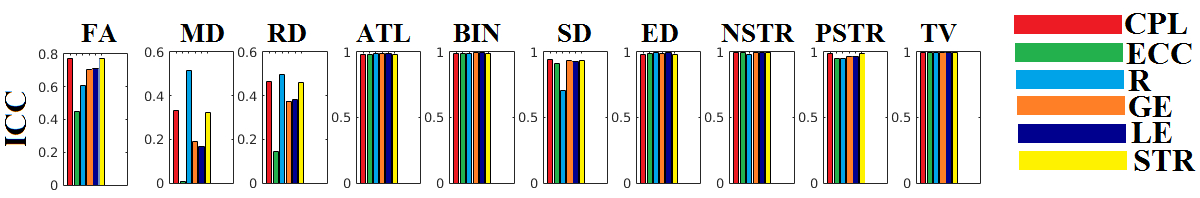
Our findings revealed seven network weighting strategies out of ten (ATL,BIN,SD,ED,NSTR,PSTR and TV) based on the ICC estimates on six network metrics. Structural networks based on FA,MD and RD failed to reveal high ICC. For those seven different versions of a structural weighted brain network, ICC scores for the size network metrics was higher > 0.95 (Figure 3). The multi-class classification performance demonstrated high recognition accuracy for NSTR PSTR and TV.
Conclusion:
Our results highlight concerns regarding the reliability of network metrics extracted from various network weighting strategies. We demonstrated very high ICC for seven out of ten network weighting strategies based on the adopted network metrics., but importantly – when using DTI-based metrics (FA, MD, RD) the ICC is lower. Recognition accuracy of the identification of each subject over the rest was absolute (100%) for number and percentage of streamlines and tract volume.
Acknowledgements
This study was supported by the National Centre for Mental Health (NCMH) at Cardiff University, with funds from the National Institute for Social Care and Health Research (NISCHR), Welsh Government, Wales (Grant No. BR09) and the B. Braun Stiftung, Germany, by a Wellcome Trust Investigator Award (to DKJ) and the Swiss National Science Foundation (SNF) (T.B., grant number PBBEP3_144797.References
References
1.Buchanan, C.R.; Pernet, C.R.; Gorgolewski, K.J.; Storkey, A.J.; Bastin, M.E. Test-retest reliability of structural brain networks from diffusion MRI. NeuroImage 2014:86;231–243.
2.Dimitriadis SI, Sun Y,Kwok K,Laskaris NA,Thakor N,Bezerianos A. Cognitive workload assessment based on the tensorial treatment of EEG estimates of cross-frequency phase interactions. Ann Biomed Eng. 2015 Apr;43(4):977-89.
3.Oldfield RC (1971) The assessment and analysis of handedness: the Edinburgh inventory. Neuropsychologia 9(1):97–113
4.Goldberg D, Huxley P (1980) Mental illness in the community: the pathway to psychiatric care. Tavistock Publications, London
5.Jones DK, Horsfield MA, Simmons A (1999) Optimal strategies for measuring diffusion in anisotropic systems by magnetic resonance imaging. Magn Reson Med 42(3):515–525
6. Bracht, T., Jones, D., Bells, S., Walther, S., Drakesmith, M., &Linden, D.Myelination of the right parahippocampal cingulum is associated with physical activity in young healthy adults.Brain Structure and Function.2016 : DOI: 10.1007/s00429-016-1183-3
7.Dell’acqua, F., Scifo, P., Rizzo, G., Catani, M., Simmons, A., Scotti, G. and Fazio, F. (2010) ‘A modified damped Richardson-Lucy algorithm to reduce isotropic background effects in spherical deconvolution.’, NeuroImage, Elsevier Inc., vol. 49, no. 2, pp. 1446–58.
8.Tzourio-Mazoyer, N., Landeau, B., Papathanassiou, D., Crivello, F., Etard, O., Delcroix, N., Mazoyer, B. and Joliot, M. (2002) ‘Automated anatomical labeling of activations in SPM using a macroscopic anatomical parcellation of the MNI MRI single-subject brain.’, NeuroImage, vol. 15, no. 1, pp. 273–89.
Figures