3477
Structural Connectivity Within Neural Ganglia: A Default Small-World Network1Center for Interdiscplinary Magnetic Resonance, Florida State University, Tallahassee, FL, United States, 2Chemical & Biomedical Engineering, Florida State University, Tallahassee, FL, United States, 3Physics, Florida State University, Tallahassee, FL, United States
Synopsis
Diffusion tensor imaging (DTI) provides a unique contrast based on the restricted directionality of water movement in an anisotropic environment. As such, DTI-based tractography can be used to characterize and quantify the structural connectivity within neural tissue. Here, structural connectivity within isolated abdominal neural ganglia of Aplysia californica (ABG) is assessed by integrating DTI and network theoretical analysis. For ABG, findings demonstrate a default structural network with preferential specific small-world properties when compared to simulated lattice and random networks that are equivalent in order and degree.
Purpose
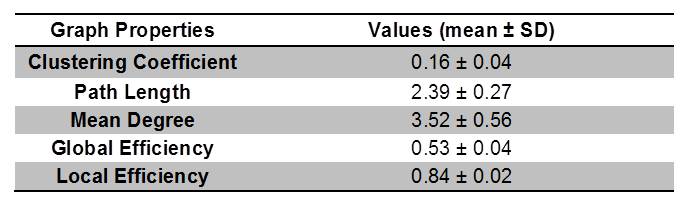
Graph theoretical analysis recently has become popular for assessing various aspects of connectivity. However, one barrier for verifying the credibility of these markers is a reliance on the acquisition resolution and the correlation of attained tracts to biophysical structures and interconnections. With in vivo and clinical diffusion tensor imaging (DTI), tractography is largely dependent on the structural connectivity defined by white matter or the functional connectivity defined by the timing of functional magnetic resonance imaging (fMRI)-measureable effects relative to stimulatory events. Taking a structural approach, this study evaluates DTI tractography and employs graph theory in the absence of major white matter tracts. Assessed non-destructively using MR measures, this work demonstrates for the first time a default structural connectivity within isolated ganglia (Fig.1 & Table1). The aim of this work is to categorize the properties exhibited by structural networks in a model neural tissue to describe macroscopic connectivity quantitatively1.Materials and Methods
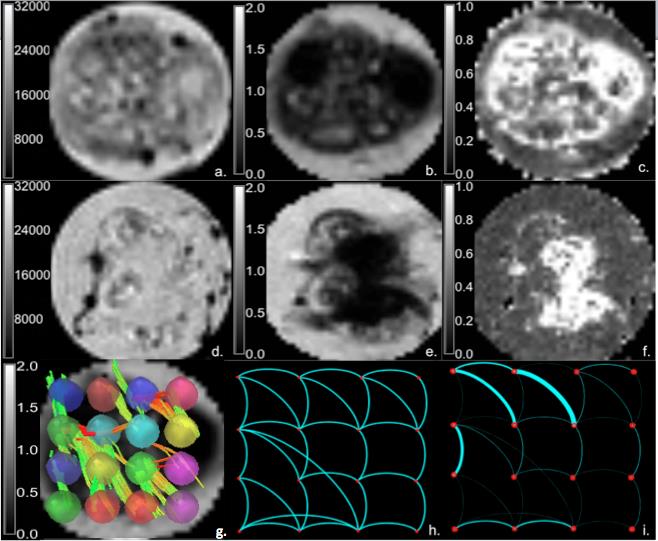
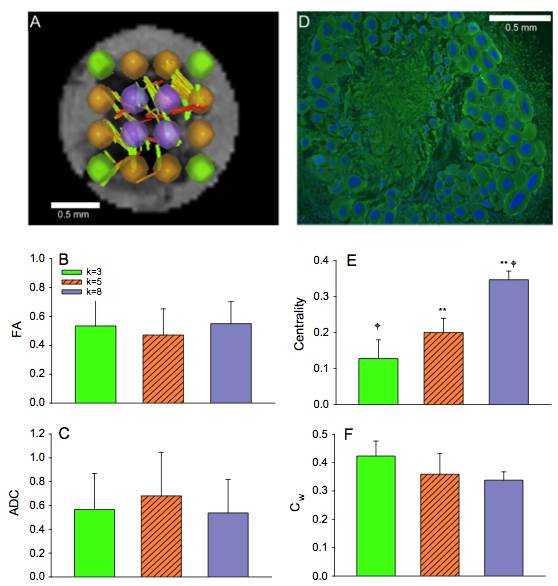
Diffusion data were acquired for ten samples (N = 10) at 11.75T using a 500-MHz widebore vertical magnet operated by a Bruker Avance spectrometer (Bruker BioSpin Corp., Billerica MA). After localizing images, DTI was acquired with the following acquisition parameters: Δ=21ms, δ=3ms, matrix = 100×100, TE = 30 ms, TR=2 s, FOV=5x5 mm, and slice thickness = 150 μm. DTI data were collected over a total acquisition time of 19.5 h using a multi-slice, diffusion-weighted 2D spin echo sequence at a resolution of 50×50×150 µm (Fig.1 A-G). A total of 22 pulsed field experiments were used to encode diffusion, including four equally dispersed unweighted b0 images having an effective b value of 73 s/mm2. The nominal b value for the remaining 18 diffusion weighted scans was 1000 s/mm2. For tractography analysis using DSI Studio2, 16 ROI-based nodes in each ganglion were used to establish a track network with the following cutoffs and thresholds: Track Counts = 106, FA threshold = 0.2 and Angular Threshold = 30°. The graph properties of experimental data were extracted using MATLAB R2015b (Mathworks, Natick, MA) to obtain the clustering coefficients, local and global efficiency, and characteristic path lengths of the binary matrices3.
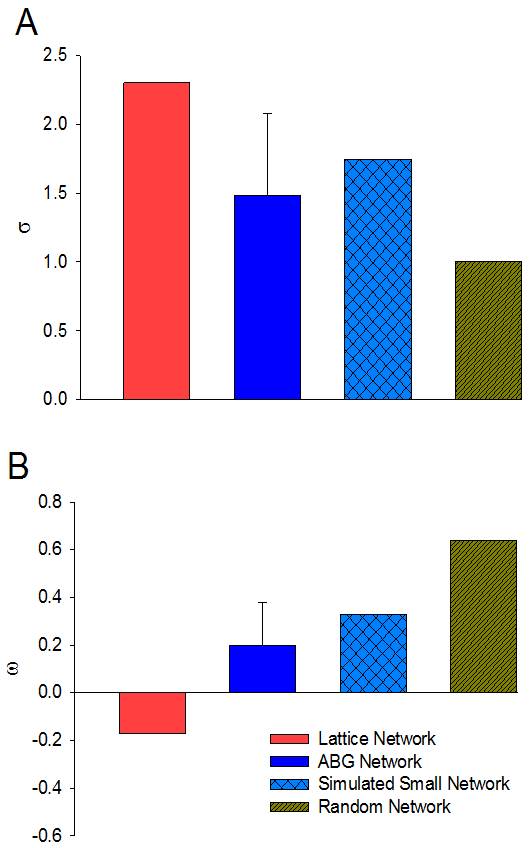
Experimental networks were compared to two Watts–Strogatz (WS) networks that were generated to include 16 local communities while maintaining the same rewiring probability as the experimental data. WS networks were assigned rewiring probabilities of 0 and 1 corresponding to lattice and random networks, respectively. In order to assess the intensity of the traffic through individual vertices in experimental data, the weighted clustering coefficient for each node was measured. Additionally, the centrality was investigated to define the most connected hubs in the selected ROIs. Finally, the graph properties reconstructed by the connectivity between nodes were assessed against the mean FA and ADC measurements for the ROIs as a function of the immediate geometrical node neighbors (the k number) for k=3, 5 and 8.
Results and Discussion
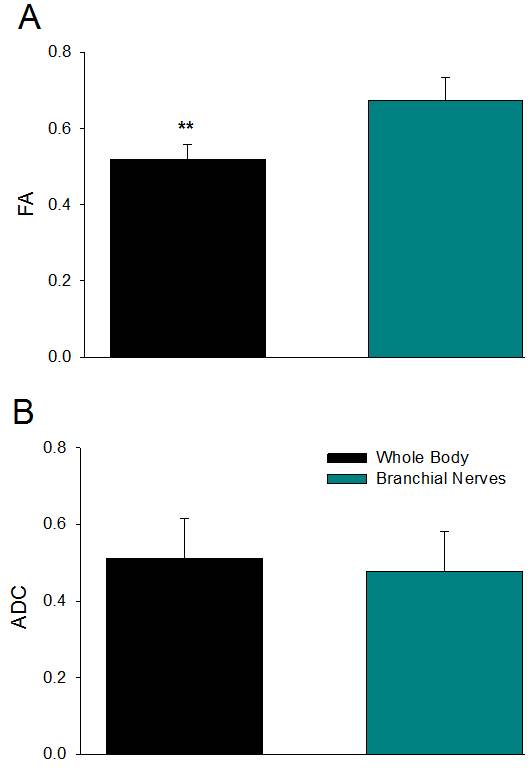
Significant differences in FA measurements were found between the ganglion body and branchial nerves (Fig. 2). The experimental networks exhibit small-world properties when quantitatively evaluated using novel small world metric4 ω and small worldness5 σ (Fig. 3). FA and ADC maps were obtained for the isolated abdominal ganglia to investigate the correlations of these measurements with the graph properties of their corresponding nodes. More critically, the lack of significance between immediate geometric neighbors with respect to the weighted clustering coefficient demonstrates the graph’s preference for more critical hubs on the periphery of the ganglion that have a higher number of interconnections within closed clusters even though there exists a lower centrality (Fig. 4). This finding is supported by immunohistology, which demonstrates a well-known higher distribution of large neurons in the periphery of the ganglion with more axon density in central regions. The graph theory here applied would suggest that the information circulated among these peripheral hubs is critical for network robustness.
Conclusions
In a conclusion, this study underscores the utility of applying graph theory to assess neural networks, even approaching the cellular level. The demonstrated default structural connectivity and small-world efficiency suggest that the quantifiable graph properties of and even within neural tissue have the potential to be used as biomarkers that can be investigated against various variables.Acknowledgements
This work was supported by the User Collaborations Grant Program at the National High Magnetic Field Laboratory, which is funded by the National Science Foundation (DMR-1157490) and State of Florida.References
1. Ould Ismail, A. A. O, Amouzandeh, G., & Grant, S. C. 2016. Structural connectivity within neural ganglia: A default small-world network. Neuroscience 337: 276-284.
2. Yeh F, Verstynen TD, Wang Y, Fernández-Miranda JC, Tseng WI. 2013. Deterministic diffusion fiber tracking improved by quantitative anisotropy. PLoS One. 8(11): e80713.
3. Watts DJ, Strogatz SH. 1998. Collective dynamics of ‘small-world’ networks. Nature 393: 440-442.
4. Telesford QK, Joyce KE, Hayasaka S, Burdette JH, Laurienti PJ. 2011. The ubiquity of small-world networks. Brain Connectivity 1: pp. 367-375.
5. Humphries MD, Gurney K (2008) Network ‘small-world-ness’: a quantitative method for determining canonical network equivalence. PLoS One 3(4): e0002051.
Figures