3476
Stability metrics for optic radiation tractography: towards damage prediction after resective surgery1Mathematics and Computer Science, Eindhoven University of Technology, Eindhoven, Netherlands, 2Academic Center for Epileptology Kempenhaeghe & Maastricht UMC+, Heeze, Netherlands, 3Biomedical Engineering, Eindhoven University of Technology, Eindhoven, Netherlands, 4Neurosurgery, Maastricht UMC+, Maastricht, Netherlands, 5Mathematics and Computer Science, Delft University of Technology, Delft, Netherlands
Synopsis
An accurate delineation of the optic radiation (OR) is useful in reducing the risk of a visual field deficit after temporal lobe resective surgery. However, tractography, especially of the probabilistic kind, is prone to generate spurious (false-positive) streamlines that are poorly aligned with the surrounding bundle. Fiber-to-bundle coherence measures are applied to identify and remove spurious fibers, which together with test-retest parameter estimation can provide a reconstruction of the OR that is robust to the stochastic realization of probabilistic tractography. Pre- and post-operative comparison of the OR is performed for epilepsy patients to quantify the accuracy of damage prediction.
Purpose
Diffusion-weighted MRI tractography is a means of reconstructing the optic radiation (OR). An accurate delineation of the OR is useful in assessing and reducing the risk of a visual field deficit after temporal lobe resective surgery.1 However, tractography, especially of the probabilistic kind, is prone to generate spurious (false-positive) streamlines that are poorly aligned with the surrounding bundle. Spurious streamlines negatively impact the ability to accurately measure the distance between the temporal pole to the tip of the Meyer’s loop (ML-TP), a distance measure that is essential for predicting the potential damage to the OR.2,3Methods
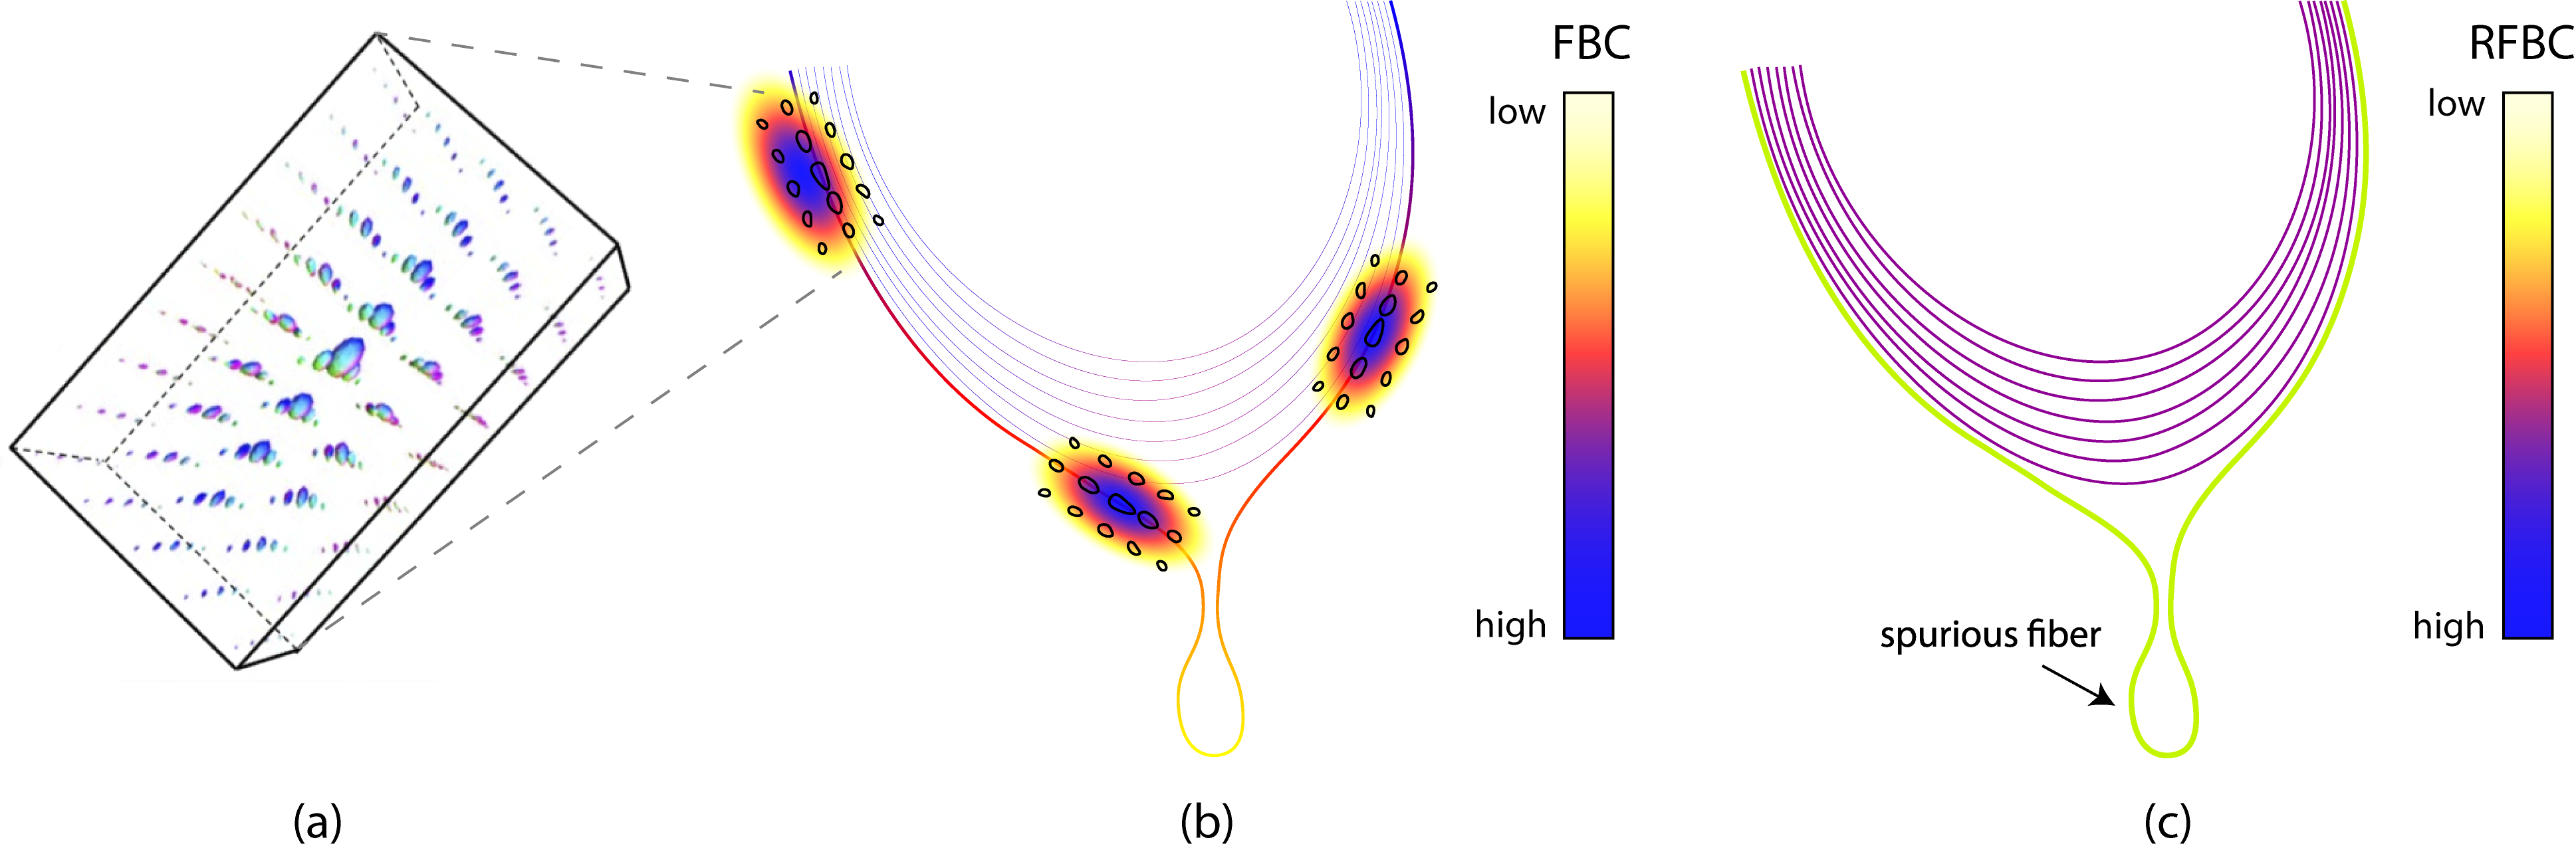
To identify and remove spurious fibers, we consider fiber-to-bundle coherence (FBC) measures that provide a quantitative measure of the alignment of streamlines.4 In this procedure, a notion of alignment between neighboring streamline points is obtained by embedding the streamlines into the differentiable manifold of the rigid-body motion Lie group SE(3). Within this non-flat differential structure, a metric is defined that measures the distance between any two streamline points in both position and orientation of its tangent vectors.5,6,7 The metric is evaluated through kernel density estimation, applied using a hypo-elliptic Brownian motion kernel, as depicted in Figure 1.A.8 The FBC results from evaluating the kernel density estimator along each element of all lifted streamlines (see Figure 1.B) where the FBC is color-coded for each streamline. Lastly, a scalar measure for the entire streamline is introduced, called the relative FBC (RFBC), which computes the minimum of the average FBC in a sliding window along the streamline (see Figure 1.C). For a concise mathematical description see (goo.gl/9lZgcG).
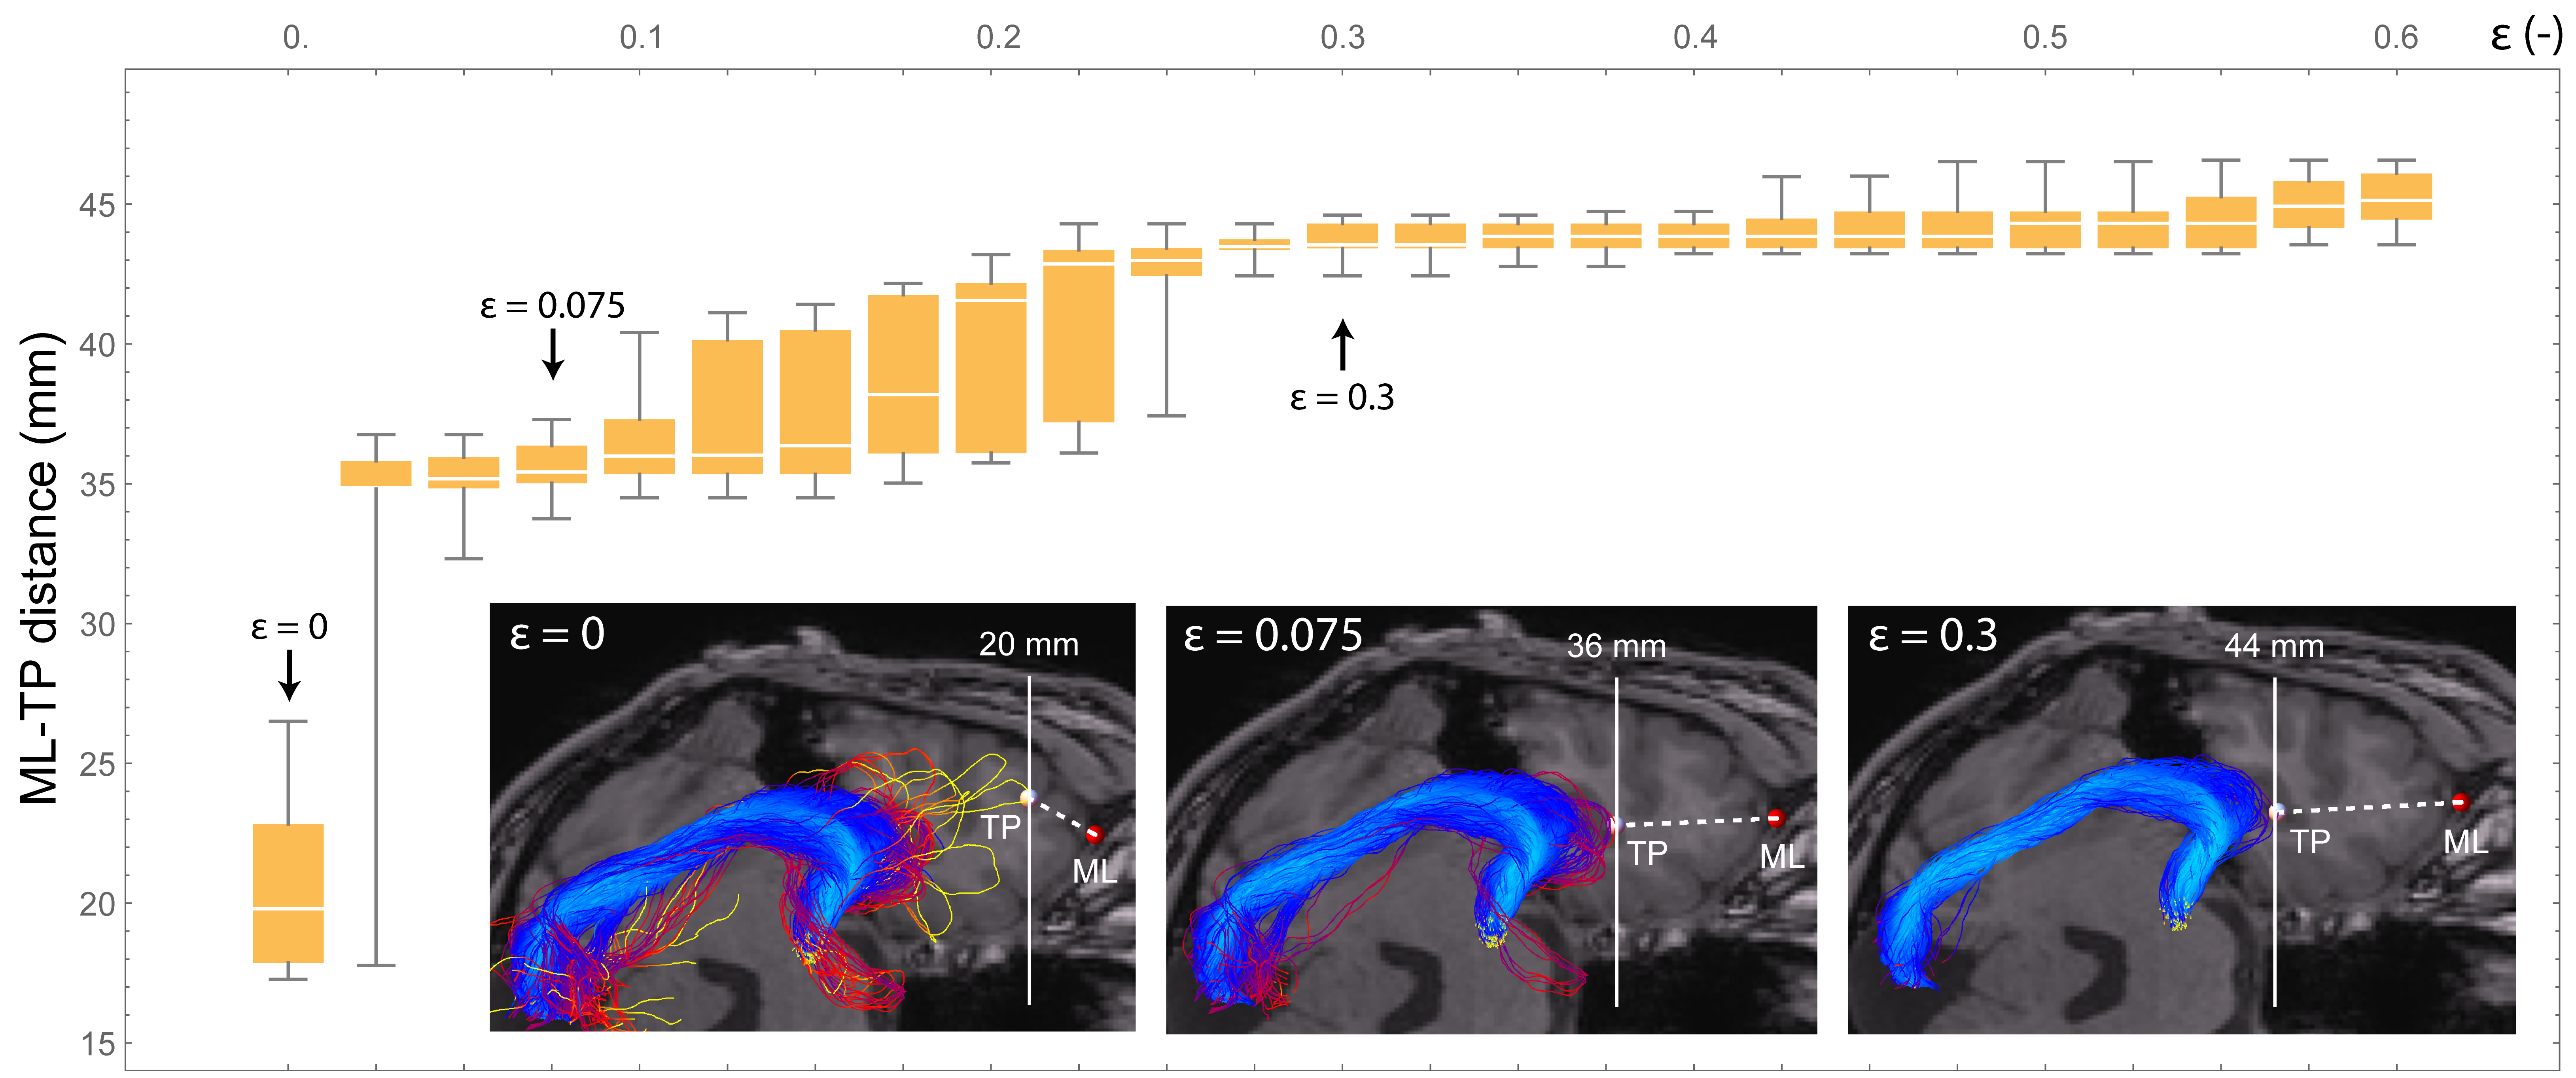
Spurious streamlines can be identified by a low RFBC and removed from the tractography result. For this purpose, the threshold parameter ε is introduced, which is defined as the lower bound criterion on RFBC that retains a streamline. However, preservation of the Meyer’s loop requires a careful selection of thresholds such that spurious streamlines are removed while maintaining a high sensitivity. Standardized selection of ε is achieved through test-retest evaluation of the variability in ML-TP distance. To this end, the RFBC is computed of repeated tractograms. Subsequently, for increasing values of ε, the mean and standard deviation of the ML-TP distance are calculated, as illustrated in Figure 2. In this procedure we define the optimal choice of ε to be at the point when the variability first drops below 2 mm, which is a value reflecting surgical accuracy. The pipeline for optic radiation reconstruction and reliable ML-TP distance measures is available as open source software (goo.gl/WuqlkH) and the FBC measures are additionally available in DIPY.9
Results
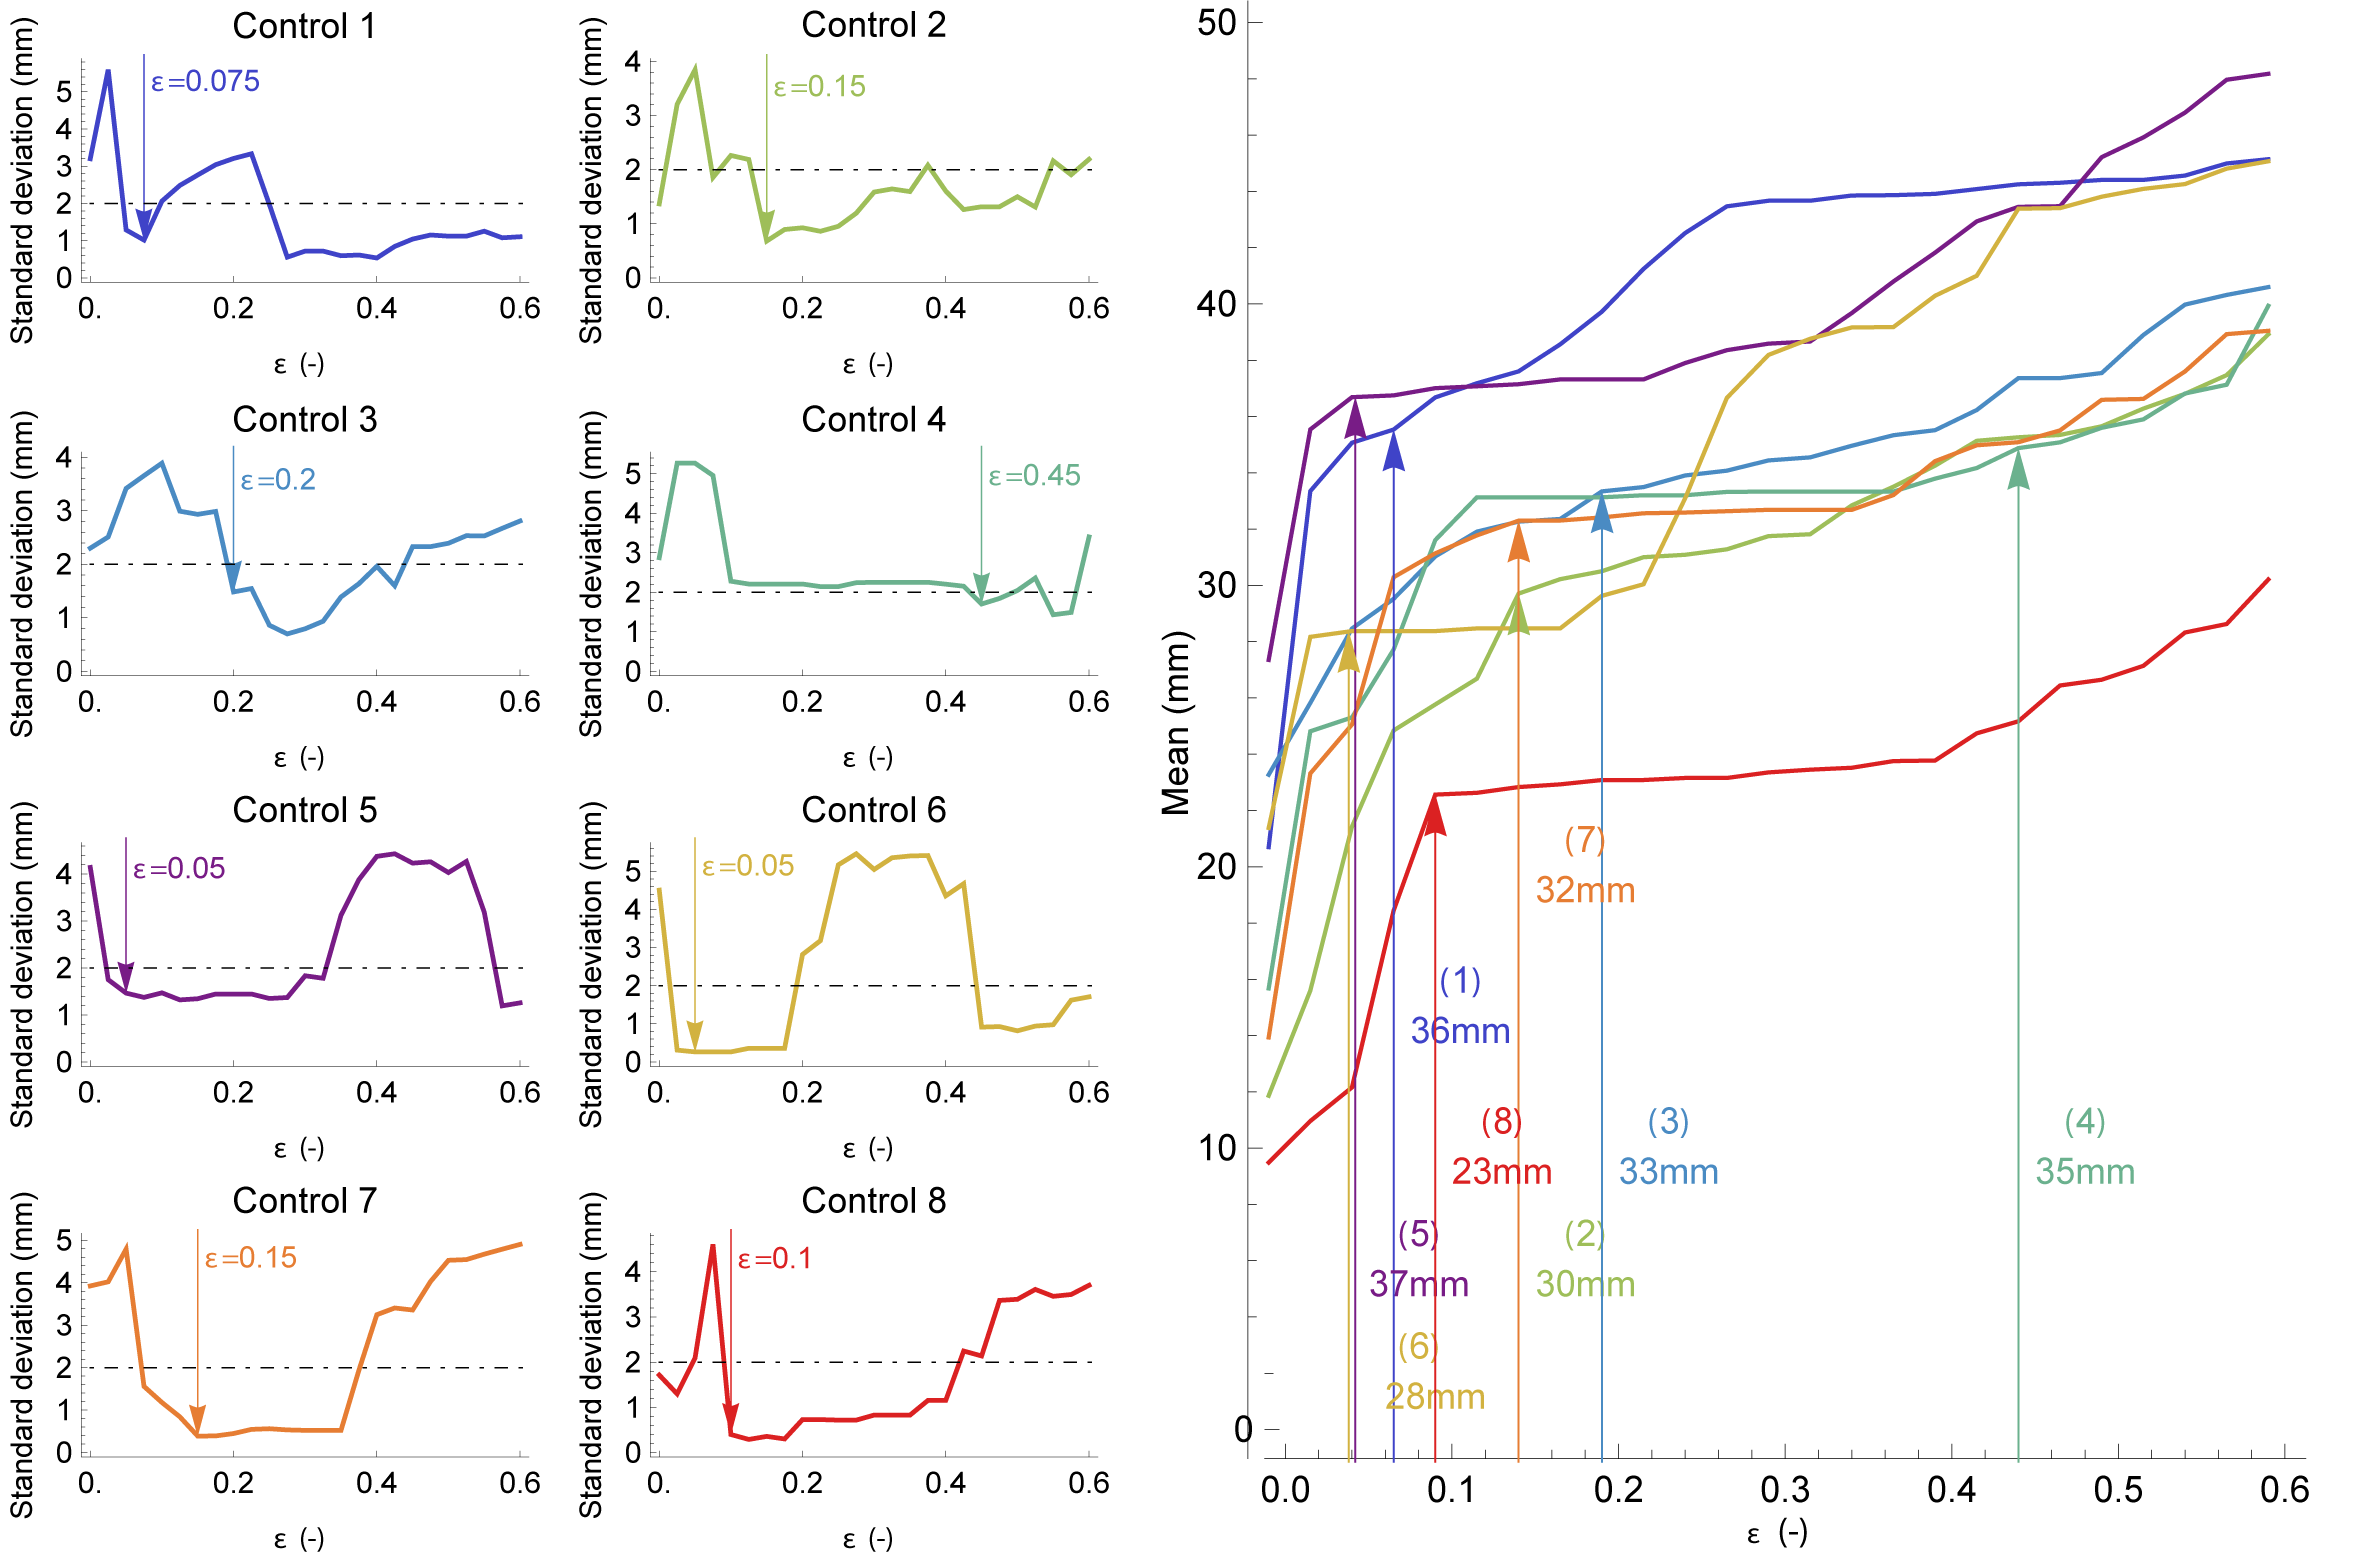
The estimation of ML-TP using the RFBC measures is demonstrated for healthy volunteers (N=8). For each volunteer an informed choice of the parameter ε was made, shown in Figure 3. For all volunteers evaluated, a high standard deviation of the ML-TP distance (over 2 mm) was observed at low values of ε (0.0 - 0.05), which indicates the presence of spurious streamlines that have a very low RFBC. After an initial region of low stability, all healthy volunteers showed a stable region in which the standard deviation was below 2 mm and the corresponding mean ML-TP distance stabilized. Furthermore, the FBC measures are applied to compute the ML-TP for patients that are candidate for epilepsy surgery (N=3) and provide, together with the resection length, a prediction of the damage to the OR. In order to quantify the prediction accuracy, pre- and post-operative comparisons are made of the reconstruction of the OR of these patients. The difference between the predicted damage and the measured remaining extent of the post-operative reconstruction of the OR provides an estimate of the uncertainty of the prediction.Discussion
The parameter estimation through test-retest evaluation provides an ML-TP distance measure that is robust against the stochastics of probabilistic tractography. However, other sources of inaccuracy may be present such as echo-planar imaging distortion, partial volume effects, and image noise. The predictions of damage to the OR were evaluated on a small patient group, showing concordant predictions in relationship to the visual field deficit. The predicted and observed damage to the OR were comparable, showing a deviation in the order of millimeters, which gives an indication of the overall inaccuracy in the measured ML-TP distance.Conclusion
The stability metrics introduced in this study for the accurate localization of the tip of the Meyer’s loop and clinical evaluation appear promising for further research in clinical trial studies, in which the damage to the OR is related to the visual field deficit that may occur after temporal lobe resection.Acknowledgements
The research leading to these results has received funding from the European Research Council under the European Community's Seventh Framework Programme (FP7/2007-2014) / ERC grant agreement no. 335555.References
1. Winston GP, Daga P, White MJ, et al. Preventing visual field deficits from neurosurgery. Neurology 2014;83(7):604-611.
2. Winston GP, Daga P, Stretton J, et al. Optic radiation tractography and vision in anterior temporal lobe resection. Ann Neurol. 2012;71(3):334-341.
3. Lilya Y, Ljungberg M, Starck G, et al. Tractography of Meyer's loop for temporal lobe resection—validation by prediction of postoperative visual field outcome. Acta Neurochir. 2015;157(6):947-956.
4. Portegies JM, Fick RH, Sanguinetti GR, et al. Improving Fiber Alignment in HARDI by Combining Contextual PDE Flow with Constrained Spherical Deconvolution. PLoS ONE 2015;10(10):e0138122, doi: 10.1371/journal.pone.0138122
5. Mumford D. Algebraic Geometry and Its Applications. Springer-Verlag 1994;491–506.
6. Citti G, Sarti A. A Cortical Based Model of Perceptual Completion in the Roto-Translation Space. J Math Imaging Vis. 2006;24(3):307–326.
7. Duits R, Felsberg M, Granlund G, et al. Image Analysis and Reconstruction using a Wavelet Transform Constructed from a Reducible Representation of the Euclidean Motion Group. Int J Comput Vision 2007;72(1):79–102.
8. Duits R, Franken E. Left-Invariant Diffusions on the Space of Positions and Orientations and their Application to Crossing-Preserving Smoothing of HARDI images. Int J Comput Vision 2011;92(3):231–264.
9. Garyfallidis E, Brett M, Amirbekian B, et al. Dipy, a library for the analysis of diffusion MRI data. Front Neuroinform. 2014:8(8), doi:10.3389/fninf.2014.00008
Figures