3475
Structure tensor informed fibre tractography at 3T1Donders Centre for Cognitive Neuroimaging, Donders Institute for Brain, Cognition and Behaviour, Nijmegen, Netherlands
Synopsis
Structure tensor informed fibre tractography (STIFT) based on diffusion images at 3T and gradient-echo images at 7T has shown improvement in the accuracy of white matter bundles tracking in the presence of kissing and crossing fibres. In this study, we implemented STIFT using both DWI and GRE images at 3T. We further demonstrated white matter contrast presence in T2* mapping and quantitative susceptibility mapping derived from GRE data can be used to compute structure tensor. The benefits of STIFT are shown in two tractography applications.
Introduction
Diffusion-based fibre tractography is challenging both because of the limited spatial resolution of DWI, the presence multiple fibre tacks and orientations within each voxel. One way to improve the accuracy of tractography is a method called structure tensor informed fibre tractography (STIFT)1. This method uses the high spatial resolution of GRE images where the boundaries of major fibre bundles such as optic radiation (OR) and corpus callosum (CC) can be identified, providing morphological indication of fibre borders to provide additional information to conventional diffusion based fibre tracking techniques. However, in its original implementation GRE images and DWI images were acquired at 7T and 3T scanners respectively, limiting the applicability of STIFT. Meanwhile, recent developments of DWI and scanner technology allows diffusion profile to be resolved at higher spatial resolution (~1.53 mm3) with higher b-values and using more efficient data sampling (using simultaneous-multi-slice acquisitions), supporting higher angular resolution of DWI. In this study, we set out to evaluate the performance of STIFT by acquiring both GRE and DWI images at 3T with a state-of-art DWI sequence and using not only the magnitude but also the phase of GRE signal as an input for the structure tensor.Methods
Data acquisition
Data acquisition was performed at 3T (Magnetom Prisma, Siemens, Erlangen, Germany) using 32-channel array head coil in 2 healthy volunteers. The imaging protocol consisted of:
(1) Whole brain T1-weighted images using MPRAGE res=1 mm isotropic, Tacq=5 mins;
(2) DWI using a spin-echo EPI sequence with multiband factor of 4, 84 slices, TR/TE=3460/97.6 ms, res=1.5 mm isotropic, b=2000 s/mm2 and 100 diffusion directions (and 11 measurements b=0), Tacq=7 mins;
(3) Multi-echo 3D GRE with 5 echoes, TR/TE=52/5.6:9.8:44.8 ms, res=0.75 mm isotropic and 2D GRAPPA=4, Tacq=11 mins;
Data processing
DWI images were corrected for eddy current distortion using FSL software2. Q-ball orientation density functions were computed in Camino with spherical harmonic order of 6, allowing diffusion peak directions to be extracted3.
T2* and field maps were computed from the multi-echo data4. QSM was then computed using superfast dipole inversion5, and subsequently combined with the T2* map in order to create susceptibility-weighted images that enhance diamagnetic features (dSMWI)6. To reduce noise propagation into the structure tensor, ANLM filter was applied before computing the T2* maps and on the QSM respectively7.
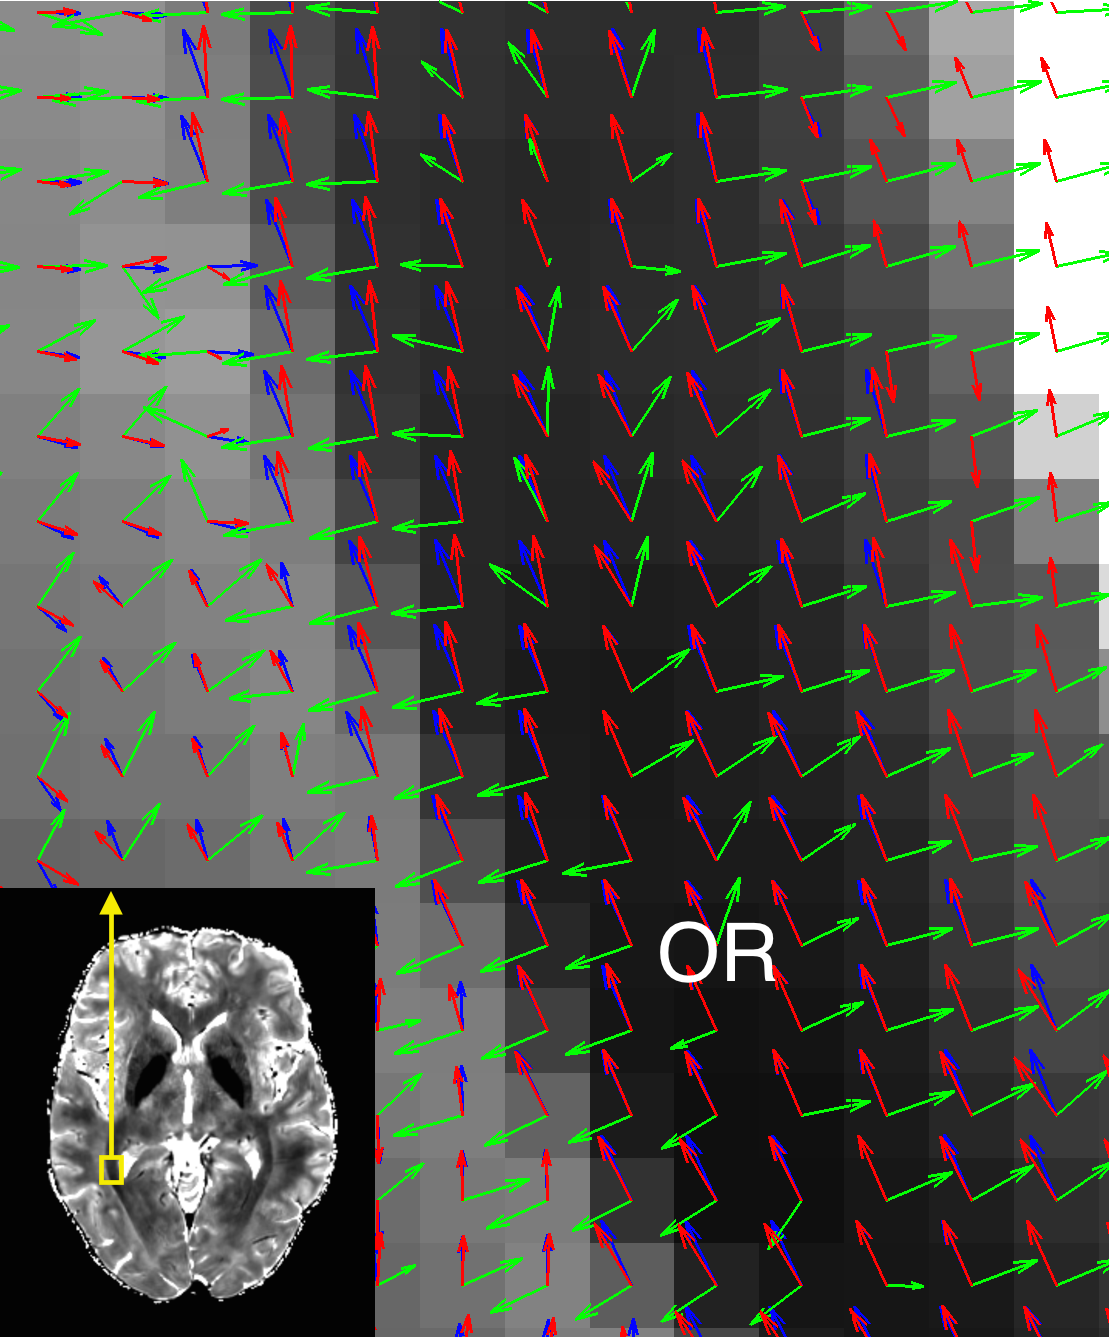
Anatomical structure alignment between DWI images and GRE images was achieved by co-registering both data to T1-w images interpolated to 0.75mm. The DW directions in white matter voxels (computed from T1-w images) were adapted by STIFT, rotating the diffusion peak directions towards the plane orthogonal to the local structure tensor (see Fig. 3)1. To evaluate tractography performance, fibre streamlines were reconstructed without and with STIFT for the two structure tensors (T2* and dSMWI) in: - (i) optic radiation (OR)/inferior longitudinal fasciculus (ILF) and - (ii) cingulum (CG)/corpus callosum (CC). Seed pairs were placed inside the individual fibres and at the border between the fibres. These allowed us to study the effects of STIFT when tracking highly curved fibres (i) and tracking kissing/crossing fibres (ii).
Results
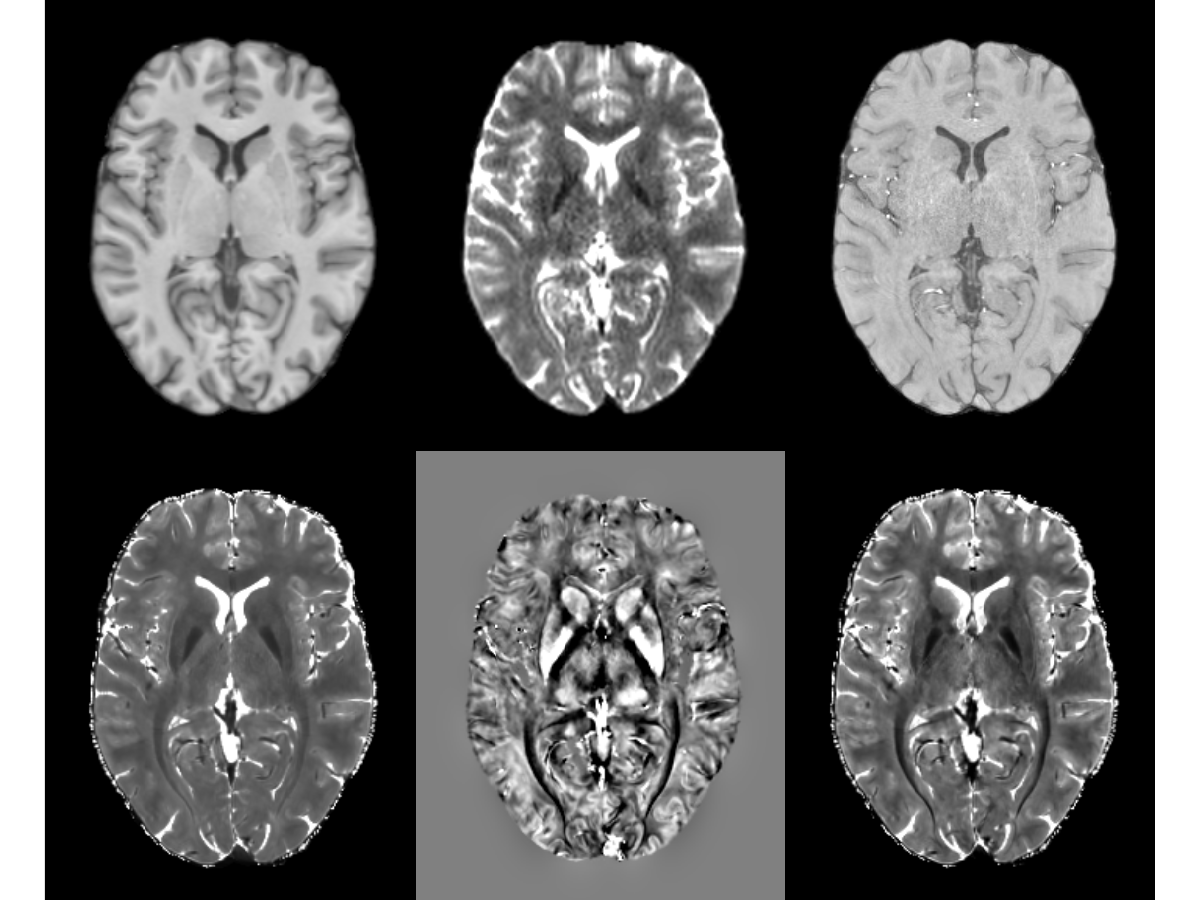
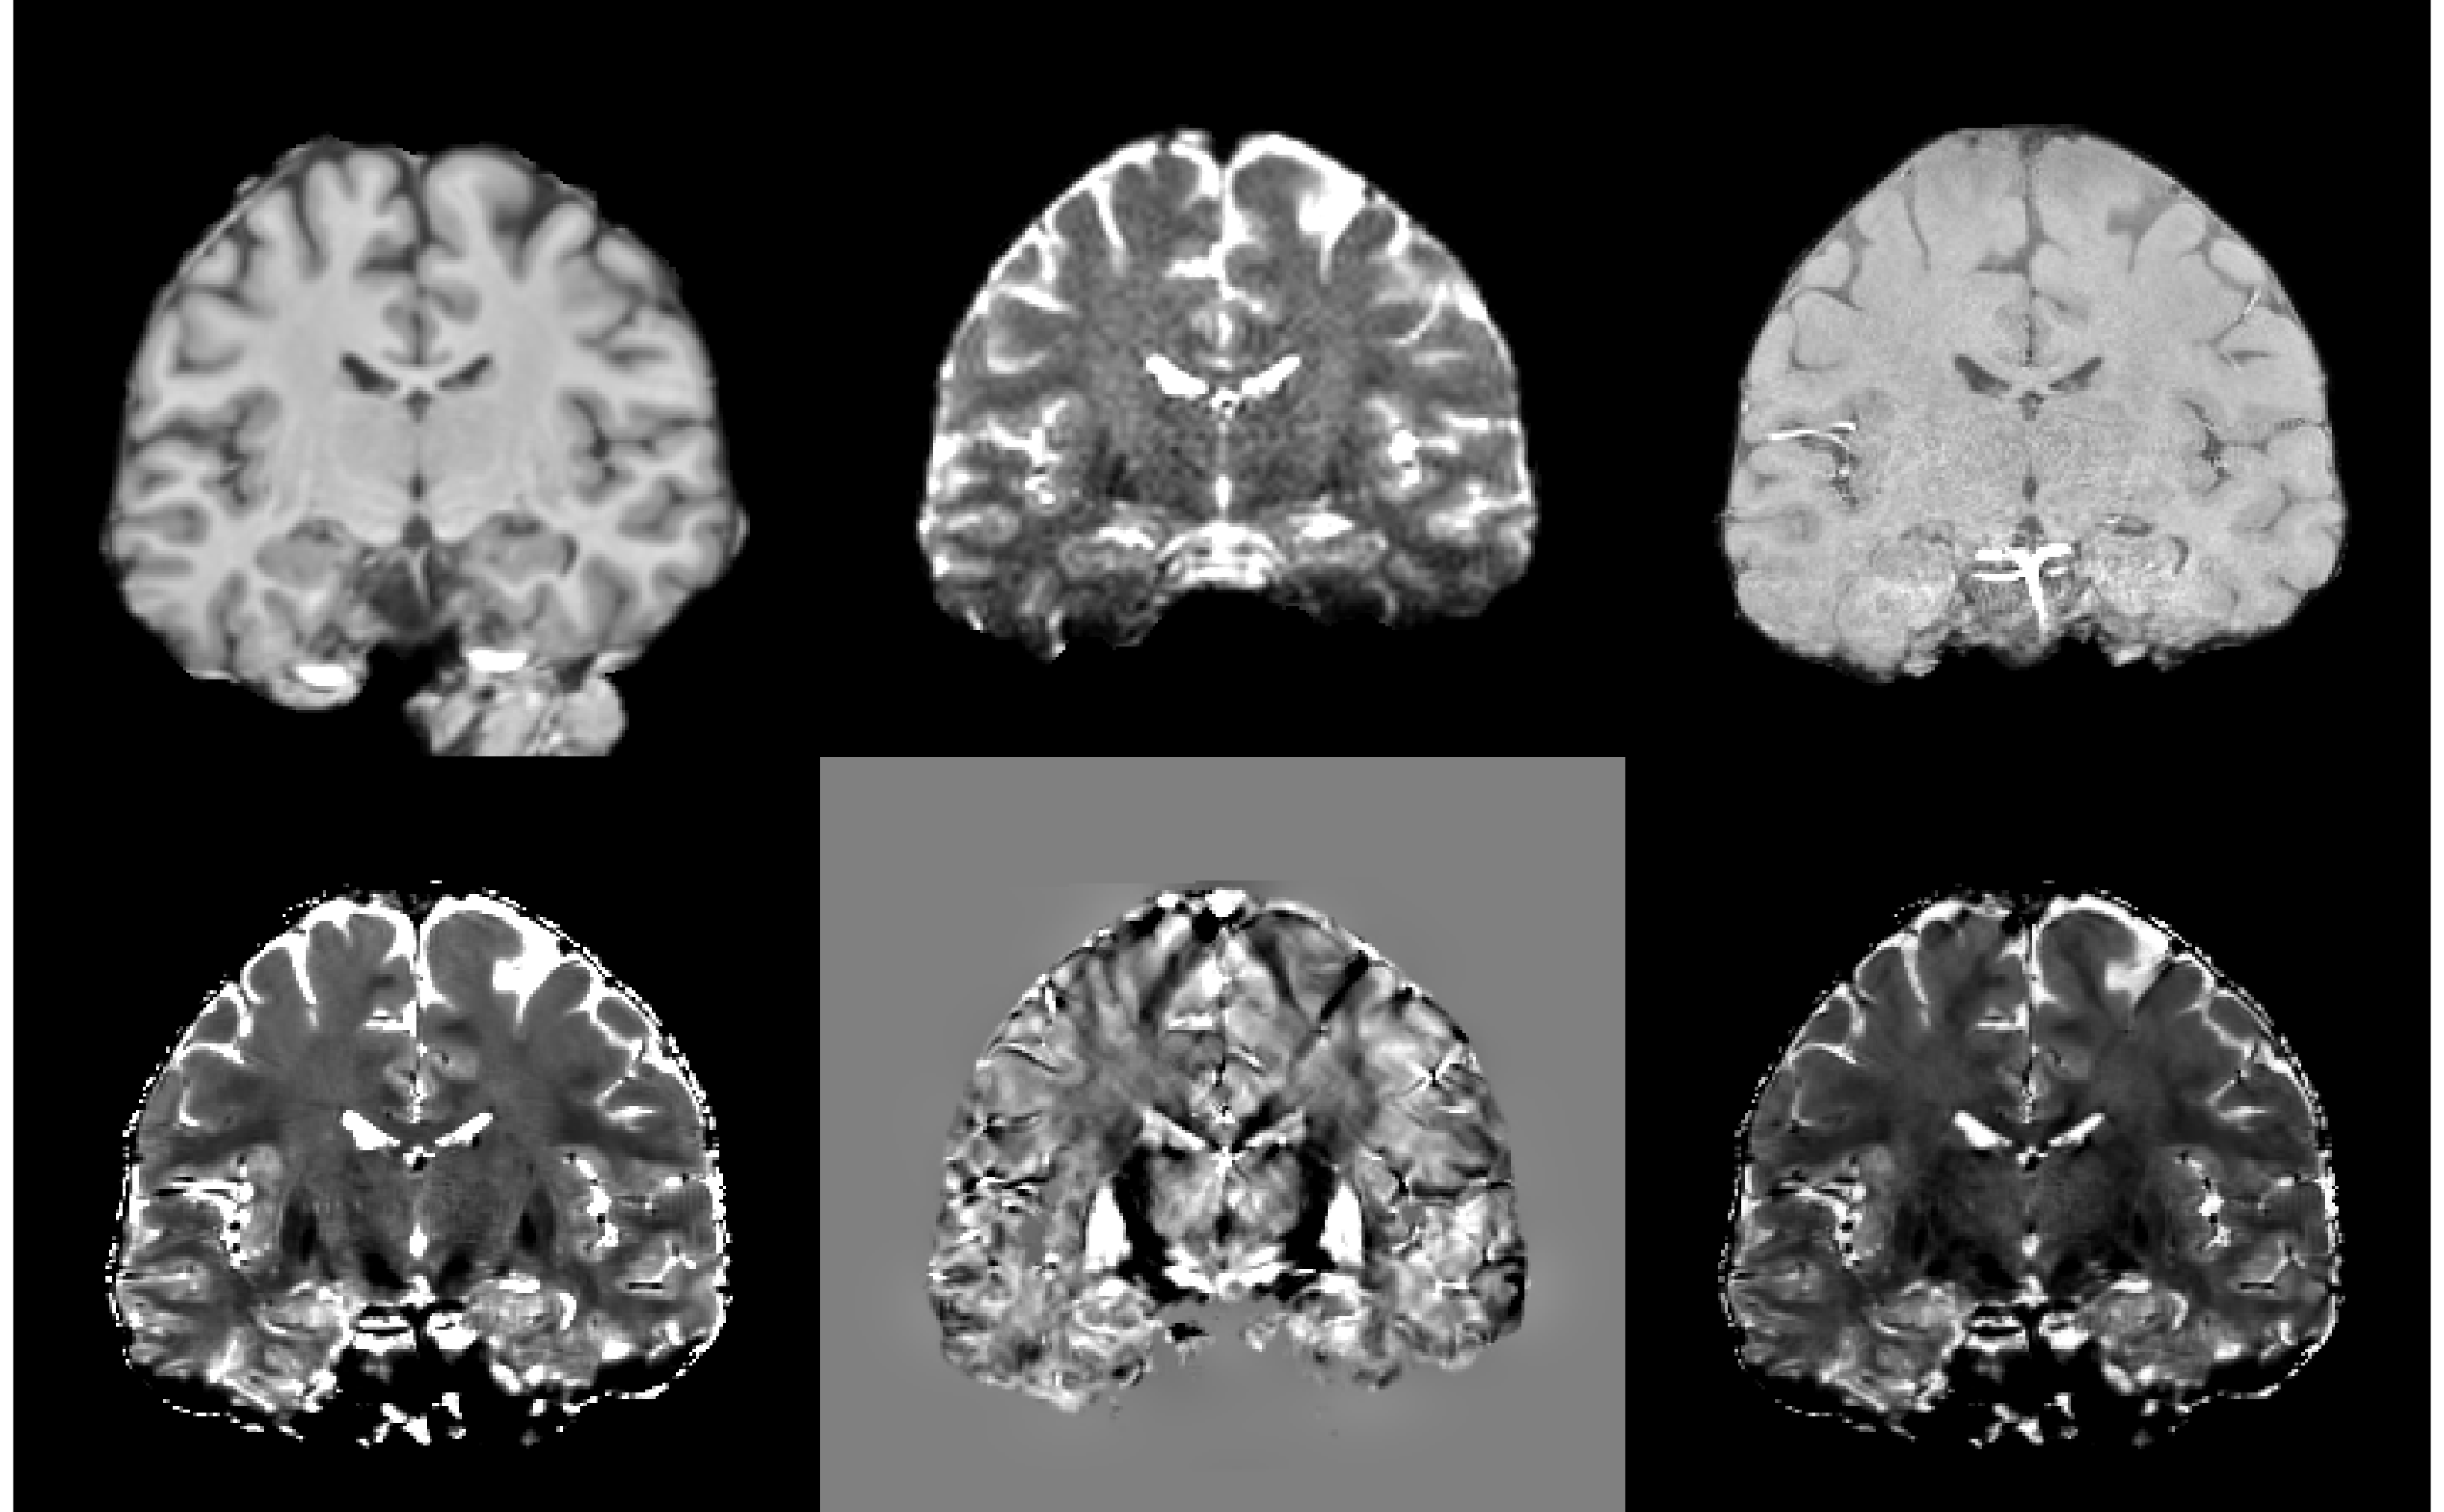
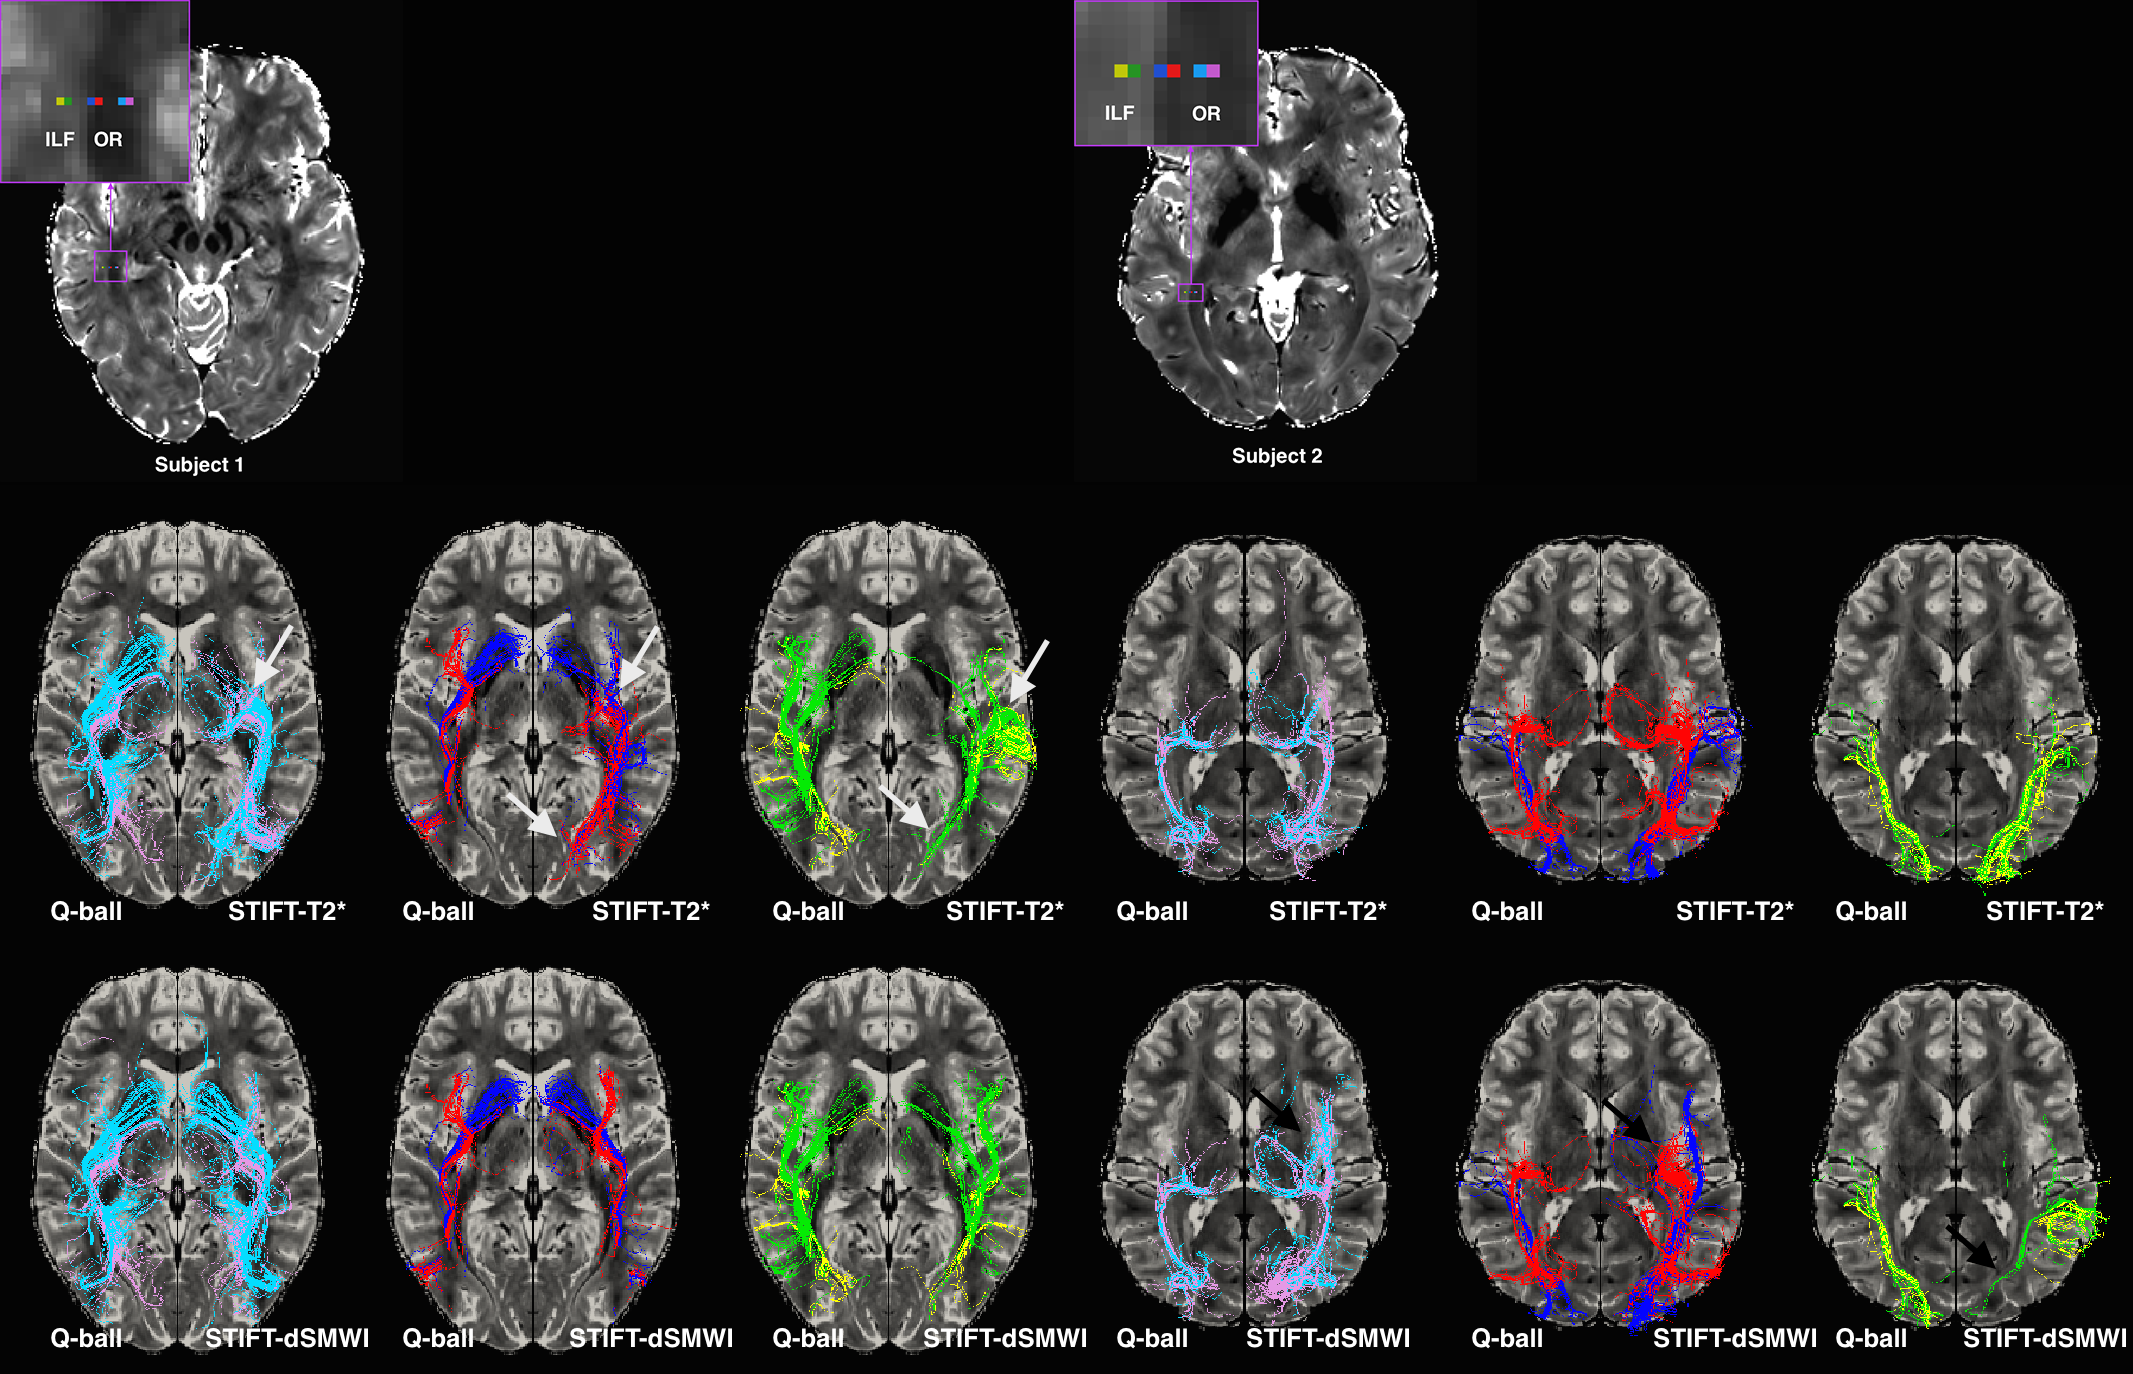
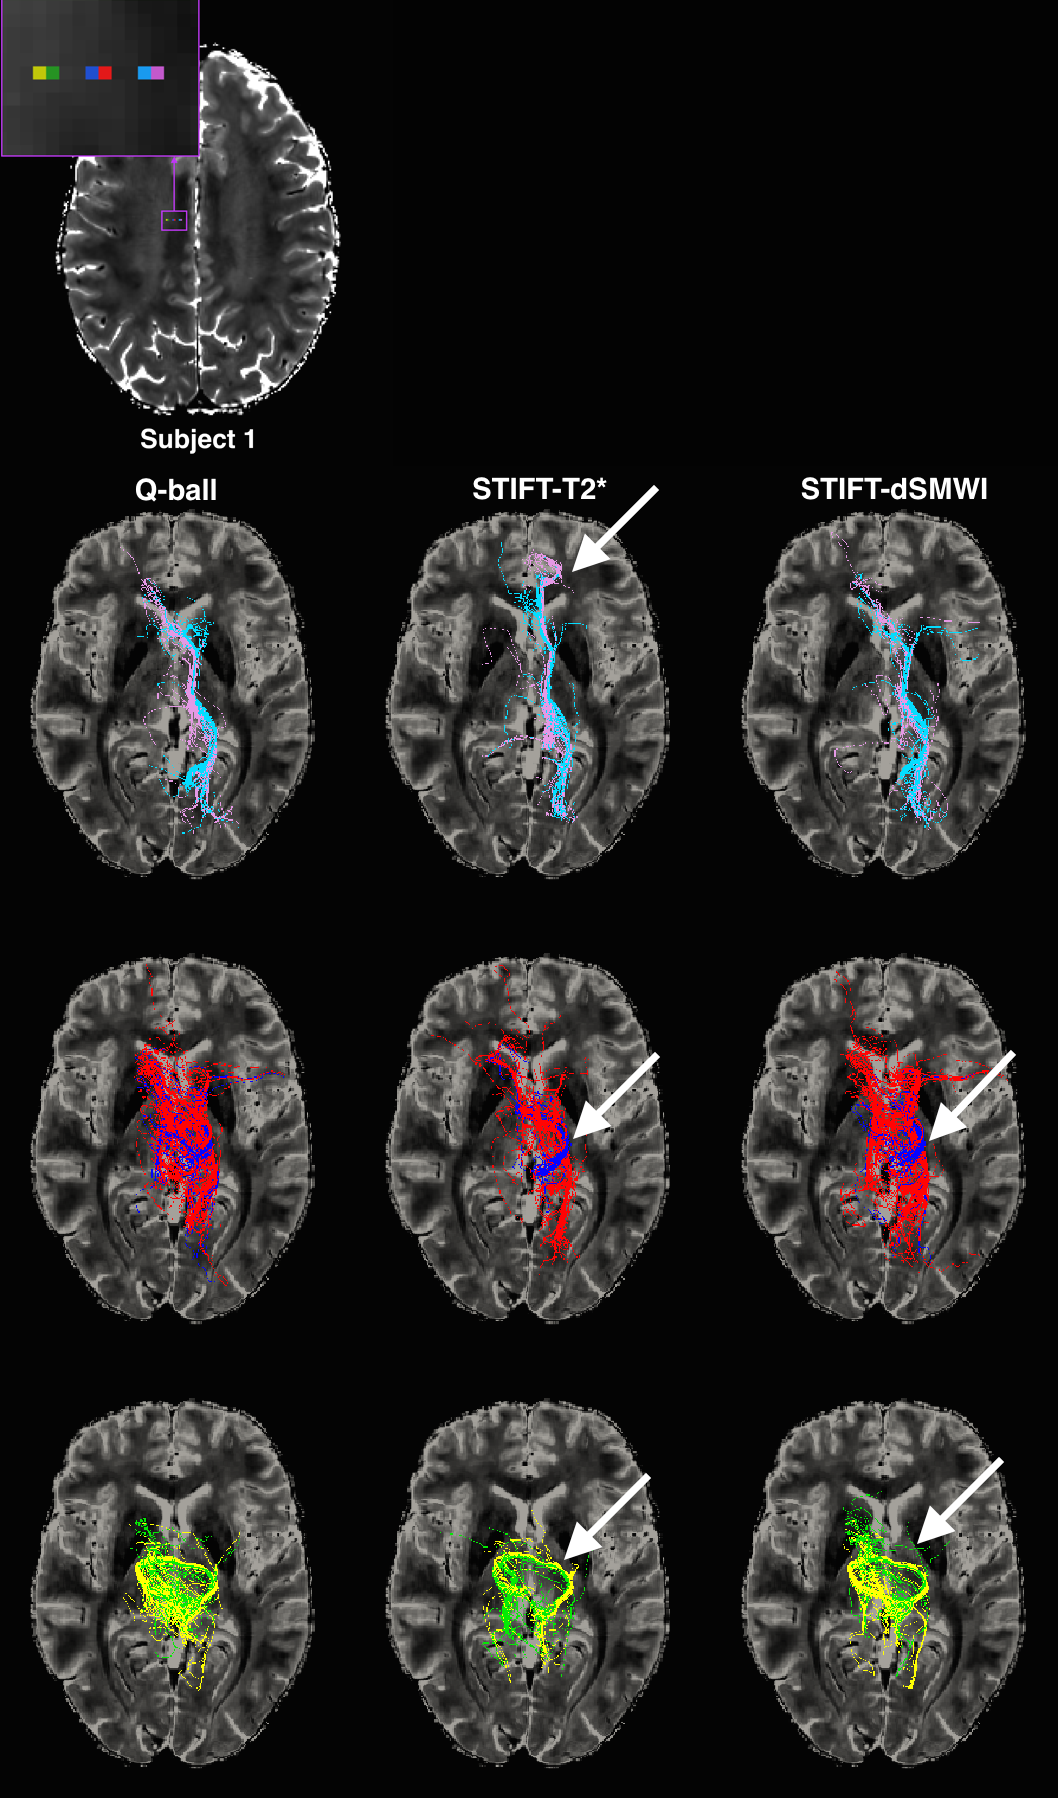
T2* maps and dSMWI maps show heterogeneity between OR and ILF (see Fig. 1) and between CG and CC (see Fig.2), thus can be used to compute the structure tensor for STIFT (see Fig.3) that will adapt the diffusion peak directions found in each voxel. The tractography results between Q-ball and STIFT using dSMWI as the structure tensor are similar, with the greater improvements being obtained when using T2*-based STIFT. In OR/ILF region, Figure 4 shows increased number of OR streamlines turning to lateral geniculate nucleus (LGN) with STIFT adaptation for seeds inside the OR. For the seeds in the border medial to the OR, the anterior extend of Meyer’s loop is more pronounced with STIFT when compared to Q-ball-based results. In CG/CC region, the results of CC and CG tractography are similar between STIFT and Q-ball, where fibre streamlines mainly follow their anatomical structure (being longer with STIFT-T2*). The advantage of STIFT is obvious for seeds at the borders between CC and CG, where STIFT provides more separated streamlines for this seed pair while Q-ball produces many crossing and overlapping streamlines.Conclusion
This study demonstrates that STIFT can be implemented using 3T data only and that STIFT can improve tractography results in these two sets of neighbouring fibre bundles. While it is clear that both T2* and QSM have white matter anatomical information, the STIFT results obtained suggest that at present the use of T2* is to be preferred, and that further improvements will be necessary to utilise QSM.Acknowledgements
This work is supported by the EU through grant FP7-PEOPLE-2013-ITN as a part of the Marie-Curie "Initial Training Networks" Actions.References
1. Kleinnijenhuis M, Barth M, Alexander DC, van Cappellen van Walsum A-M, Norris DG. Structure Tensor Informed Fiber Tractography (STIFT) by combining gradient echo MRI and diffusion weighted imaging. Neuroimage 2012;59:3941–3954.
2. Andersson JLR, Skare S, Ashburner J. How to correct susceptibility distortions in spin-echo echo-planar images: application to diffusion tensor imaging. Neuroimage 2003;20:870–888.
3. Cook PA, Bai Y, Nedjati-Gilani S. Camino: open-source diffusion-MRI reconstruction and processing.14th Scientific Meeting of the International Society for Magnetic Resonance in Medicine, Seattle, WA, USA, p. 2759, May 2006
4. Khabipova D, Wiaux Y, Gruetter R, Marques JP. A modulated closed form solution for quantitative susceptibility mapping-a thorough evaluation and comparison to iterative methods based on edge prior knowledge. Neuroimage 2015;107:163–174.
5. Schweser F, Deistung A, Sommer K, Reichenbach JR. Toward online reconstruction of quantitative susceptibility maps: superfast dipole inversion. Magn Reson Med 2013;69:1582–1594.
6. Gho S-M, Liu C, Li W, Jang U, Kim EY, Hwang D, Kim D-H. Susceptibility map-weighted imaging (SMWI) for neuroimaging. Magn Reson Med 2014;72:337–346.
7. Manjón JV, Coupé P, Martí-Bonmatí L, Collins DL, Robles M. Adaptive non-local means denoising of MR images with spatially varying noise levels. J Magn Reson Imaging 2010;31:192–203.
Figures