3474
When does a volume of a bundle achieve saturation? A microstructure informed tractography study1Signal Processing Lab (LTS5), École Polytechnique Fédérale de Lausanne, Lausanne, Switzerland, 2Sheerbrooke Connectivity Imaging Laboratory (SCIL), University of Sheerbrooke, Canada, 3University Hospital Center (CHUV) and University of Lausanne (UNIL), Switzerland, 4Department of Computer Science, University of Verona, Italy
Synopsis
Volumetric analysis of bundles derived from tractography is a popular statistical measure used in neurological disorder studies. Recent research performed by Gauvin shows that different bundles saturate with different tractography parameters, however, to achieve that saturation millions of streamlines need to be computed. In this investigation, the aim was to use microstructure informed tractography, a novel technique that combine tractography and microstructure models, to study the saturation of the bundles. This study has found that generally microstructure informed tractography makes the volume estimation less sensitive to tracking parameters. The findings may have profound implications in volumetric analysis in group studies.
Purpose
Streamlines derived from tractography can be grouped in bundles1 that respect the anatomy of the brain. Over a bundle it is possible to perform different metrics and statistics, such as calculate the spatial extent or volume2,3. The present study was designed to determinate if microstructure estimations can assert informations on volumes of the bundles3.Methods
COMMIT (Convex Optimization Modeling for Microstructure Informed Tractography)4,5 is a recent framework proposed to combine both tractography and tissue microstructure estimation in a linear formulation: $$\boldsymbol{y}=\boldsymbol{A}\boldsymbol{x}+\eta\,,$$ where $$$\boldsymbol{A}$$$ is the linear operator implementing a generic multi-compartment model6 for the signal contributions of the streamlines in each voxel, $$$\boldsymbol{y}$$$ contains all dMRI measurements and $$$\eta$$$ is the acquisition noise. The contributions $$$\boldsymbol{x}$$$, that are used to filter the tractogram, are estimated solving a nonnegative least-squares problem: $$\underset{\boldsymbol{x}\ge0}{\operatorname{argmin}}\;||\boldsymbol{A}\boldsymbol{x}-\boldsymbol{y}||_2^2.$$ The linear operator $$$\boldsymbol{A}$$$ was build according to the StickZeppelinBall model6 that assumes zero radius cylinders with fixed longitudinal diffusivity $$$d_\parallel$$$ for the intra-axonal space, extra-axonal space modelled as anisotropic tensors with same $$$d_\parallel$$$ but different $$$d_\perp$$$, and isotropically restricted compartment. The code is freely-available at https://github.com/daducci/COMMIT.
We tested our approach on 6 healthy subjects with 2 time-points acquired on Siemens Magnetom Prisma system, according to the following protocol: $$$2.0\,\text{mm}$$$ isotropic resolution, 10 b0, 90 q-space samples over 2 shells with $$$b=\{700,2000\}\,\text{s/mm}^2$$$, $$$TE=78\text{ms}$$$ and $$$TR=7700\text{ms}$$$. All images were processed with the Connectome Mapping Toolkit7. The code is freely-available at https://www.cmtk.org. Whole-brain tractography was performed using the probabilistic iFOD2 algorithm8 with all the possible combinations of the following parameters: step size $$$1\text{mm}$$$, angle=(20,30,40,45,50,60), number of streamlines=(40K,75K,100K,125K, 250K,500K,1M,2M). Only streamlines for which the end points reach the grey matter up to $$$2\text{mm}$$$ of radial search were selected. The tissue model was set as follows: $$$d_\parallel=1.7\cdot10^{-3}\,\text{mm}^2/\text{s}$$$, $$$d_\text{iso}=(1.7,3.0)\cdot10^{-3}\,\text{mm}^2/\text{s}$$$ and 7 different values for $$$d_\perp$$$. Arcuate fascicles (AF), cortico spinal tract (CST), and superior longitudinal fasciculus (SLF) of the both hemispheres were extracted using the White Matter Query Language (WMQL)9.
Result and discussion
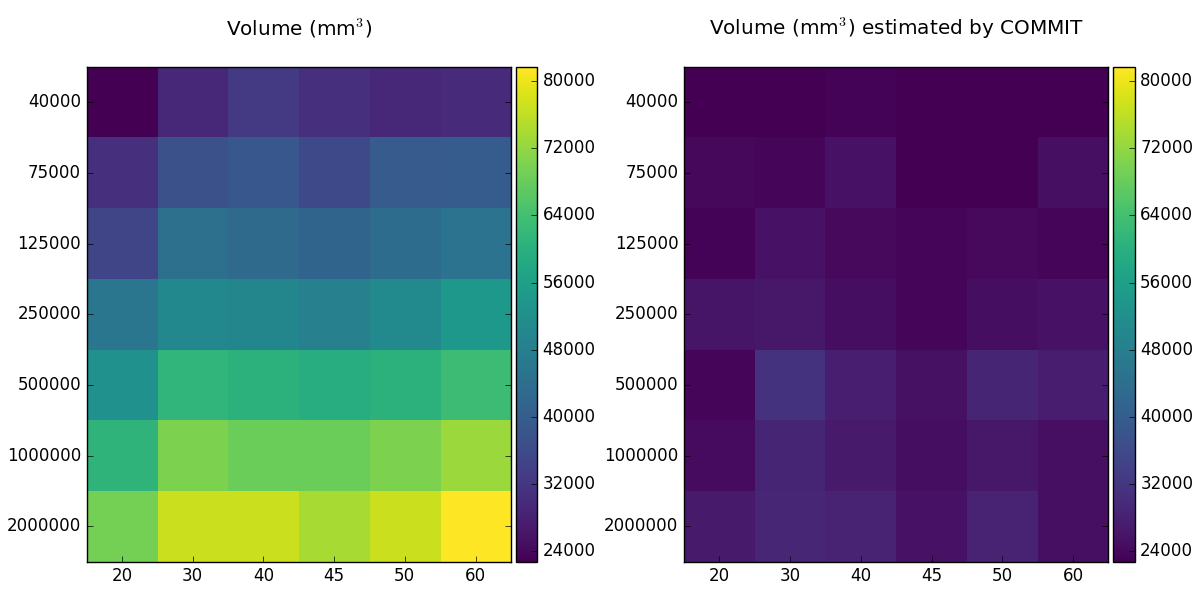
Figure 1 shows the volume variability of the AF left with respect to varying angles and number of streamlines for a single subject. Here, we compare the results between the original tractograms (left) and the streamlines filtered with COMMIT (right). The most obvious finding to emerge from this study is that with only tractography (left) the estimated volume increases with the number of streamlines and angle. However, if we use a framework that associate microstructure estimates (right), the volume bundle, compared to the original tractograms, saturate at lower stages and provide always measures. This new approach opens the possibility to develop more robust volumetric studies.
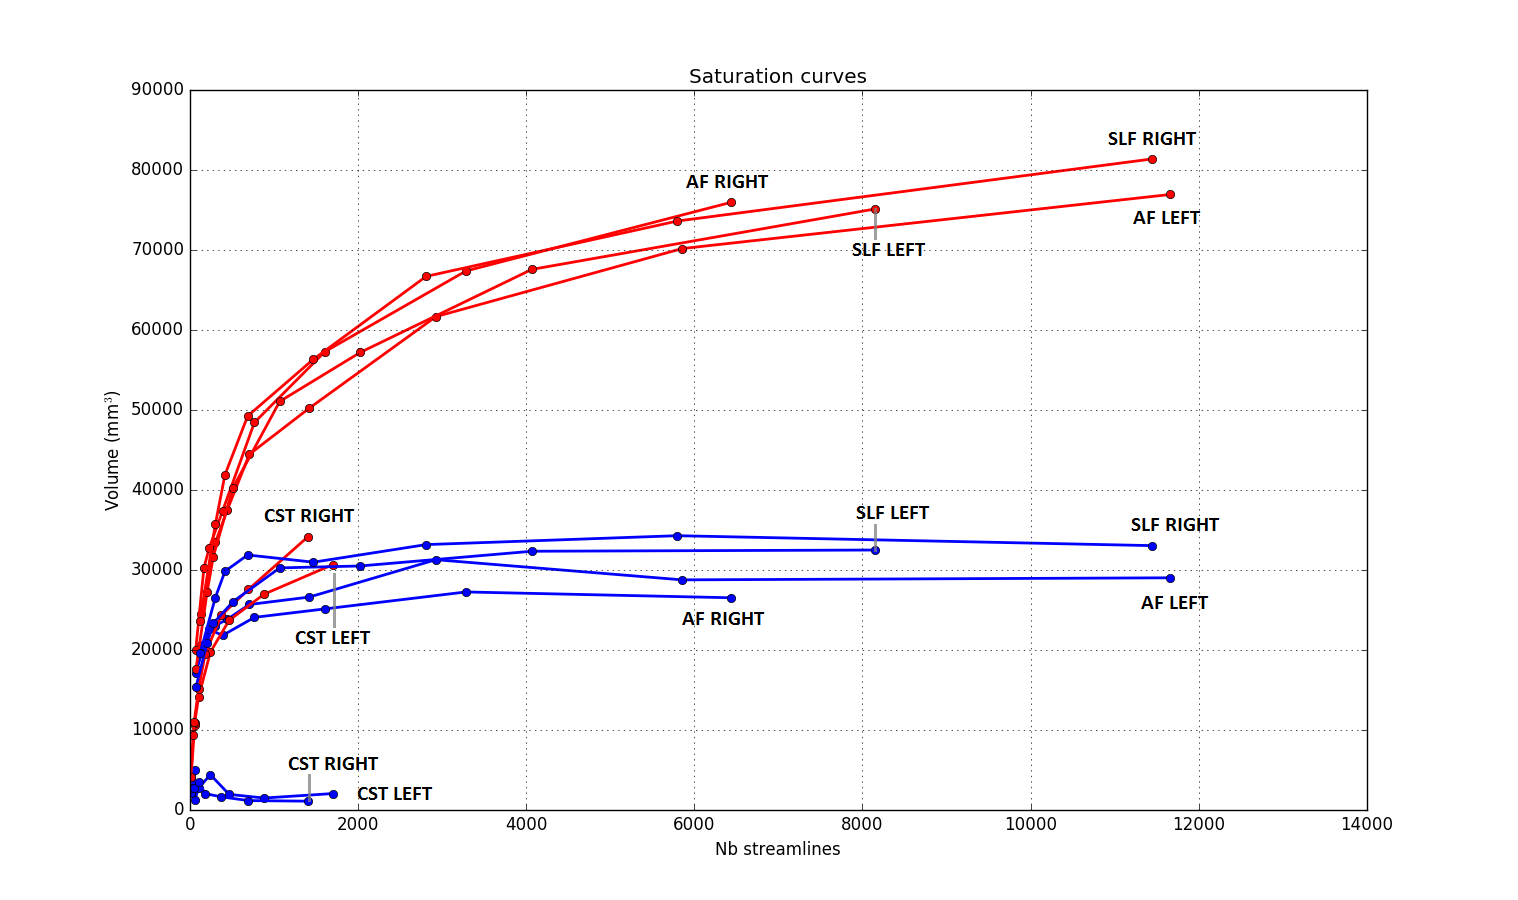
In Figure 2 we show the saturation curve for all the bundles for one subject with angle=30. To help visualization 2 color are chosen: red for the original tractogram and blue for the tractogram filtered with COMMIT. For each bundle, the points represent the volume related to number of streamline of that bundle. For each bundle, the progression of the points is related to the number of streamlines of the whole-brain tractogram. Here, we show that if we use a microstructure informed tractography technique, the volumes of all the bundle selected achieve saturation earlier(blue curves) compared to the method without microstructure filtering(red curves).
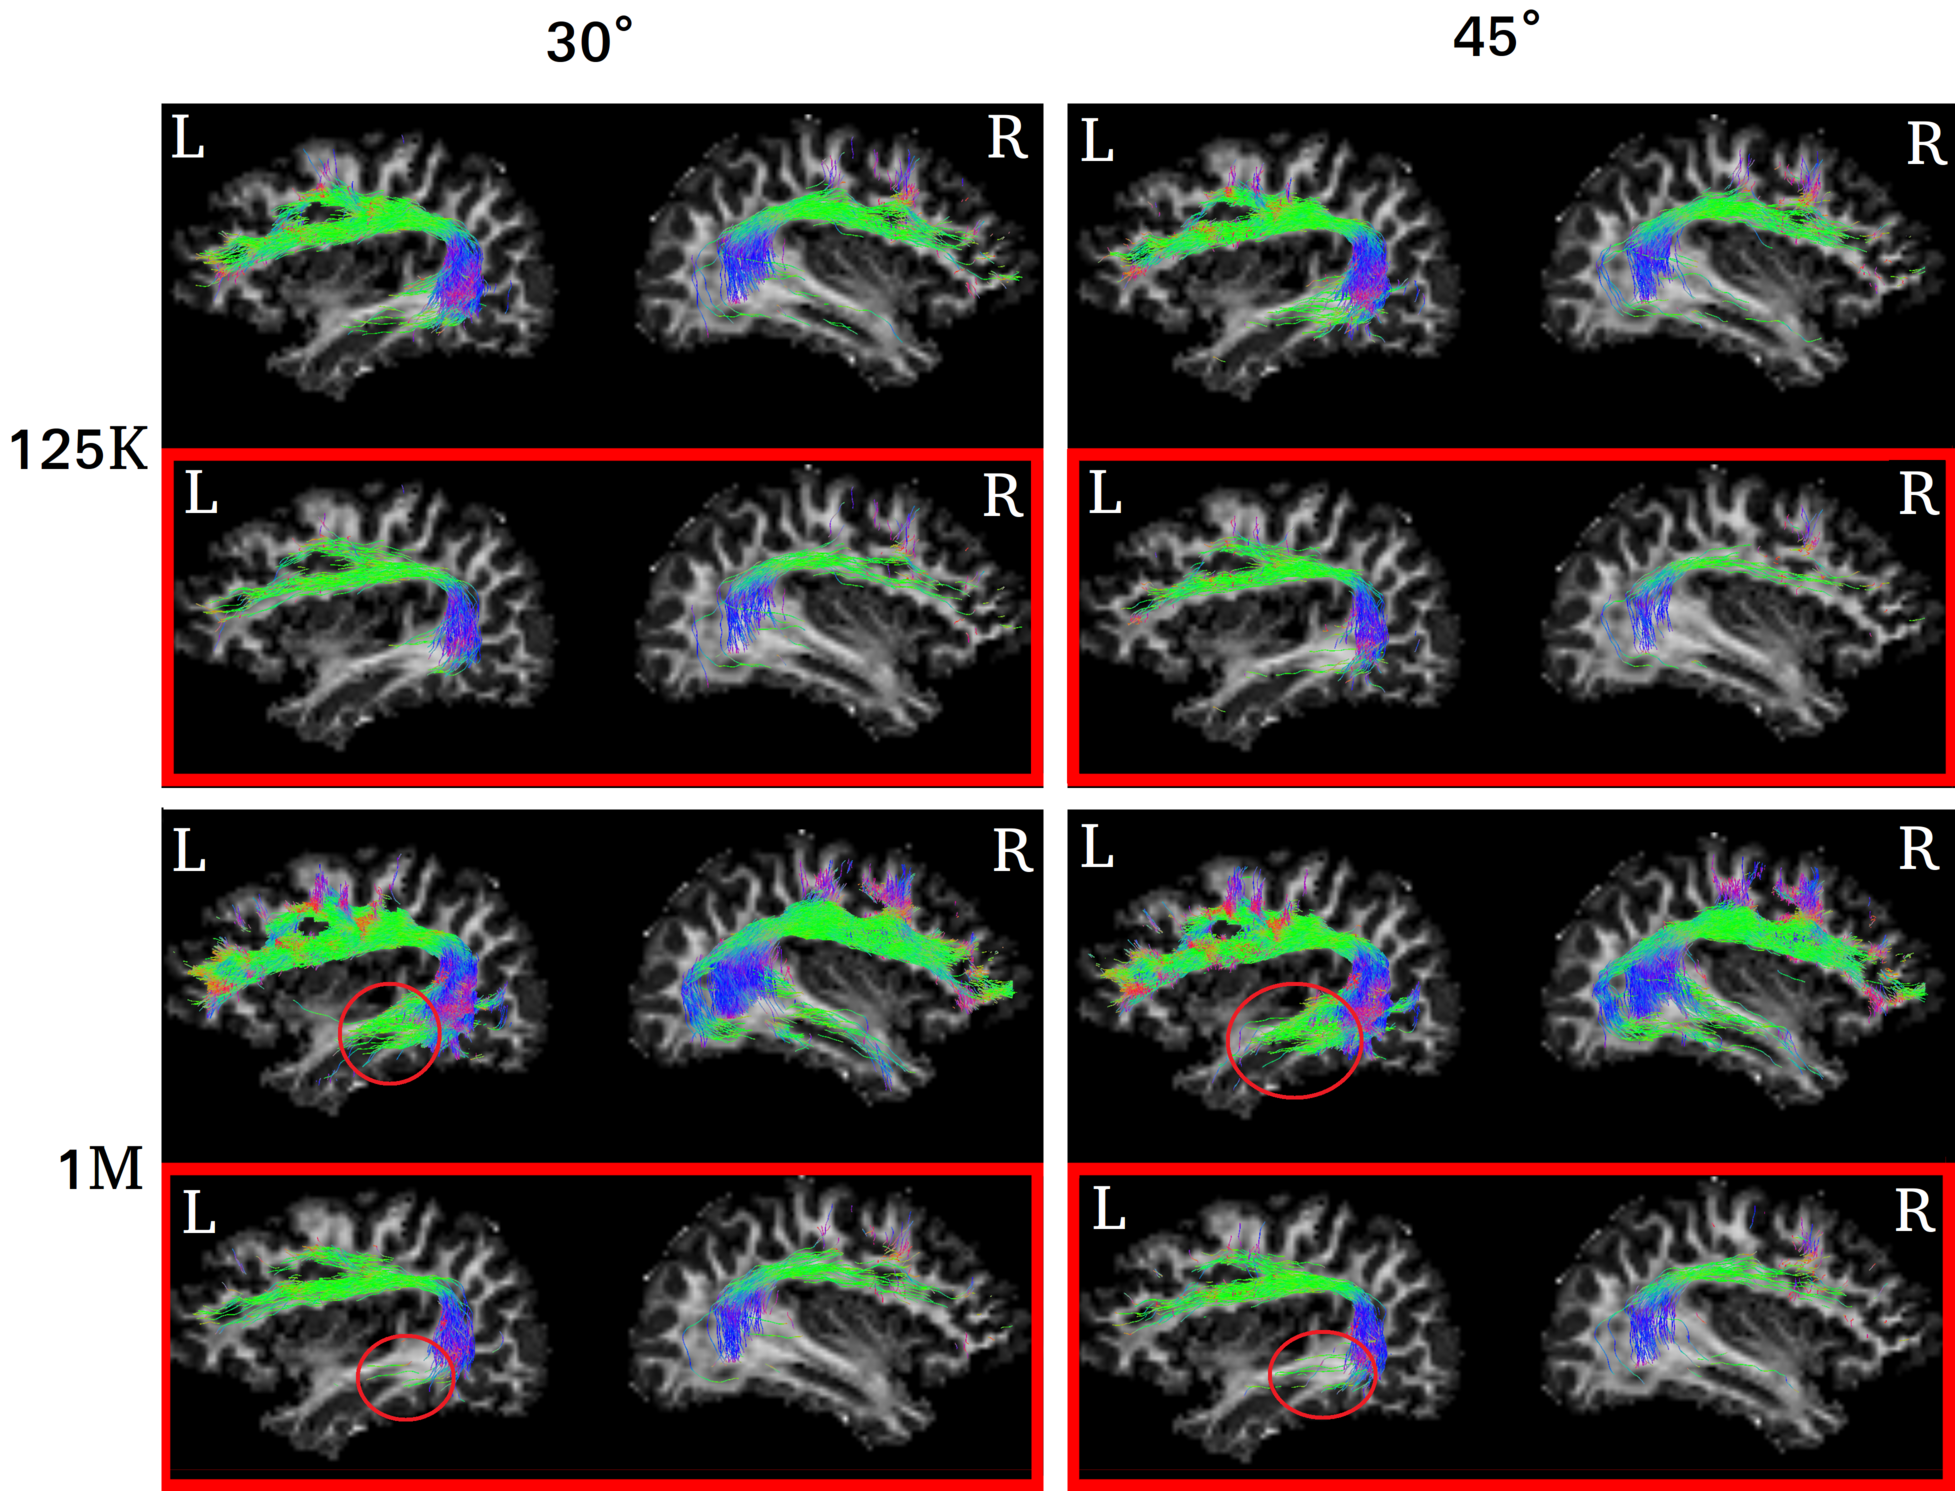
Ultimately, in Figure 3 we present a visual example on the AF. The comparison is done using number of streamlines=(125K,1M) and angle=(30,45) for one subject. The figure shows that the filtering done using microstructure information tend to preserve the core of the bundle. Anatomically, the AF arches down and comes to sit close the inferior-fronto-occipital fascilus (IFOF), which results inappropriate extension of AF fibers to the IFOF region highlighted by the red circles. The filtering performed by the COMMIT framework, in the red boxes, removes these green fibers from the AF bundle. However, this remains to be more extensively validated.
Conclusion
The purpose of the current study was to determine if microstructure informed tractography can report more quantitative volume bundles estimates. The results of this investigation shows that this technique achieve volume saturation earlier. These finding may have profound implications in estimating more robust volume measurements by removing streamlines that are introduced improperly by tractography. Furthermore, a natural progression of this work is to analyse if microstructure informed tractography reports significant results in pathological disorders.Acknowledgements
No acknowledgement found.References
1. Catani M, Howard RJ, Pajevic S, and Jones DK. Virtual in vivo interactivedissection of white matter fasciculi in the human brain. NeuroImage, 17(1):77 – 94, 2002.
2. Côté M-A, Girard G, Boré A, et al. Tractometer: Towards validation of tractography pipelines.Medical Image Analysis, 17(7):844 – 857, 2013. Special Issue on the 2012 Conference on Medical Image Computing and Computer Assisted Intervention.
3. Gauvin A, Petit L and Descoteaux M. SATA: Achieving volume saturation of streamline bundles in tractography. ISMRM Workshop, 2016.
4. Daducci A, Dal Palú A, Lemkaddem A, and J.-P. Thiran. A convex optimization framework for global tractography. In Proc. IEEE ISBI, pages 524–7, April 2013.
5. Daducci A, Dal Palú A, Lemkaddem A, and J.-P. Thiran. COMMIT: Convex OptimizationModeling for Microstructure Informed Tractography. IEEE Trans Med Imaging, 33(1):246–57,2014.
6. Panagiotaki E, Schneider T, Siow B, et al. Compartment models of the diffusion MR signal in brain white matter: A taxonomy and comparison. NeuroImage, 59(3):2241–2254, 2012.
7. Daducci A, Gerhard S, Griffa A, et al. The connectome mapper: An open-source processing pipeline to map connectomes with mri. PLoS ONE,7(12):1–9, 12 2012.
8. Tournier J, Calamante F, Connelly A, et al. MRtrix: diffusion tractography incrossing fiber regions. Int J Imaging Syst Technol, 22(1):53–66, 2012.
9. Wassermann D, Makris N, Rathi Y, et al. The white matter query language: a novel approach for describing human white matter anatomy. Brain Structure and Function, pages 1–17, 2016.
Figures