3472
Scan-rescan of AxCaliber, macromolecular tissue volume and g-ratio in the spinal cord1NeuroPoly Lab, Institute of Biomedical Engineering, Polytechnique Montreal, Montreal, QC, Canada, 2A.A. Martinos Center for Biomedical Imaging, Massachusetts General Hospital, Harvard Medical School, Boston, MA, United States, 3Montreal Heart Institute, Montreal, QC, Canada, 4Functional Neuroimaging Unit, CRIUGM, Montreal, QC, Canada
Synopsis
Translating quantitative MRI to clinical research raises many challenges in term of
Purpose
Quantitative MRI proposes to extract a quantitative metric that is insensitive to the protocol parameters, coil excitation and reception profiles. Using these metrics, investigators would be able to track the progression of tissue over time and compare tissue properties between subjects. Quantitative metrics can be obtained from nearly any MRI contrast : from diffusion MRI, methods such as AxCaliber1 provide metrics sensitive to the axon diameter and density (metric fr); from T1-weighted images, Macromolecular Tissue Volume (MTV) can be obtained; by combining fr and MTV, a g-ratio-weighted quantitative metric can be obtained4,5. These techniques, however, raise many challenges in term of acquisition strategy, modeling of the MRI signal, artefact corrections and metric extraction. In this work, we wanted to validate the repeatability of this entire framework, from the acquisition to the extraction of the metrics using a template-based approach. We took advantage of the 300 mT/m gradients from the connectome scanner for estimating robustly AxCaliber metrics, MTV and g-ratio in the spinal-cord of eight healthy subjects, scanned and rescanned in two different sessions.Methods
Acquisition. Experiments were performed in 8 healthy subjects (28+/-10, 3 males) using a high-gradient (Gmax=300mT/m) 3T MRI scanner (CONNECTOM) equipped with a 64-channel head/spine coil6. AxCaliber and MTV protocols were acquired in less than 30min with the following parameters. Diffusion: 2D single-shot spin-echo EPI with rFOV (two saturation bands, matrix 70x70, spacing 0.8x0.8x5mm, 4 slices at intervertebral disks C1 to C4). 575 images (40 b=0, δ=3/3/6/8/10ms, ∆=20/40/20/36/30ms, TE=57/73/67/76/75ms, Gmax=√2*300=424mT/m). MTV: B1+ mapping with double-angle method (spin-echo EPI, FA=60/120°, TE=13ms, TR=7s, matrix 64x64x20); Three 3D FLASH (FA=4,10,20°, TE=2.74ms, TR=30ms, matrix 192x192x22, spacing 0.8x0.8x5mm, GRAPPA R=2).
Processing: Raw diffusion and FLASH volumes were motion corrected using the Spinal Cord Toolbox (SCT) (http://sourceforge.net/projects/spinalcordtoolbox/)7 MTV was computed as in [8] and registered to mean DWI, AxCaliber and g-ratio were computed as in [5]. Lastly, mean DWI volumes were registered slice-by-slice to the MNI-Poly-AMU template using SCT. This processing resulted in four slices located at each intervertebral disk C1/C2/C3/C4. The atlas of spinal-cord tracts was used to extract each metric in each spinal-cord pathway. Note that the rescanned volumes were not registered to the scan, but directly to the template.
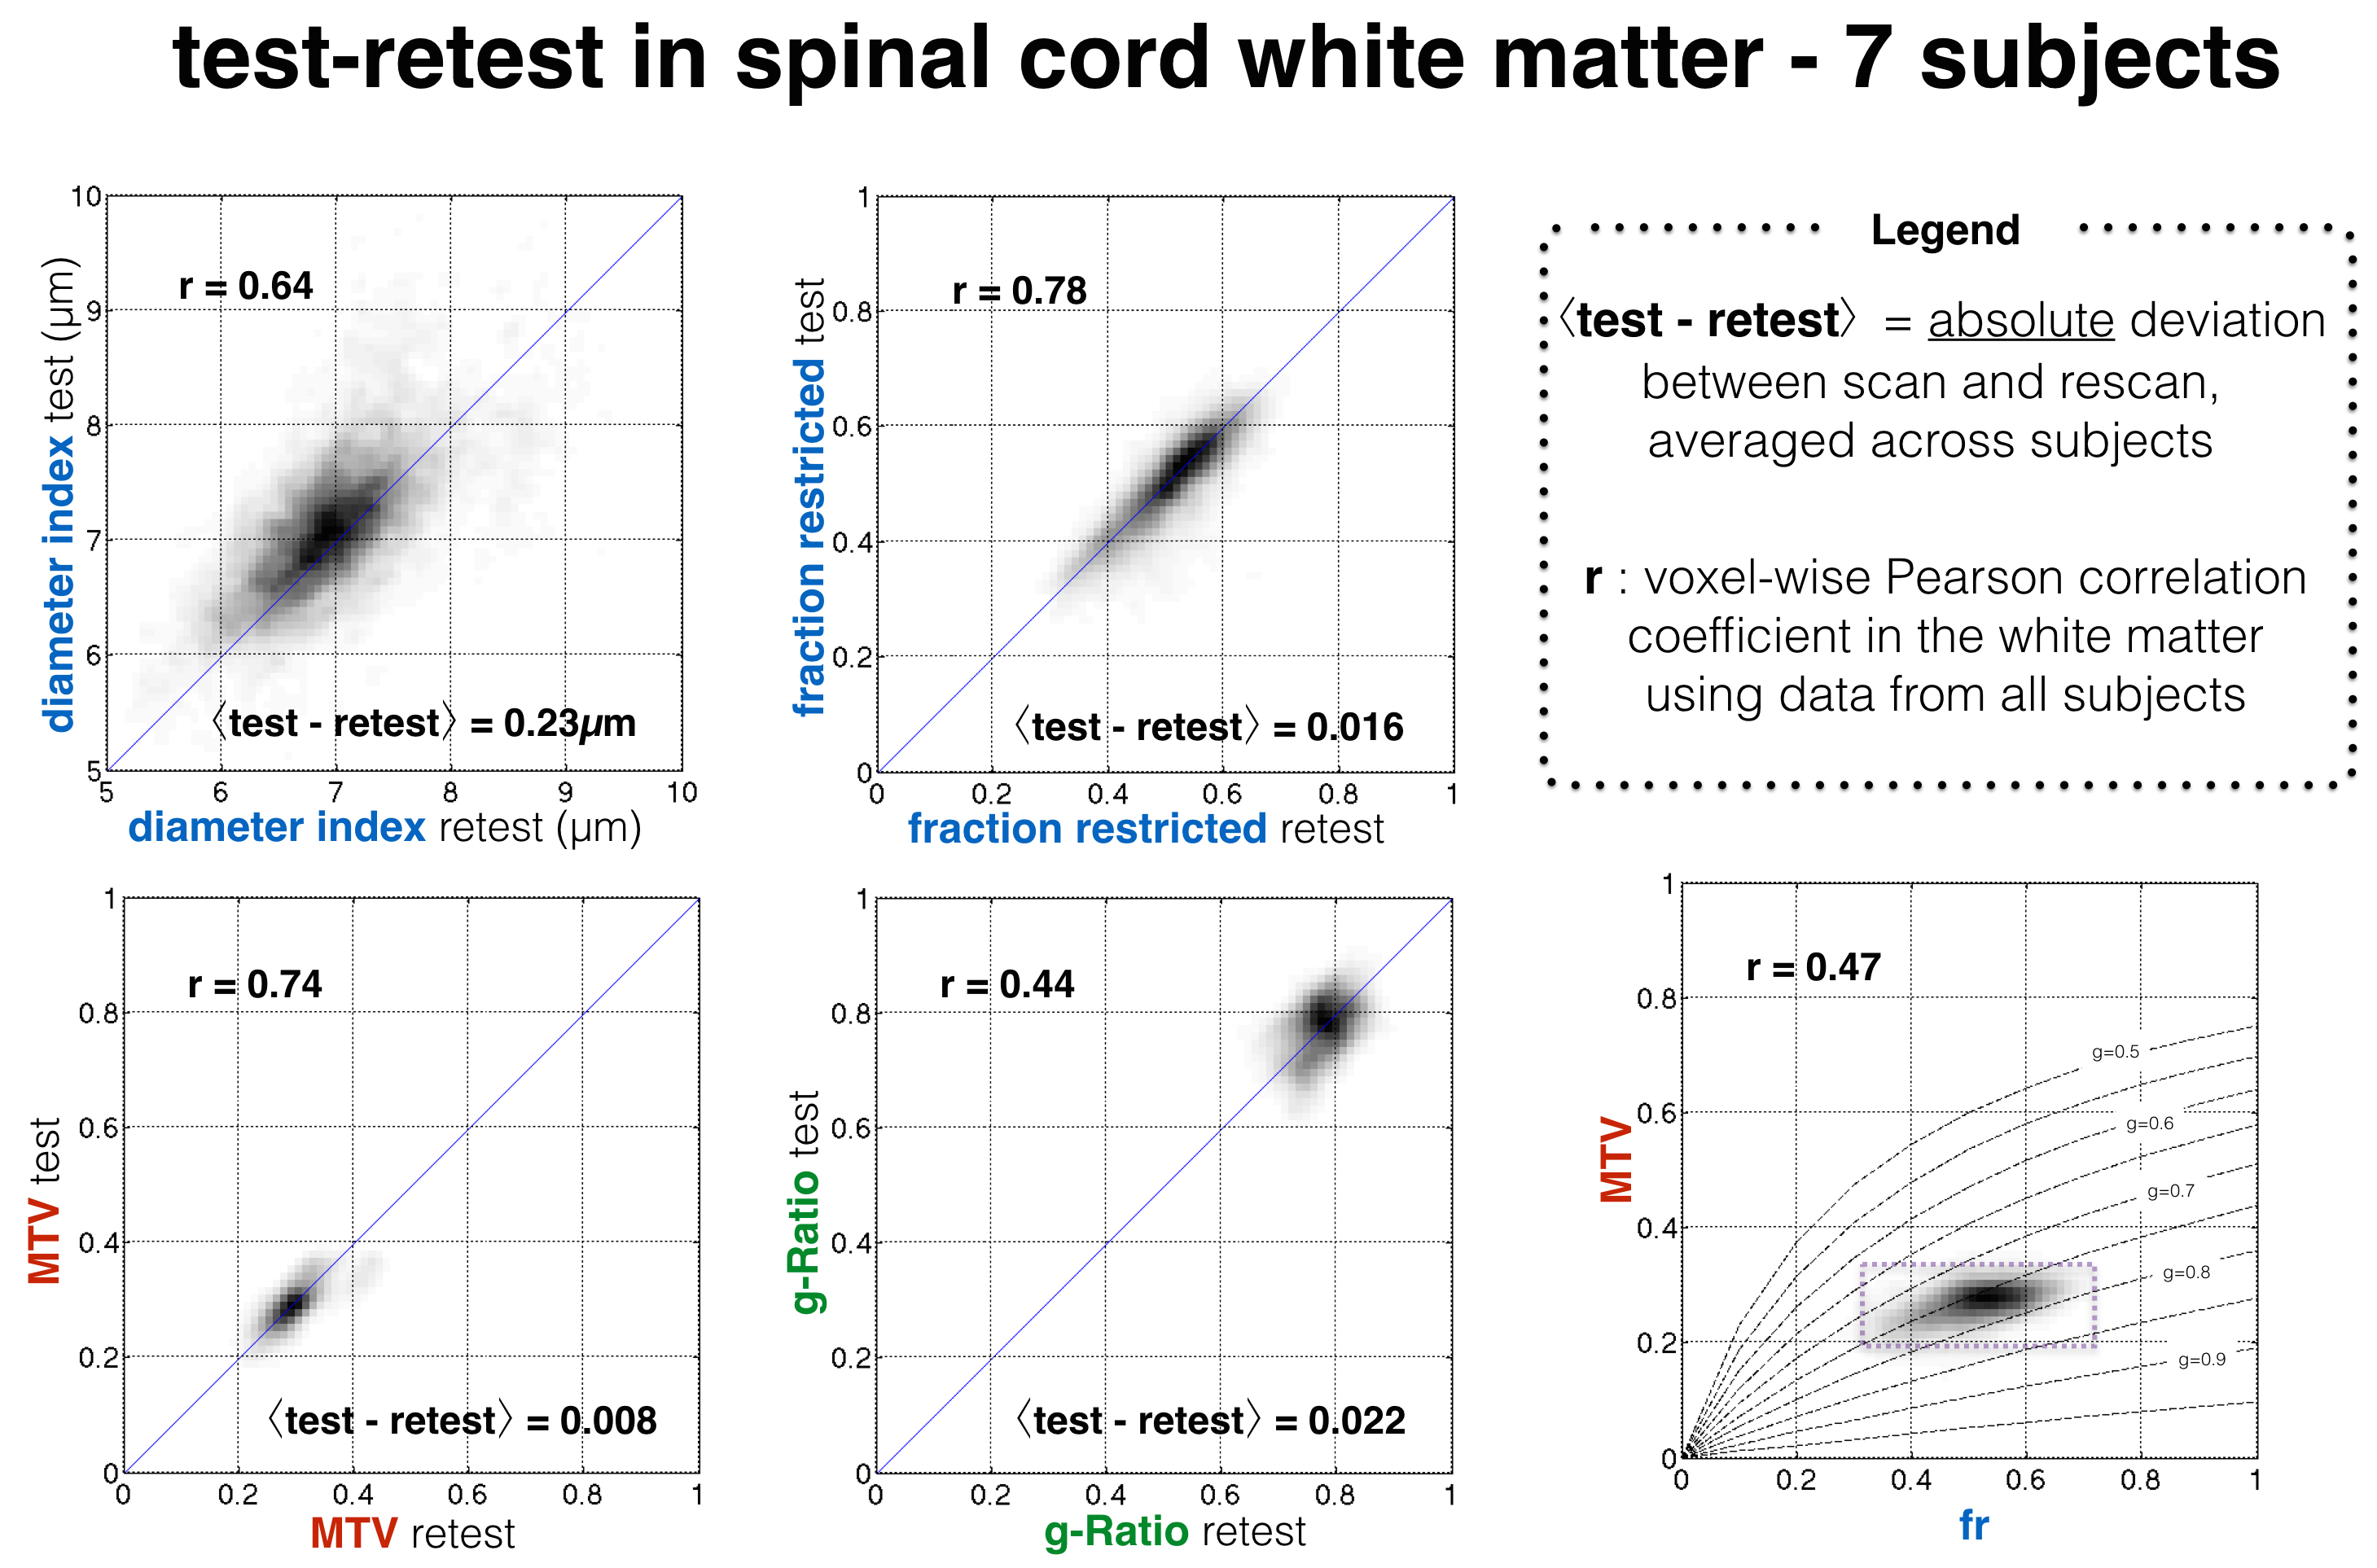
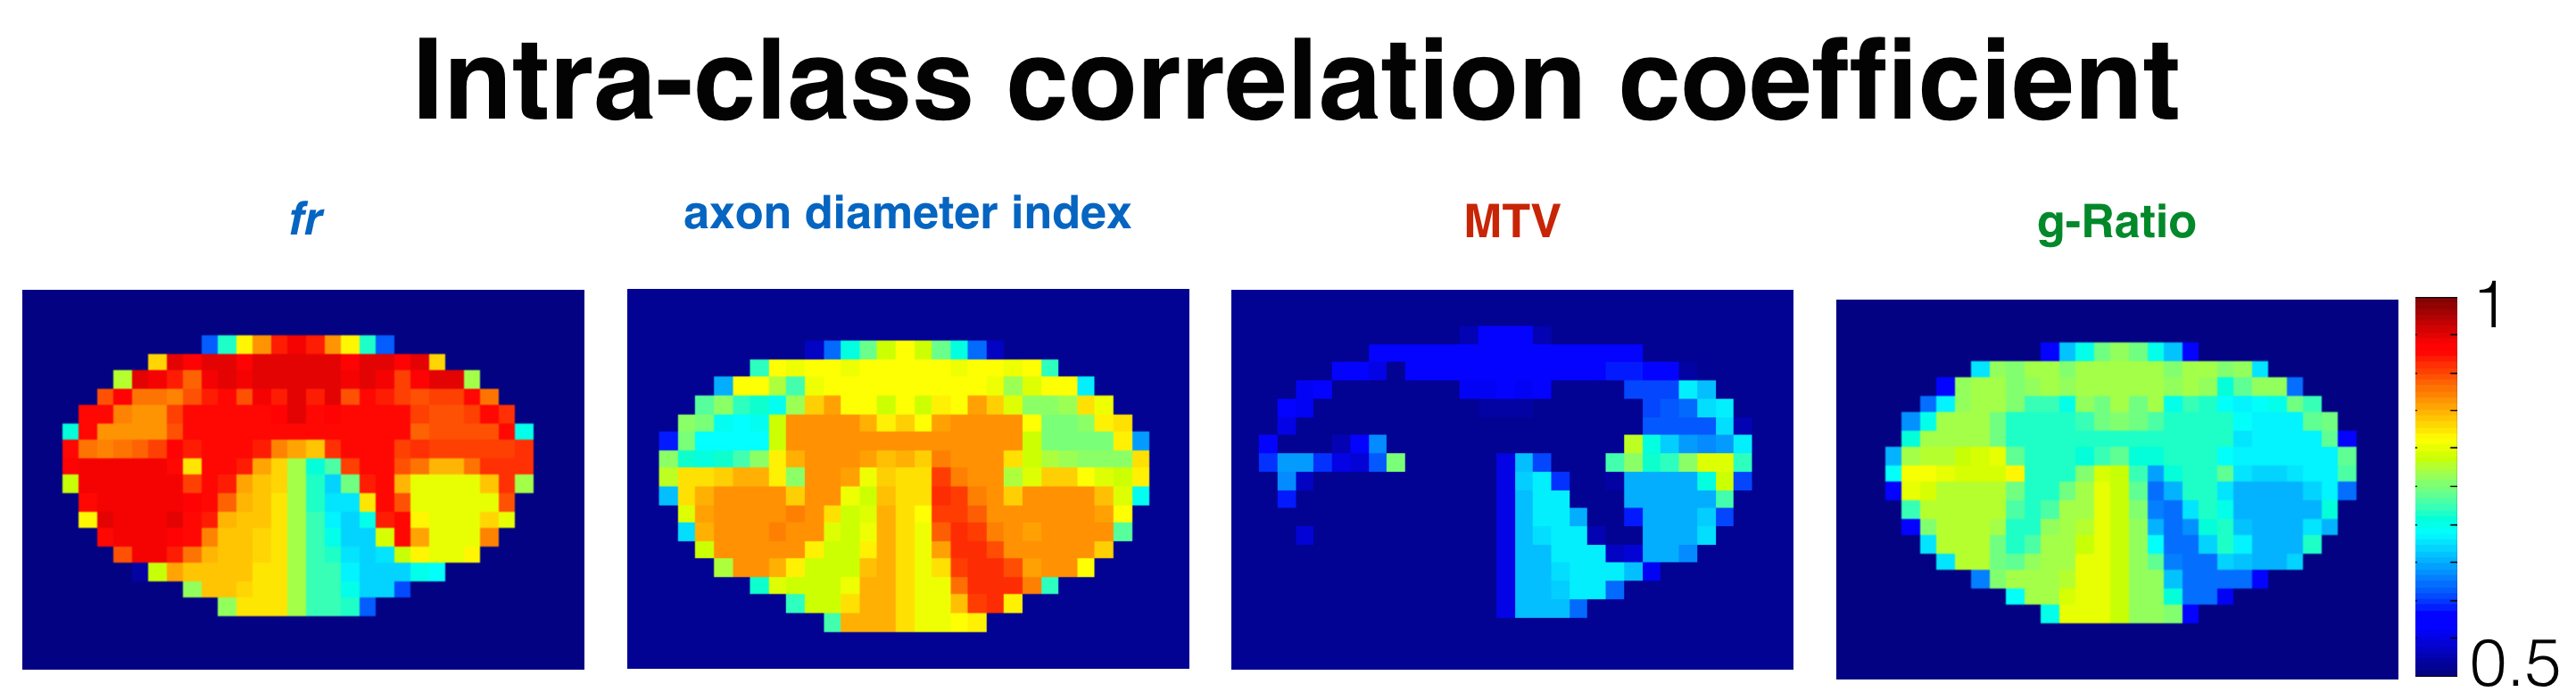
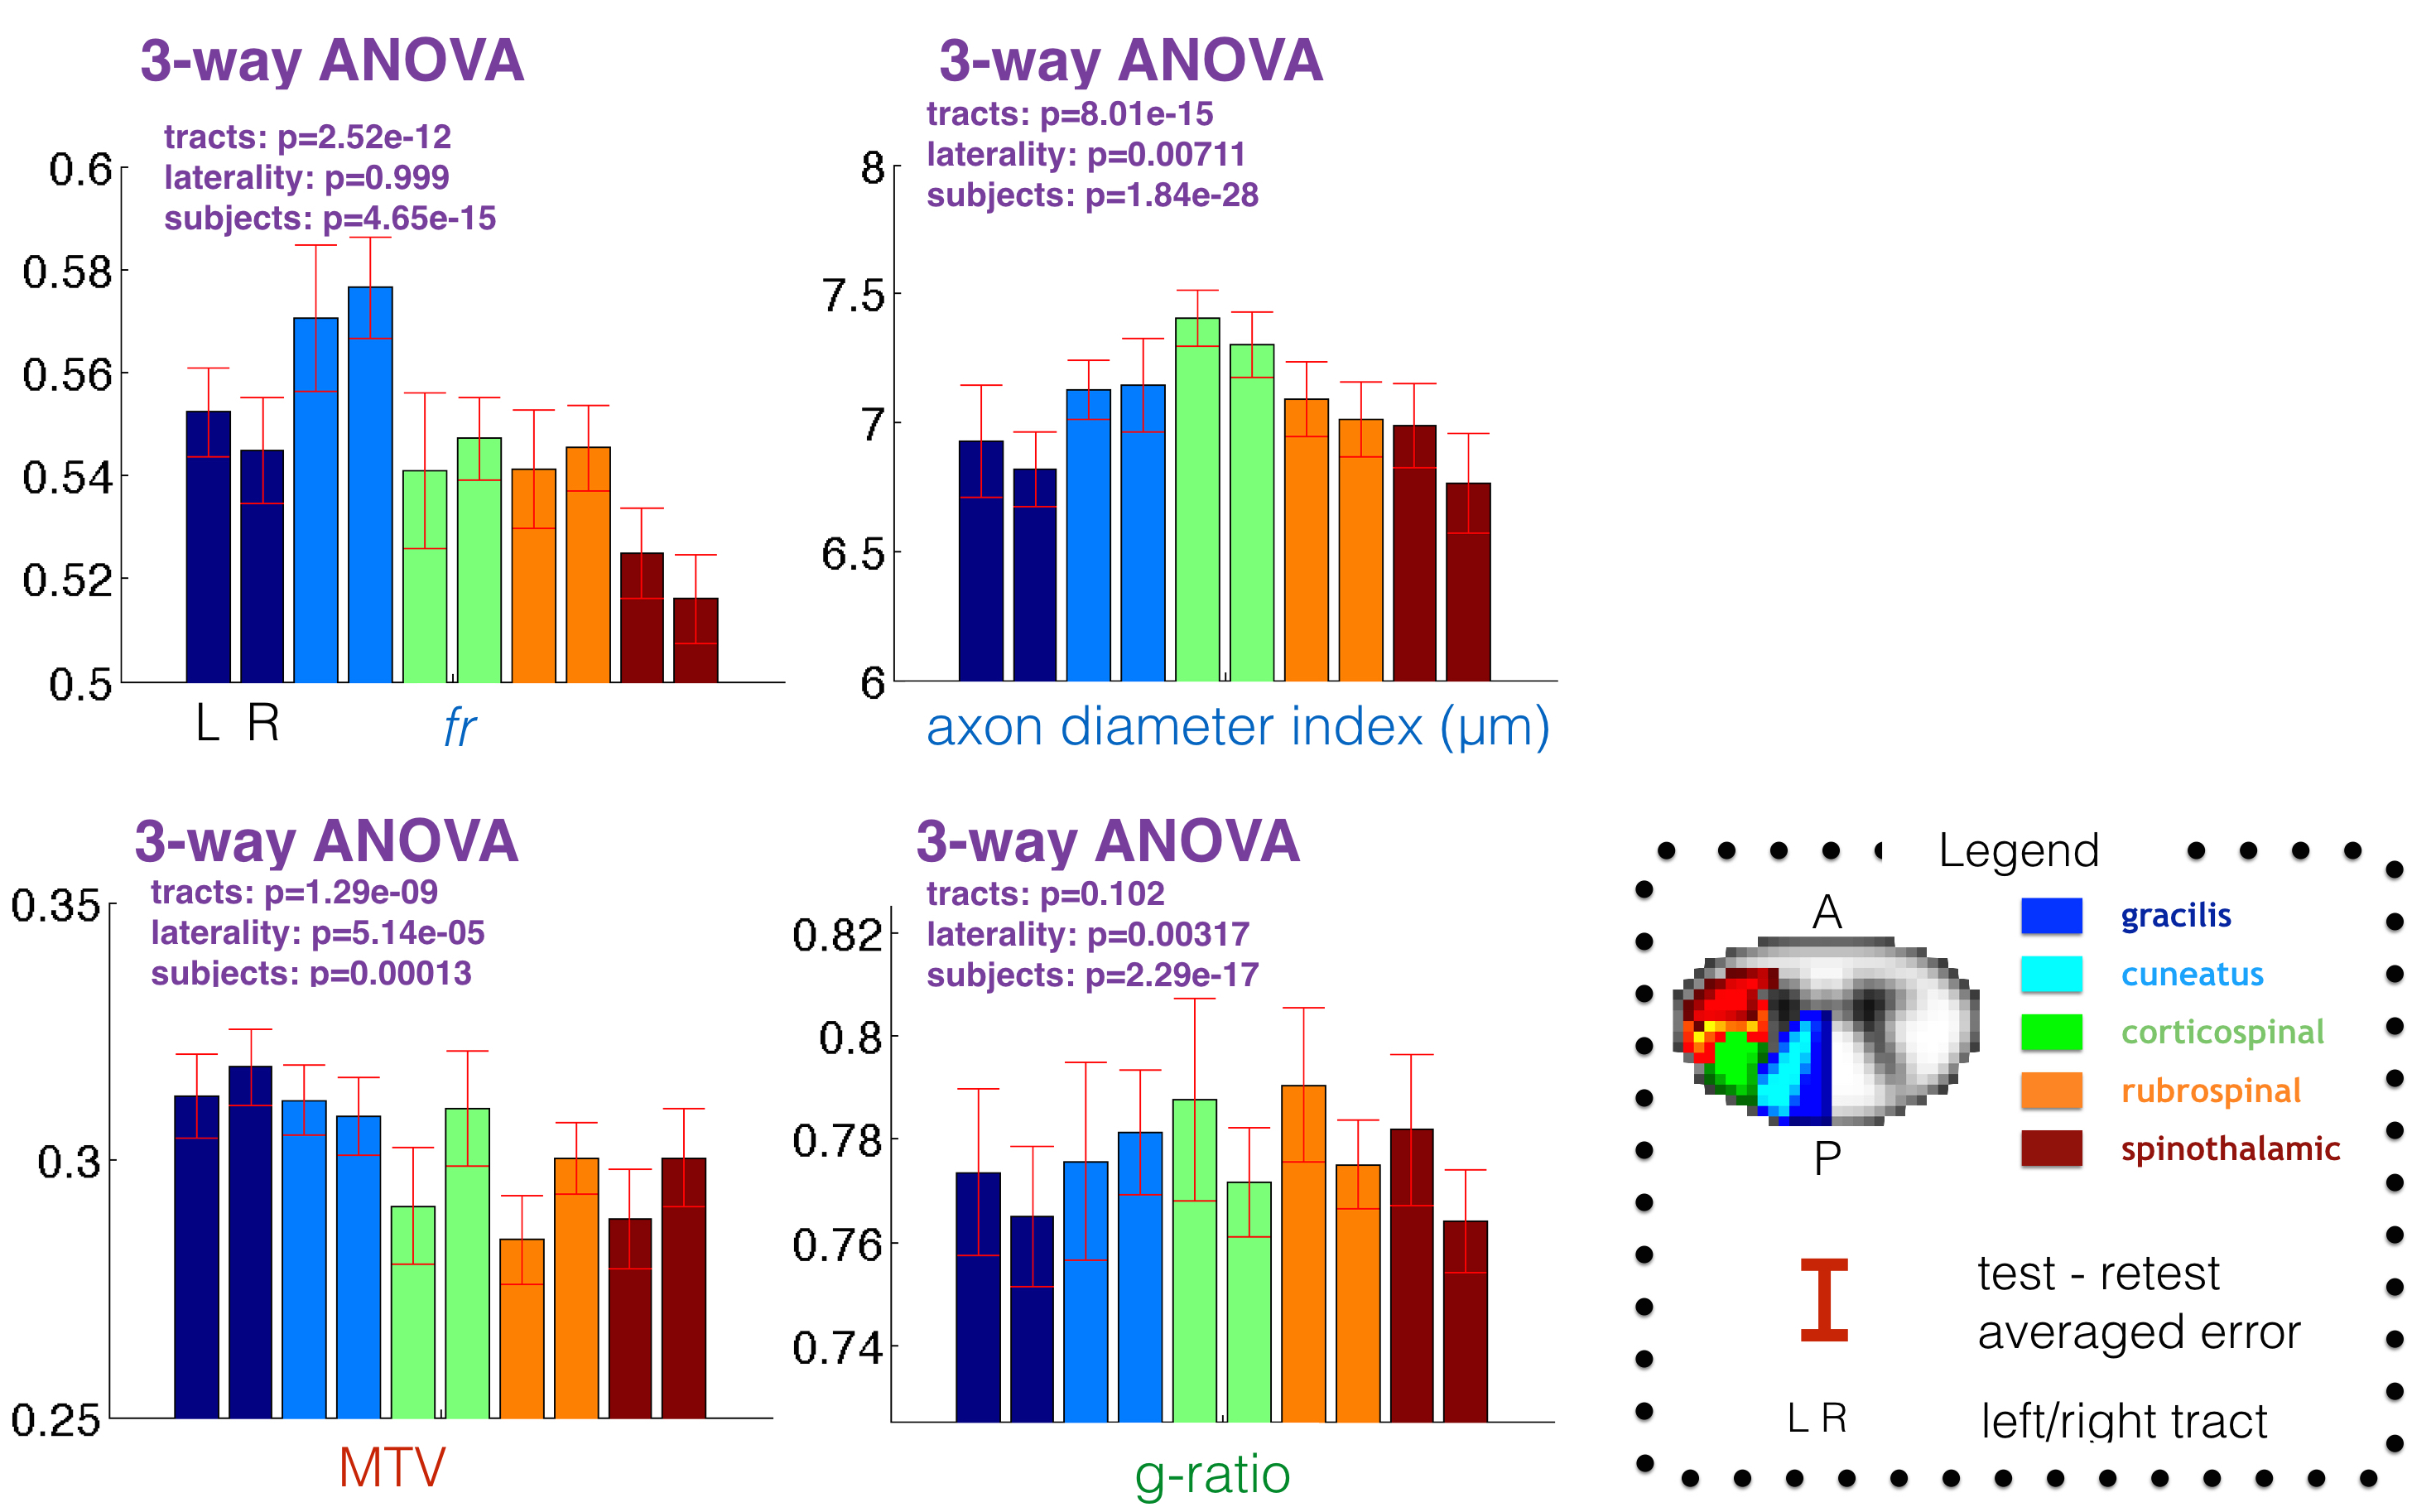
Statistics. In order to validate the reproducibility of the metrics, as well as the registration to the template, the voxel-wise correlation between scan and rescan was computed using the white matter template (thresholded over 0.7). To assess the accuracy, the absolute scan-rescan deviation was computed per subject, then averaged across subjects. In order to assess the capability of these metrics to detect reliable differences between subjects, the Intra-Class correlation coefficient (ICC) was computed in each spinal-cord tract. Finally, a three-way ANOVA was done to assess the capability to detect significant differences between tracts, subjects and laterality (left/right). Subject #3 was discarded from the study due to particularly strong movements during the scan.
Results
Figure 1 shows the voxel-wise comparison of test versus retest from all subjects and for each metric. fr and MTV showed a particularly good correlation (r>0.74) and low deviation between scan and rescan (<2%). Fig 2 shows the ICC obtained per tract for all subjects. Metric fr was particularly sensitive to differences between subjects (ICC>0.9) in the gray matter, ventral and lateral tracts. The axon diameter index detected differences between subjects in the motor tract, and the left cuneatus (ICC>0.8). Figure 3 shows the results of the ANOVA: all metrics, except g-ratio, could detect reproducible differences between tracts.Discussion
fr and MTV, which is confirmed by the voxel-wise correlation and the ANOVA analysis. A worse correlation coefficient was found for g-ratio (r=0.44), that we attribute to unstable values when both fr and MTV are small (at the periphery of the spinal-cord) and to the small dynamic range of this metric in healthy tissue due to the correlation between MTV and fr (r=0.47) that follows the line of iso-gratio (g=0.75) (Fig 1). The large ICC found in ventral and peripheral tracts for metric fr was found to be significantly (p<0.05) related to cross-sectional area of the spinal-cord (r=-0.6 in average in these tracts). This negative relationship discards the hypothesis of CSF and gray matter contamination in smaller spinal-cord, but can be explained by higher spatial constraints in smaller spinal-cords, leading to higher density of axons.
Conclusion
We demonstrate the feasibility to extract robustly AxCaliber, MTV and g-ratio metrics in the different spinal-cord tracts and detect significant differences between healthy subjects and spinal-cord tracts. This framework could be useful for assessing demyelination in diseases such as multiple sclerosis.Acknowledgements
Study funded by MS Society of Canada, SMRRT (CIHR), National Institutes of Health Blueprint Initiative for Neuroscience Research grant U01MH093765, National Institutes of Health grant P41EB015896, Canada Research Chair, FRQS, FRQNT, QBIN and NSERC.References
[1] Y. Assaf et al., Magn. Reson. Med., 2008, 59, 1347.
[2] E.K. Fram et al., Magn. Reson. Imaging, 1987, 5, 201.
[3] A. Mezer et al., Nat. Med., 2013, 19, 1667.
[4] N. Stikov et al., Neuroimage, 2011, 54, 1112.
[5] T. Duval et al., Neuroimage, 2016.
[6] B. Keil et al., Magn. Reson. Med., 2013, 70, 248.
[7] B. De Leener et al., Neuroimage, 2016.
[8] A. Mezer et al., Hum. Brain Mapp., 2016, 37, 3623.
Figures