3470
Diffusion-weighted MRI of node tissue: correlation of mean diffusivities and cellularity.1Faculty of Health Sciences, The University of Sydney, NSW, Australia, 2Centre for Advanced Imaging, University of Queensland, Brisbane, Australia, 3The Strathfield Breast Centre, NSW, Australia, 4Biological Resources Imaging Laboratory, University of New South Wales, NSW, Australia, 5Tissue Pathology and Diagnostic Oncology, Royal Prince Alfred Hospital, NSW, Australia, 6Westmead Breast Cancer Institute, NSW, Australia, 7Concord Repatriation General Hospital, NSW, Australia, 8Vetnostics, NSW, Australia
Synopsis
Improvement of sensitivity and specificity in DWI-based assessment of nodal diseases is dependent on a better understanding of how nodal microstructures affect the water diffusivity in tissue. In this abstract we report the first diffusion microimaging investigation of formalin fixed node tissue with the aim of assessing any correlation between mean diffusivity and cellularity. Mean diffusivity was calculated in ROI corresponding to distinct node sub-structures. Nuclei were segmented semi-automatically to measure the cellularity metrics: nuclear count and nuclear area. The results showed there is no significant correlation between mean diffusivity with cellularity metrics in the nodal tissues.
Introduction
Diffusion-weighted MRI (DWI) is increasingly being used for detection and assessment of primary tumours but has limited application in secondary diseases such as nodal diseases due to considerable overlap in the range of diffusivities reported for malignant and benign nodes1,2. Changes in diffusivity are commonly attributed to variations in ‘cellularity’ although outside brain tissue evidence is limited. In prostate tissue, changes in partial volume of tissue components with distinct diffusivities (stroma/epithelium/lumen) correlate more strongly with measured ADC than cellularity metrics3. Distinct diffusivities of tissue microstructures were reported in prostate and breast tissue4,5. Here we report a diffusion microimaging investigation of node tissue with the aim of assessing any correlation between mean diffusivity and cellularity.Methods
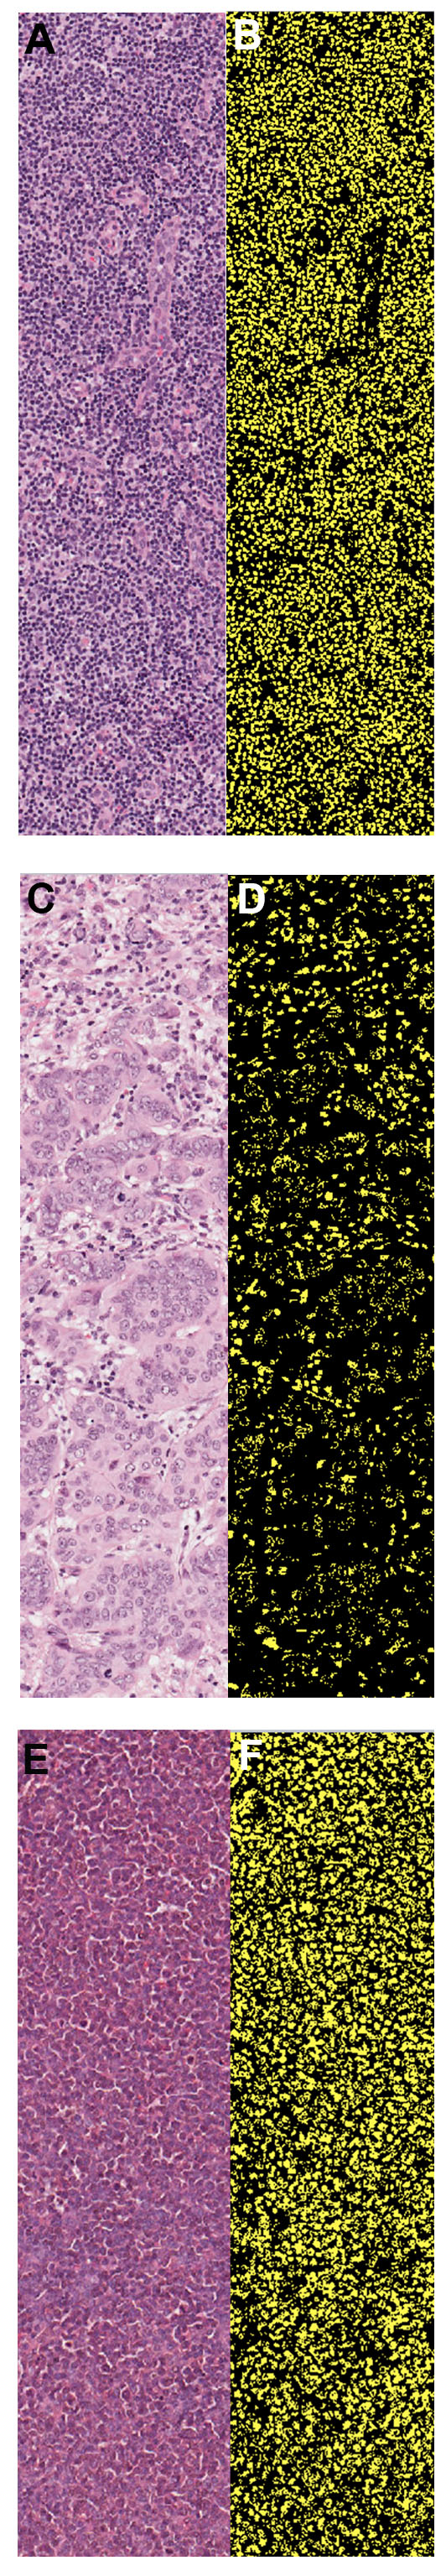
Twenty three formalin fixed node tissue cores (3-mm in diameter) were obtained from eleven subjects. Tissue cores were immersed in 0.2% v/v Magnevist and imaged in a Bruker AV700 with 16.4 T microimaging system (5 mm birdcage RF coil, Micro5 gradient set) using a 3D spin echo DTI sequence with TE/TR = 21/400 ms, δ/ Δ = 2/12 ms , and b-values of 50 ,196 , 435 , 766 , 1190 , 1700, 2307, and 3000 s/mm2 in 6 directions with two ‘b=0’ reference measurement at 40m isotropic resolution. Mean diffusivity (MD) was calculated in manually selected regions of interest (ROI) corresponding to distinct node sub-structures: parenchyma in benign, metastatic, and Non-Hodgkin lymphoma. Post imaging tissue was sectioned parallel to the MRI planes and stained with H&E stains. Nuclei were segmented semi-automatically (Figure 1) in Image Pro Premier and used to measure the cellularity metrics: nuclear count and nuclear area. Pearson correlation coefficient was used to compare MD with nuclear count and nuclear area. One way ANOVA with post hoc Tukey test was used to test the difference in MD and cellularity metrics.Results and Discussion
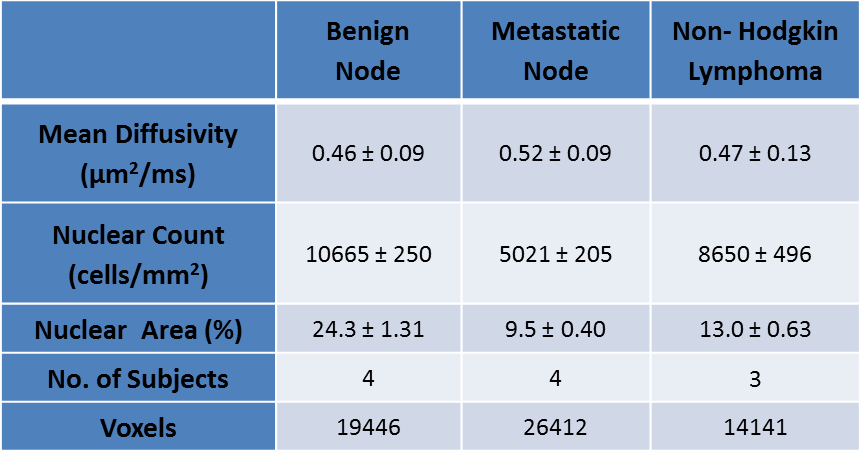
Table 1 summarizes the mean diffusivities (MD) values and cellularity measurements in the sub-structure of the node, parenchyma in three different nodal diseases. Distinct diffusivities were found in node sub-structures, higher diffusivity value was found in capsule region as compared to parenchyma region of the node (results not shown). No significant mean diffusivity differences (F = 2.93, p = 0.063) were evident in benign, metastatic and Non-Hodgkin lymphoma nodes. Benign and Non-Hodgkin nodes shows similar mean diffusivity values of (0.46 ± 0.09 µm2/ms) and (0.47 ± 0.13 µm2/ms) respectively. There were significant differences for the cellularity metrics: nuclear count ( F = 54.41, p < 0.05) and nuclear area ( F = 77.89, p < 0.05).
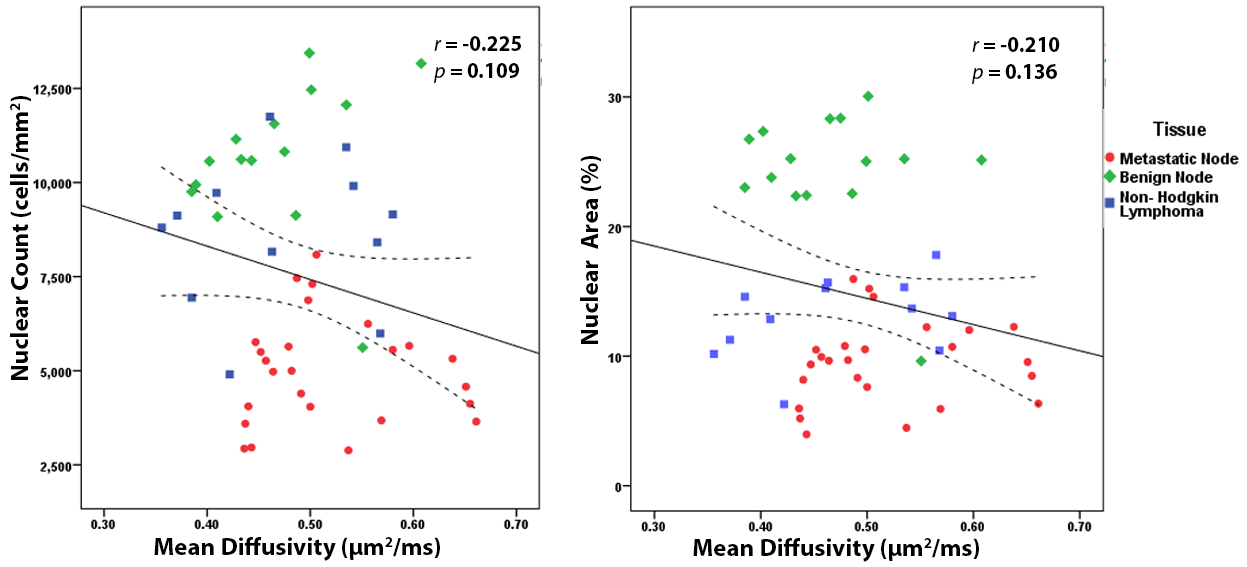
Figure 2 shows the correlation between mean diffusivity with cellularity metrics of the nodal tissue. Mean diffusivity shows no statistically significant correlation with nuclear count (r = -0.225, p = 0.109 ) and nuclear area ( r = -0.21, p = 0.136) (Figure 2). The result from this study was similar to the finding in prostate tissue where diffusivity correlates better gland components than cellularity3.
Conclusion
Diffusivity in parenchyma region of the three nodal diseases showed no significant difference. There is no significant correlation between mean diffusivity with cellularity metrics in the nodal tissues. This represents a first step towards improving our understanding of DWI-based clinical assessment of nodal disease.
Acknowledgements
No acknowledgement found.References
1. Sumi M, Van Cauteren M, Nakamura T. MR microimaging of benign and malignant nodes in the neck. American Journal of Roentgenology. 2006;186(3):749-57.
2. Kamitani T, Honda H, Hatakenaka M, et al. Detection of axillary node metastasis using diffusion-weighted MRI in breast cancer. Clinical Imaging. 2013;37(1):56-61.
3. Chatterjee A, Watson G, Myint E, et al. Changes in Epithelium, Stroma, and Lumen Space Correlate More Strongly with Gleason Pattern and Are Stronger Predictors of Prostate ADC Changes than Cellularity Metrics. Radiology.2015:142414.
4. Bourne RM, Kurniawan N, Cowin G, et al. Microscopic diffusivity compartmentation in formalin-fixed prostate tissue. Magnetic Resonance in Medicine. 2012;68(2):614-20.
5. Norddin N, Power C, Watson G, et al. Microscopic diffusion properties of fixed breast tissue: Preliminary findings. Magnetic Resonance in Medicine. 2014, (Early view doi:10.1002/mrm.25555).
Figures