3467
Diffusion radiomics analysis in intratumoral heterogeneity of murine prostate cancer following radiotherapy: pixel-wise correlation with histology1Dep. Medical Imaging and Intervention, Chang Gung Memorial Hospital, Taoyuan, Taiwan, 2Chang Gung University, Taoyuan, Taiwan, 3Dep. Radiation Oncology, Chang Gung Memorial Hospital, Taoyuan, Taiwan
Synopsis
To investigate the biological meaning of apparent diffusion coefficient (ADC) in tumors following radiotherapy. Five mice bearing TRAMP-C1 tumor were half-irradiated. Diffusion-weighted images were acquired using multiple b-values of up 0 to 3000 s/mm2. The pixelwise ADC positively correlated with extracellular space and nuclear size, and negatively correlated with nuclear count, cytoplasmic space and nuclear space. Optimal ADC was achieved at b-value of 800 s/mm2 in determining the treatment response. Pixelwise ADC values correlate with histology metrics might be a means of in vivo radiomics biomarkers for evaluating tumor heterogeneity and responses to radiotherapy.
Purpose
To investigate the biological meaning of apparent diffusion coefficient (ADC) values in tumors following radiotherapy (RT).Methods
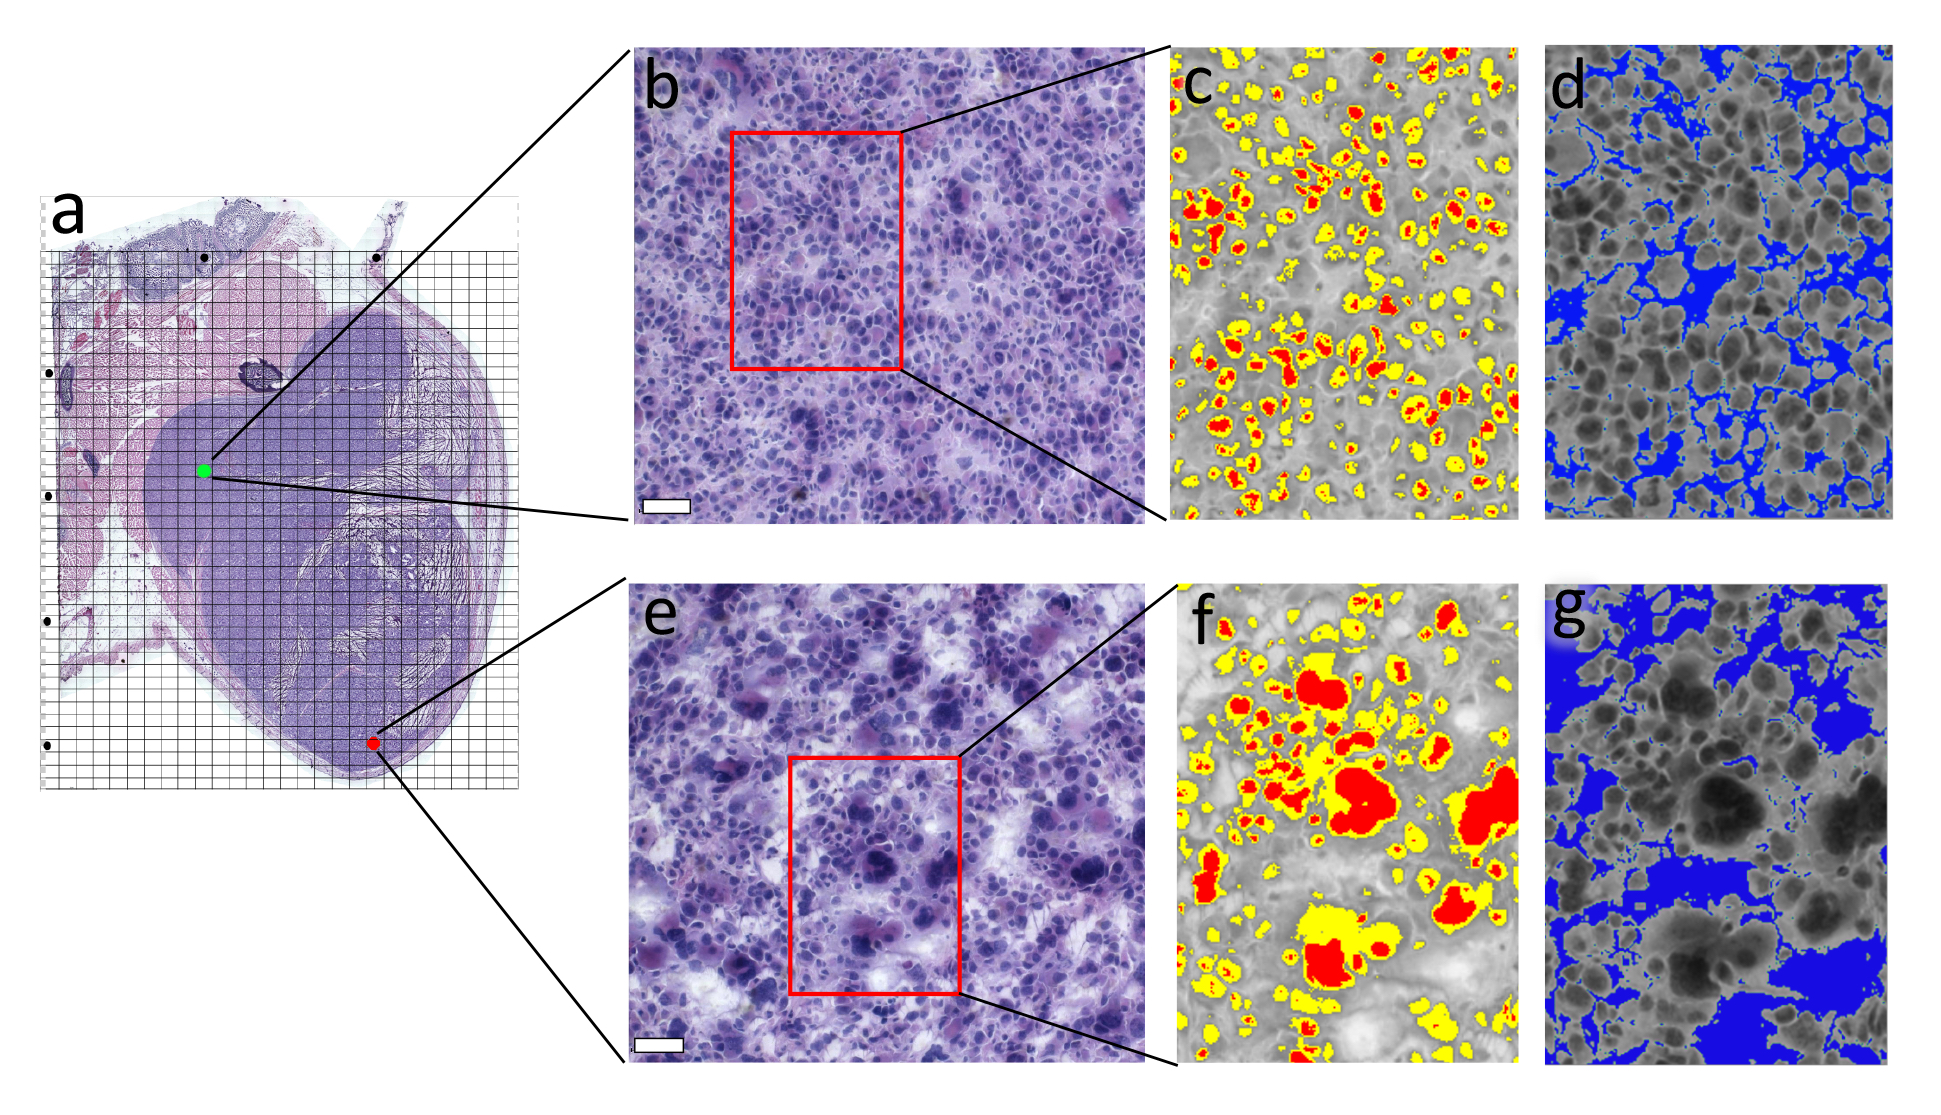
Five TRAMP-C1 murine tumor models were half-irradiated with single fraction dose of 15Gy. Diffusion-weighted images were acquired on a 7 Tesla MRI machine at day 6 using multiple b-values of 0 to 3000 s/mm2. A pre-embedding method 1 was used to match the orientation of MR imaging plane and histology slide. ADC values calculated using two-point estimate and mono-exponential fitting of signal decay were compared between the irradiated and non-irradiated regions of the tumor and were correlated pixel-by-pixel with histology metrics including nuclear count, nuclear size, nuclear space, cytoplasmic space and extracellular space 2 Fig(1).Results
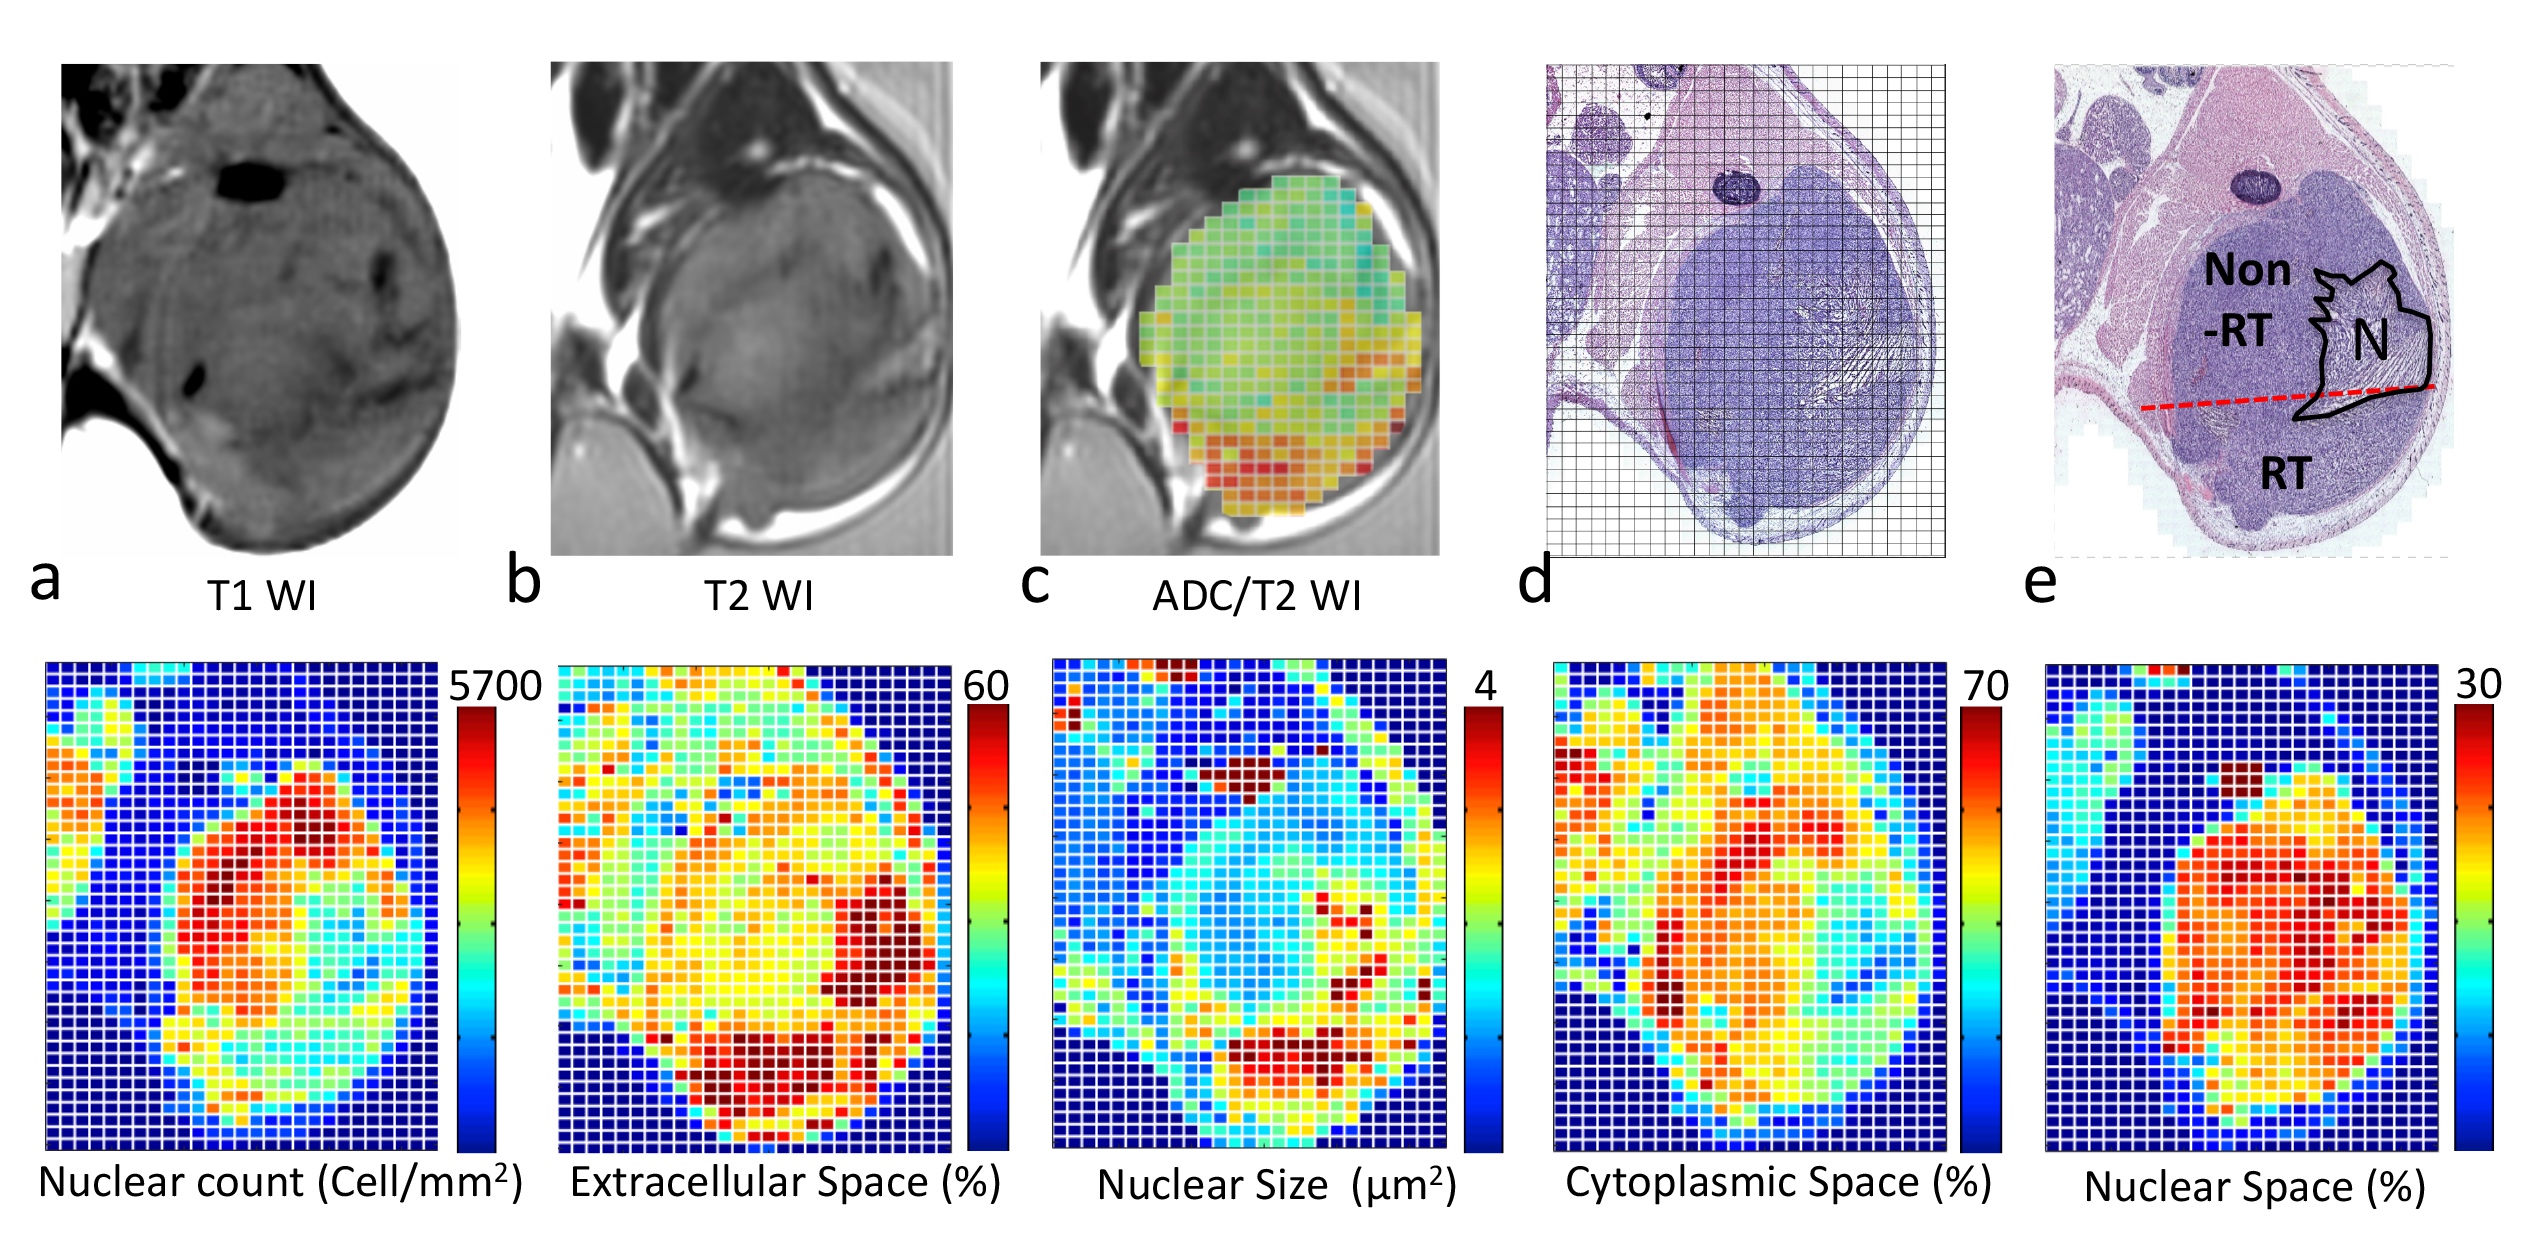
The RT region exhibited significantly increased extracellular space, nuclear size and decreased nuclear count when compared with those at the non-RT region (p < 0.001) (Fig.1). The difference was not significant for the cytoplasmic space and nuclear space (p > 0.05). In addition, the nuclear size exhibited the largest difference between the RT and non-RT regions (RT / non-RT = 2.18) among the histology metrics.
Fig.2 shows increased ADC at the RT region of the tumor when compared with that at the non-RT region . The histology metrics at the corresponding RT region exhibited decreased nuclear count ( 3152 ± 218 vs. 4885 ±356 cells/mm2, p < 0.05 ), increased extracellular space ( 41.8 ± 2.1 vs. 32.5 ± 2.6 %, p < 0.05) and nuclear size ( 2.94 ± 0.35 vs. 1.46 ± 0.17 μm2, p < 0.05) compared with the non-RT region.
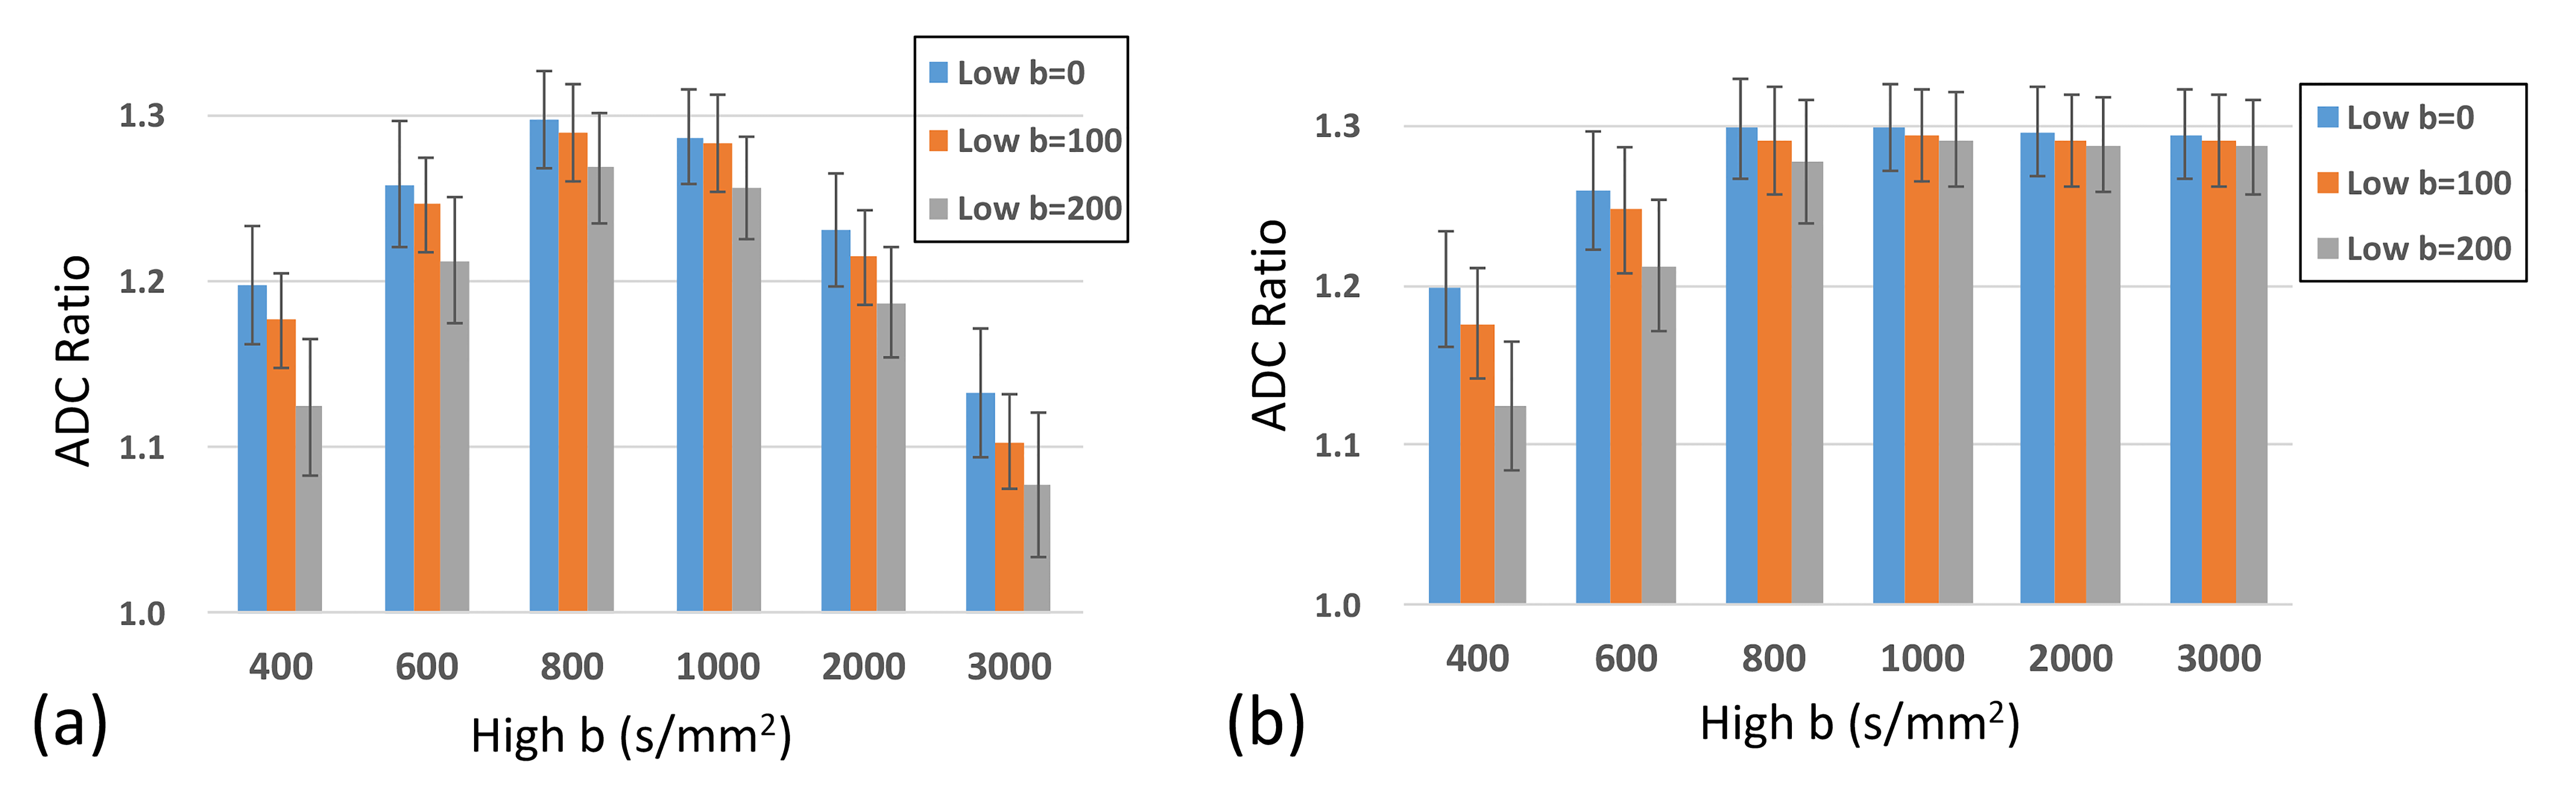
The effects of different b-value combinations on the ADC ratios between RT and non-RT regions are plotted in Fig. 3. Regardless of combination selected for the calculations, the RT region had significantly increased ADC compared with the non-RT region (p < 0.05). For the two-point estimate, the ADC using b-values of 0 and 800 s/mm2 exhibited the best contrast between RT and non-RT regions (ADC ratio = 1.297). For the monoexponential fitting method, the ADC ratio increased as more and higher b-values were used, reaching a plateau when the high b-value = 800 s/mm2 was used (ADC ratio =1.298). No significant difference of ADC ratio was found as the high b-values of ≧ 800 s/mm2 was used compared with that of 800 s/mm2.
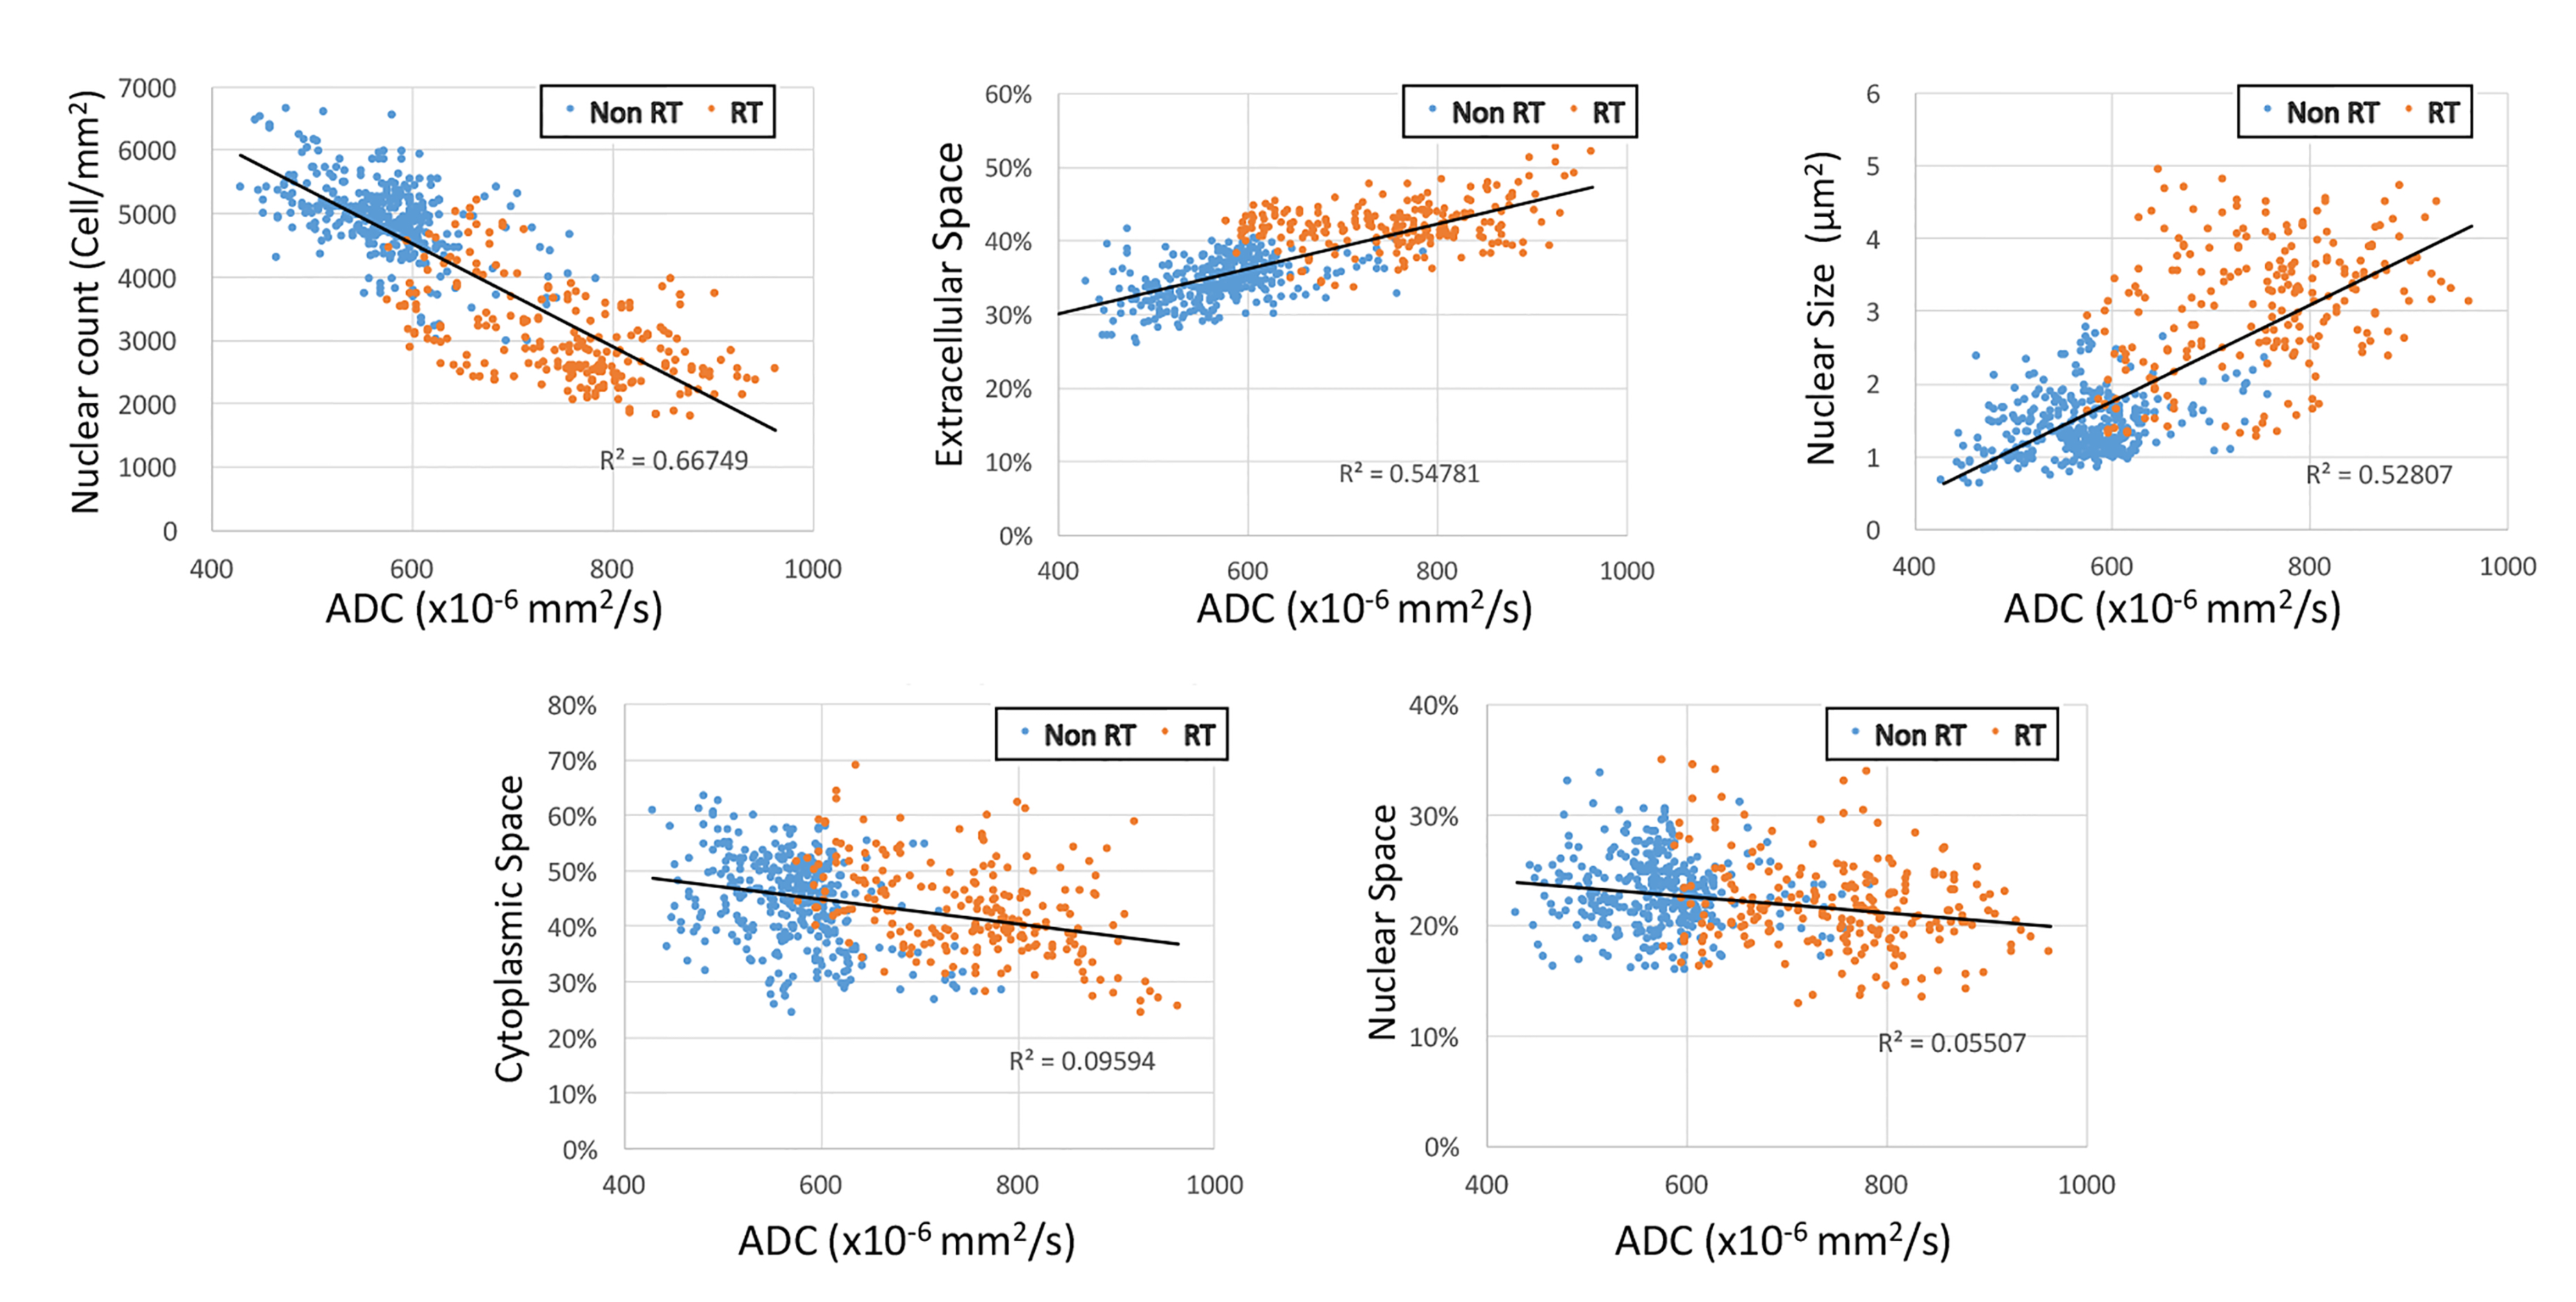
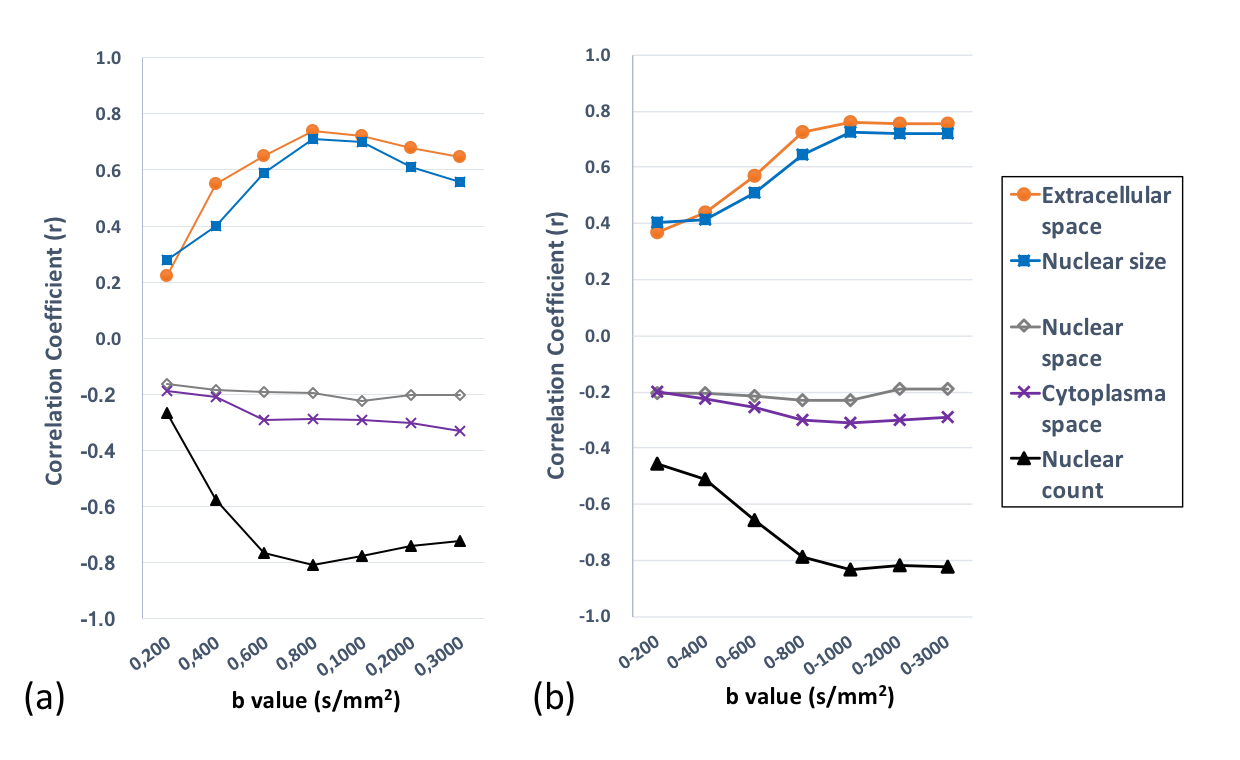
Fig. 4 plots the ADC (monoexponential fitting with b = 0 to 800 s/mm2) against histology metrics using pixels pooled from five tumors. The ADC were positively correlated with extracellular space (r = 0.74; p < 0.001) and nuclear size (r = 0.72; p < 0.001), while negatively correlated with nuclear count (r = -0.82; p < 0.001), cytoplasmic space (r = -0.31; p < 0.001) and nuclear space (r = -0.23; p < 0.001). The correlation coefficients of ADC to histology metrics improved at higher b-values up to 800 s/mm2 (Fig. 5). The correlations were weak for cytoplasmic space and nuclear space regardless the use of b-values and the algorithms.
Discussion
The present study directly correlated the ADC values with histological metrics in a pixelwise manner, and demonstrated the irradiated portion containing an increase in ADC values, which correlated with an increased nuclear size and a reduced nuclear count. The increased nuclear size in the irradiated zone was attributed to giant cell formation caused by disorganization of the mitotic spindle and incomplete mitosis 3. The reduced nuclear count has shown to associate with cell death or apoptosis. The total nuclear and cytoplasmic spatial compositions were not altered following RT, which can be explained by a function of increased nuclear size and decreased nuclear count. Our results suggest that the selection of b-values in calculating the ADC has a profound impact on both the RT-induced ADC changes and their associations with histological changes. Based on pixelwise analysis, our study demonstrated the use of b = 0 and 800 s/mm2 with a simple two-point estimate method gives the most efficient set to calculate the ADC value in assessing tumor response to RT.Conclusion
The increased nuclear size and reduced nuclear number are associated with the increased ADC values in response to RT. The use of b-values of 0 and 800 s/mm2 in DW-MRI might be recommended to calculate the ADC value in assessing the tumor response to RT, but this requires further study in different tumors before the methods can be applied widely.Acknowledgements
Grant Support: Chang Gung Memorial Hospital (CIRPG3D0141-3) and Ministry of Science and Technology, R.O.C (MOST 105-2314-B-182A-066).References
1. Lin YC, Wang CC, Lin G, et al. A simple method to improve the quality of diffusion-weighted magnetic resonance imaging with rapid histologic correlation in a murine model. Molecular imaging 2014;13:1-8.
2. Chatterjee A, Watson G, Myint E, Sved P, McEntee M, Bourne R. Changes in Epithelium, Stroma, and Lumen Space Correlate More Strongly with Gleason Pattern and Are Stronger Predictors of Prostate ADC Changes than Cellularity Metrics. Radiology 2015;277(3):751-762.
3. Kobayashi M. The irradiation effects on the cytoskeletons of C3H/He mouse mammary tumor cells and vascular basement membrane in relation to vascular invasion: a model of intraoperative radiotherapy. Tohoku J Exp Med 1988;154(1):71-89.
Figures