3465
An affordable phantom for ADC/FA; a device for multi-site studies1Kyoto Prefectural University of Medicine, Kyoto, Japan, 2Kyoto Prefectural University of Medicine Hospital, 3Chubu University, 4Kyoto University
Synopsis
Multi-site study gives large statistical power for the results. Some intrinsic differences among scanners are recognizing as an inevitable property. Isotropic diffusion has already been discussing. In contrast, anisotropic diffusion has been evading the endeavor because of the absence of an easily available anisotropic diffusion phantom. We compared DTI measures among five different MR scanners at three different sites using commercially and easily available astriction cotton. The averaged coefficient of variation for longitudinal repeated acquisitions of DTI on five different MR scanners were stable. The scan-rescan properties of five different MR scanners can be comparable by anisotropic diffusion phantom.
PURPOSE
In general, a large size of data set gives large statistical power for the result of study. Despite of collecting large size data is appropriate for a research, there is no reality to accomplish it by a single magnetic resonance imager. Therefore, multi-scanner study may have a reality to fulfill the statistical requirement for creating medical evidence of MRI study. Nevertheless, some intrinsic differences among scanners have been recognizing as an inevitable property. To tackle this intrinsic differences and to achieve statistically meaningful results from multi-scanner study, the quantitative imaging biomarker alliance (QIBA) [1] was established. As QIBA’s endeavor, isotropic diffusion has already been discussing [2]. However, anisotropic diffusion has been evading the endeavor because of the absence of an appropriate anisotropic diffusion phantom. In this study, we compared diffusion tensor image (DTI) measures (apparent diffusion coefficient: ADC and fractional anisotropy: FA) among five different magnetic resonance image (MRI) scanners at three different sites using commercially and easily available astriction cotton [3] as a stability checker.METHODS
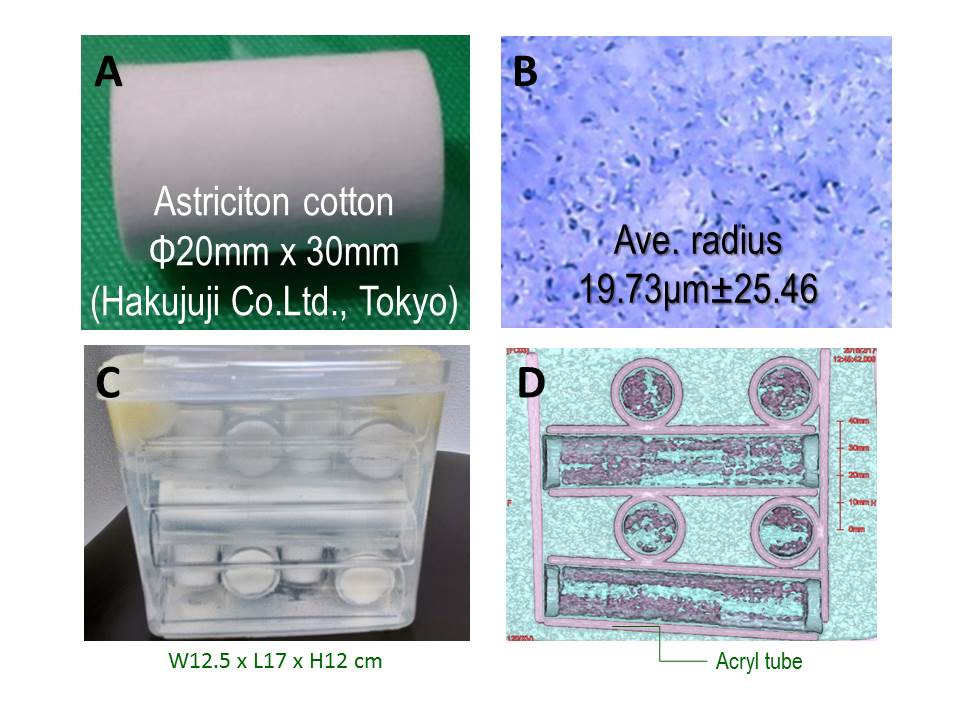
Phantom: The astriction cotton (length = 30 mm, diameter = 20 mm, Hakujuji Co. Ltd., Tokyo, Japan) into acryl tubes (diameter = 25 mm) were arranged in parallel crosses as shown in Figure 1. The phantom size was 12.5 cm wide x 17.0 cm long x 12.0 cm high (polyethylene container) [3].
MR scanners: Siemens Skyra 3T (Siemens Healthcare, Erlangen, Germany), Philips Master 1.5T, and Philips Nova 1.5T (Philips Health Tech, Best, Netherlands) were in Kyoto Prefectural University Hospital (for clinical use). Siemens Verio 3T and Siemens Sonata 1.5T (Siemens Healthcare, Erlangen, Germany) were in Kyoto University (for research use).
Round robin: The round robin scans of five scanners were done by monthly from April 22, 2016 to June 17, 2016.
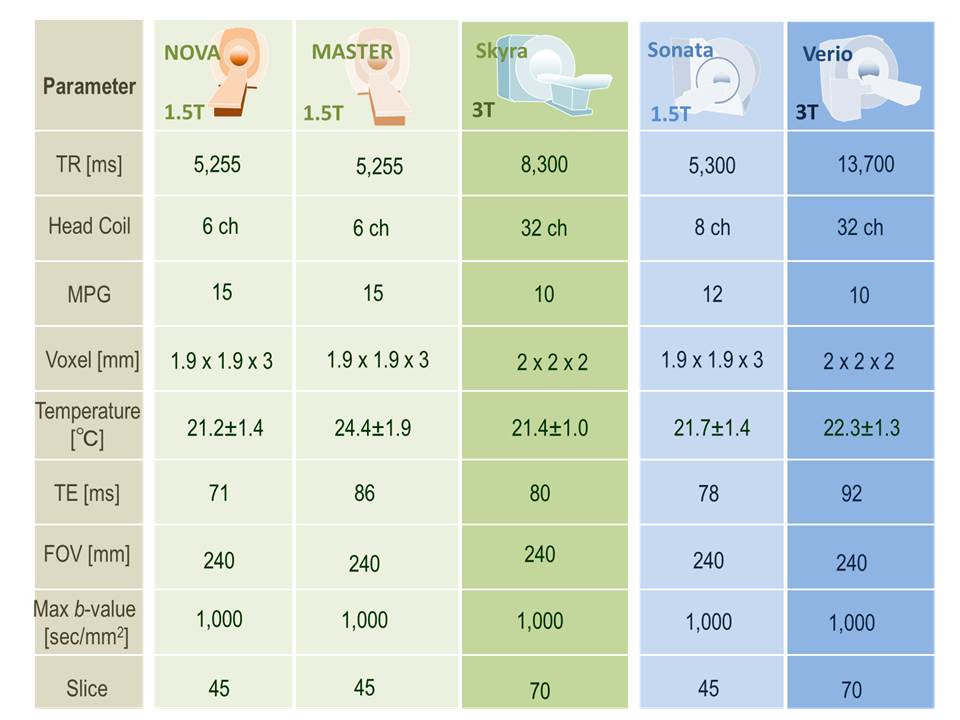
Data acquisition: For all magnetic resonance images, the field of view was 240 x 240 mm. DTI was acquired using an EPI technique with a matrix of 120 x 108. A b value of 1,000 s/mm2 was used. Other parameters were summarized in Figure 2. MPGs and head coils were varied at sites. Acquisitions were repeated five times over one day at approximately 21 - 24°C room temperature.
DTI analysis: The DTI analysis was performed with Diffusion Toolkit/TrackVis version 0.5.2.2 [4], and tract-based average diffusion metrics (apparent diffusion coefficient: ADC; fractional anisotropy: FA, FACT algorithms) were calculated with manually placed ROIs on center slices in three orthogonal directions [3].
Evaluation of stability: The stability of diffusion metrics (ADC and FA) of the phantom were evaluated by comparing coefficient of variations (CV) as CV [%] = standard deviation / mean x 100. When the CV was <6%, the measurement has stability [5].
RESULTS AND DISCUSSION
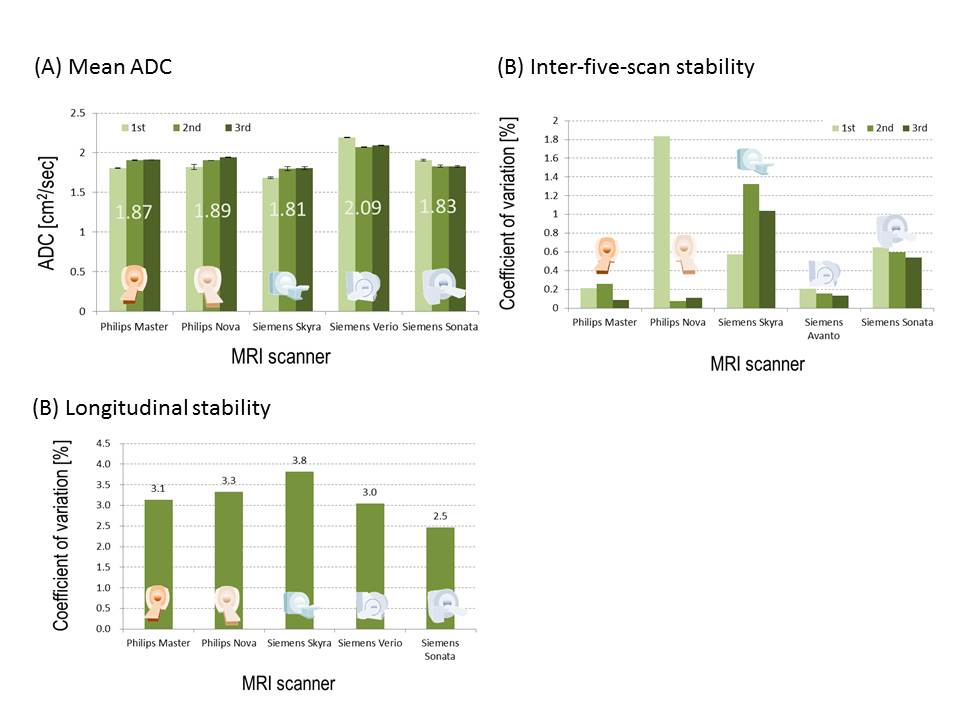
Stability of ADC: Figure 3A shows the averaged ADC of each scanner at each round robin. Third times average were 1.81 - 2.09 x 10⁻³sec/mm2. Figure 3B shows inter-five-scan stability of each scanner. The CVs of inter-five-scan were less than 2%. Figure 3C shows longitudinal stability of each scanner. The CVs of inter-three-month-scan were 2.5 – 3.8%. These results comprised the stability of each scanner for ADC measurement [5].
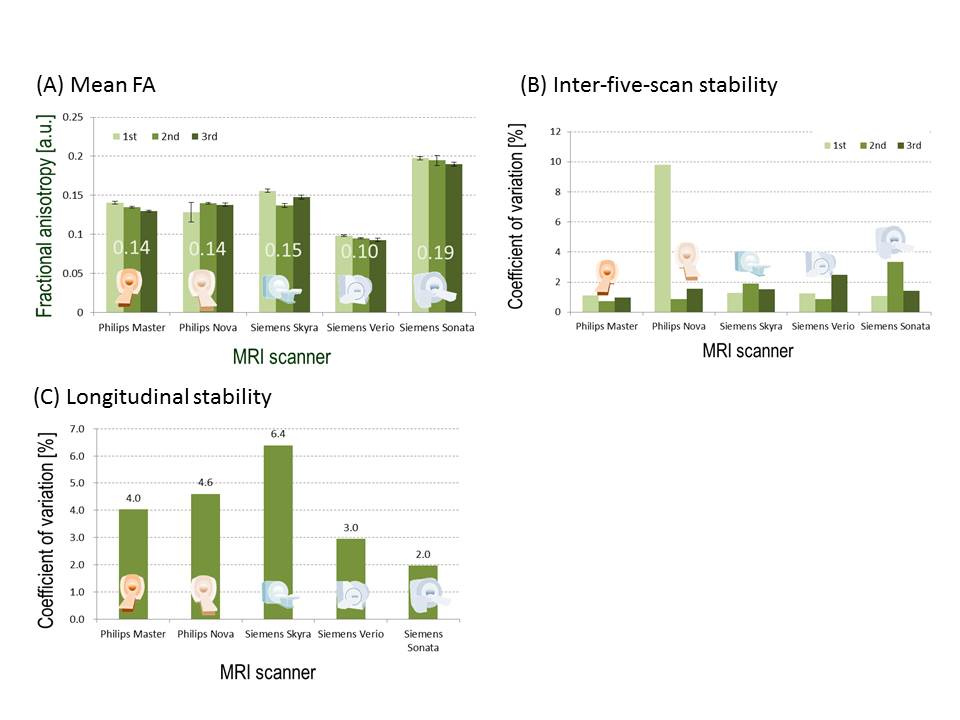
Stability of FA: Figure 4A shows the averaged FA of each scanner at each round robin. Third times average were 0.1 - 0.19. Figure 4B shows inter-five-scan stability of each scanner. The CVs of inter-five-scan were almost less than 4%, except first time of Philips NOVA. Figure 4C shows longitudinal stability of each scanner. The CVs of three-month-scan were 2.0 – 6.4%. These results comprised the stability of each scanner for FA measurement [5].
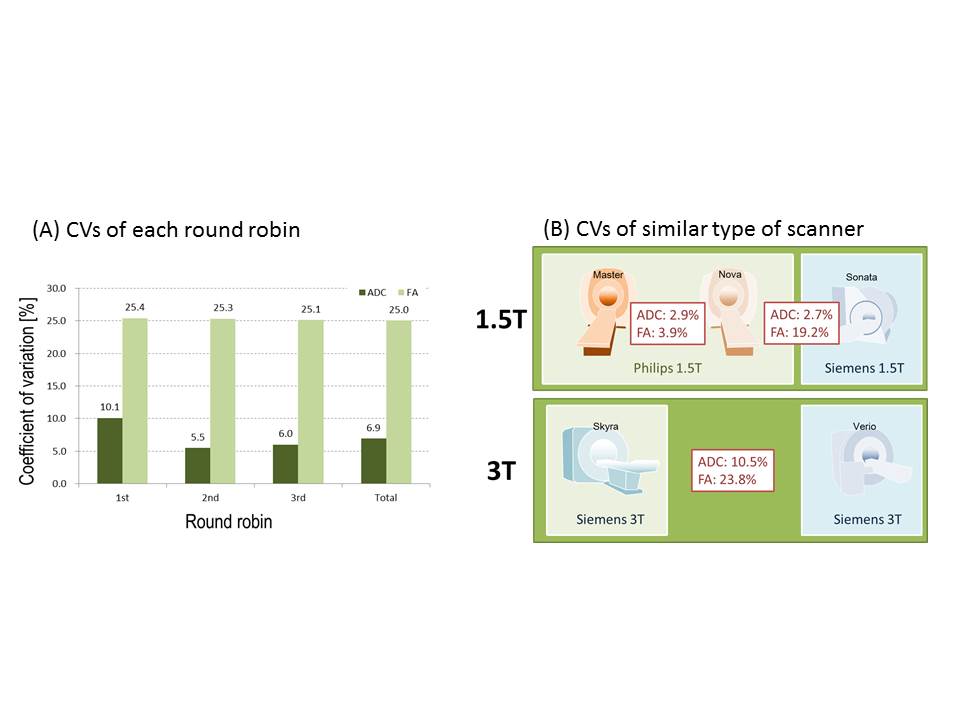
Inter-site stability: Figure 5A shows CVs of each round robin for five scanners. The total CV of three-month-scan was 6.9% for ADC and 25.0% for FA.
CV of similar scanners: Figure 5B shows the CVs among similar type of scanners. The similar scanners at same facility (Philips 1.5 T) showed the lowest CVs for ADC and FA. Same magnet strength and same manufacturer but in different facility case (Siemens 3T) showed the largest CVs.
LIMITATIONS
Only third times round robin were done in this study. Furthermore, limited numbers of MR scanners were employed. For better longitudinal stability and reliability, further investigation with more longer term and more larger numbers of MR scanner are needed.CONCLUSION
Commercially and easily available astriction cotton showed the ability of stability checker for DTI measurement for multi-scanner study.Acknowledgements
No acknowledgement found.References
[1] QIBA, https://www.rsna.org/qiba/, [2] http://qibawiki.rsna.org/images/1/1b/QIBA_IMI_August_7_2013-M_Boss.pdf, [3] Sakai et al., Proc. Intl. Soc. Mag. Reson. Med. 24 (2016), 2032, [4] Diffusion toolkit, https://www.nitrc.org/projects/trackvis/, [5] Kamagata et al., MRMS, 2015; 14: 227-233Figures