3461
The use of novel validation methods to investigate optimal ROI location and probabilistic thresholds in tractography for presurgical planning in brain tumour patients.1Neuroimaging, King's College London, London, United Kingdom, 2Physics, Federal University, Ndufu-Alike, Ikwo, Abakaliki, Ebonyi State, Nigeria, 3Neuroradiology, King's College Hospital, London, United Kingdom, 4Neuroradiology, King’s College Hospital, London, United Kingdom
Synopsis
Although advanced tractography techniques exists and are well documented, many validation methods are not applicable to brain tumour cases and do not examine the possibility of proposing standard probabilistic thresholds. Using a novel approach, we investigate certain thresholds (‘safe’ thresholds) which can be applied to probabilistic tractography to reduce false representation of tracts, aid maximal tumour resection, and limit neurofunctional deficit from surgical treatments. We also examine optimal region of interest (ROI) location. ‘Safe’ thresholds can be determined, and with a wider confidence when tractography is defined with inclusion regions.
Introduction
Tractography is useful for the characterisation of axons in the brain, which can further inform the development of tractography maps; a 3-dimensional model of white matter pathways running through specific regions of interest. It has increasingly become a clinical routine in planning maximal surgical resection for brain tumour patients while minimising damage to adjacent eloquent tissue.3,4 However, tractography has limitations that manifest as over or under representation of tracts or no representation at all. Much of the validation presented in literature considers the diffusion tensor model,1 may apply only to healthy subjects,2 and in cases of probabilistic tractography does not investigate the optimal probabilistic threshold.3 We can examine the accuracy of tractography methods by investigating the relationship between a patient’s post-surgical outcome and if their tracts run through areas of resected tissue as defined by a post-surgical cavity map warped into the pre-surgical space. Our study is the first to validate the accuracy of probabilistic tractography by overlaying the corticospinal tract (CST) generated from preoperative diffusion weighted data on postoperative structural images which have been registered to preoperative space using the novel nonlinear registration tool specifically designed for brain tumours PORTR.5Methods
Patients diagnosed with brain tumours, scanned and surgically treated at King’s College Hospital, with known post-surgical outcomes were included. Pre and post-operative imaging was obtained at 1.5T (GE Hdx or Siemens Aera) and included T2-Weighted, FLAIR, and pre and post contrast T1-Weighted acquisitions. Diffusion imaging was obtained with one of three protocols. (1) voxel size=1x1x5mm, 25 directions, b=1000s/mm2, 1xb0. (2) voxel size=1x1x2.5mm, 32 directions, b=1500s/mm2, 4xb0. (3) voxel size=2.5x2.5x2.5mm, 64 directions, b=1500s/mm2 and 6xb0. Diffusion data was post processed using a constrained spherical deconvolution reconstruction with probabilistic tractography as implemented in MRTrix (www.mrtrix.org). ROI’s for tractography were defined as the pre and post central gyrus (labelled as CS) and the Posterior Limb Internal Capsule (labelled as PLIC). Tractography was run separately with (1) the PLIC as the seed and no inclusion regions, (2) the CS as the seed and no inclusion region, (3) the PLIC set as the seed and CS as the inclusion region (PLIC_CS), and (4) CS as the seed and the PLIC as the inclusion region (CS_PLIC). For structural imaging, registration to align the postoperative to preoperative images was done. PORTR, specifically designed for the alignment of post-surgical to pre-surgical images was used to account for tissue distortion associated with the operative procedure. Postoperative cavities were then manually segmented to define the extent of the cavity within the preoperative space. Tracts were overlaid on the postoperative images registered to preoperative space, and if a deficit was present for the patient being investigated, then it was hypothesized that the tractography should intersect with the cavity. The ‘cavity intersection threshold’ was defined as the probabilistic tractography threshold where tracts no longer intersected the cavity and for patients without deficit this threshold was assumed to represent the minimum threshold and patients with deficit it was assumed to represent the maximum. The uncertainties in these thresholds were considered via the error in cavity registration provided by PORTR. This has previously been quantified as 1.6mm,5 while an in-house study found a 2.3mm error,6 differences which are likely attributed to the varying tumour types investigated and the acquired image resolution. To examine the effect that registration error has on the probabilistic threshold for cavity intersection, the cavity masks were eroded and dilated for patients with and without deficit respectively by 1mm, 2mm, and 3mm and the probabilistic threshold for cavity intersection for each new cavity volume was determined.Results and Discussion
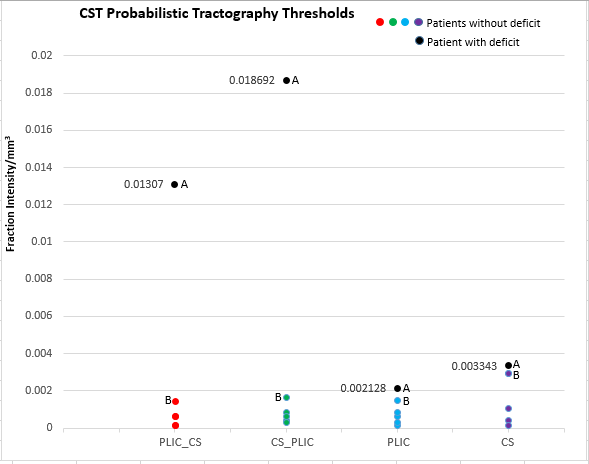
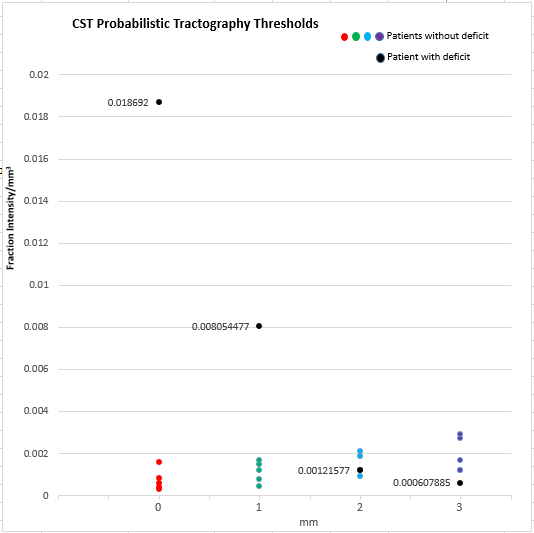
It was found that tractography generated for CS_PLIC produced the widest separation of the cavity intersection thresholds between the cases with and without post-surgical deficit (Fig 1). This separation region could be considered a “safe” threshold range where for our patient cohort, tractography thresholded within this range produce results which correctly depicts the clinical outcome. Taking into account the potential error introduced by PORTR, we found that if cavity boundaries are uncertain to greater than 2mm, then, there is no longer a ‘safe’ threshold range for our patient group (Fig 2).Conclusion
Tractography with defined inclusion regions gave a wider range of ‘safe’ threshold values than tractography where no inclusion region was defined. The optimal tractography was when seeding from the CS and with inclusion in the PLIC. The range of probabilistic threshold values which differentiate patients with and without postsurgical deficit identified in this study can help guide the choice of “safe” thresholds for tractography studies in future tumour patients.Acknowledgements
No acknowledgement found.References
1. Okada, T., Mikuni, N., Miki, Y., Kikuta, K., Urayama, S., Hanakawa, T., Togashi, K. (2006). Corticospinal tract localization: Integration of Diffusion-Tensor Tractography at 3-T MR imaging with Intraoperative white matter stimulation Mapping—Preliminary results 1. Radiology, 240(3), 849–857. doi:10.1148/radiol.2403050916
2. Catani, M., & Thiebautdeschotten, M. (2008). A diffusion tensor imaging tractography atlas for virtual in vivo dissections. Cortex, 44(8), 1105–1132. doi:10.1016/j.cortex.2008.05.004
3. Farquharson, S., Tournier, J. ., Calamante, F., Fabinyi, G., Schneider-Kolsky, M., Jackson, G. D., & Connelly, A. (2013). White matter fiber tractography: Why we need to move beyond DTI. Journal of Neurosurgery, 118(6), 1367–1377. doi:10.3171/2013.2.jns121294
4. Bucci, M., Mandelli, M. L., Berman, J. I., Amirbekian, B., Nguyen, C., Berger, M. S., & Henry, R. G. (2013). Quantifying diffusion MRI tractography of the corticospinal tract in brain tumors with deterministic and probabilistic methods. NeuroImage: Clinical, 3, 361–368. doi:10.1016/j.nicl.2013.08.008
5. Kwon, D., Niethammer, M., Akbari, H., Bilello, M., Davatzikos, C., & Pohl, K. M. (2014). PORTR: Pre-Operative and post-recurrence brain tumor registration. IEEE Transactions on Medical Imaging, 33(3), 651–667. doi:10.1109/tmi.2013.2293478
6. Lemos, M., Barker, G., & Ashmore, J. (2015). An Investigation of Non-linear Registration Methods in Brain Tumours (unpublished masters dissertation thesis). King’s College, London, London.
Figures