3458
Quantitative evaluation of apparent diffusion coefficient in a large multi-unit institution using QIBA diffusion phantomJoshua Yung1, Yao Ding1, Ken-Pin Hwang1, Carlos E Cardenas2,3, Hua Ai1, Michael A Boss4, Thomas L Chenevert5, Clifton Fuller6, and R Jason Stafford1
1Imaging Physics, The University of Texas MD Anderson Cancer Center, Houston, TX, United States, 2Radiation Physics, The University of Texas MD Anderson Cancer Center, Houston, TX, United States, 3The University of Texas Graduate School of Biomedical Sciences, Houston, TX, United States, 4Physical Measurement Laboratory, National Institute of Standards and Technology, Boulder, CO, United States, 5Radiology, University of Michigan, Ann Arbor, MI, United States, 6Radiation Oncology, The University of Texas MD Anderson Cancer Center, Houston, TX, United States
Synopsis
The purpose of this study was to determine the quantitative variability of apparent diffusion coefficient values across a large fleet of MR systems. Using a NIST traceable magnetic resonance imaging diffusion phantom, imaging was reproducible and the measurements were quantitatively compared to known values. Significant differences in identical phantoms were not observed, but uncertainty in the measurements was seen at low apparent diffusion coefficient values. The same trend was observed when the diffusion phantoms were imaged in 20 different MR systems. The characterization of ADC variability for these systems provides an improved quality control for quantitative diffusion weighted imaging.
Introduction
The purpose of this study was to determine the quantitative variability of apparent diffusion coefficient (ADC) values across a large fleet of MR systems.Methods
A NIST traceable, quantitative magnetic resonance imaging (MRI) diffusion phantom (High Precision Devices, Inc, Boulder, CO) was imaged on 20 different MR systems. The phantom 194 mm in diameter holds 30 mL vials of polymer polyvinylpyrrolidone (PVP) in aqueous solution. The vials have a range of concentrations of PVP allowing for a range of ADC values. Increasing concentrations of the polymer cause the ADC values to be reduced. The 13 vials consist of three vials of pure water and two vials each of a PVP solution at 10, 20, 30, 40 and 50% PVP by mass fraction. To eliminate the temperature sensitivity of diffusion, prior to scanning, the phantom was filled with ice water to equilibrate the phantom at 0°C according to the provided phantom instructions. Protocols consistent with the sample protocols developed by QIBA/RSNA were used on 1.5T and 3.0T MR systems from different vendors, GE and Siemens, and different platforms. The resulting images were analyzed with QIBA DWI phantom analysis software that generated ADC maps from b-values of 0, 500, 900, 2000 s/mm2 with a user-directed region-of-interest (ROI) placement (Figure 1). The ADC values were compared to the reference values provided by the phantom manufacturer. With multiple phantoms in the institution, the phantoms were imaged on the same MR system to determine consistency among phantoms. Phantoms were then imaged in the different MR systems in the institution.Results
The error of the ADC values for each of the PVP concentrations for three different phantoms is shown in Figure 2. ADC values among the three phantoms showed good agreement and were not significantly different from one another. At 40% PVP concentration or lower, corresponding to ADC values of 235x10-5 mm2/s and higher, errors in ADC measurements were .088. The low ADC vials showed larger errors and variation. When comparing all MR systems, similar trends were observed (Figure 3). ADC measurements were all similar to one another except for the low ADC values (high PVP concentration). Also a positive error or overestimation of the ADC value was found for most MR systems, except for the low ADC vials.Conclusion
The large variation in the 50% PVP concentration vials among all three phantoms was consistent. In the other vials of PVP concentrations, the MR systems showed good agreement and low error to one another and among the different phantoms. Future investigations will be performed to study differences in magnetic field strength, vendor, MR system models, gradients, and bore size. With the increasing usage of diffusion weighted imaging in the clinic, the characterization of ADC variability for MR systems provides an improved quality control over the MR systems.Acknowledgements
No acknowledgement found.References
1 Diffusion Phantom Model 128, High Precision Devices, Inc, Boulder, COFigures
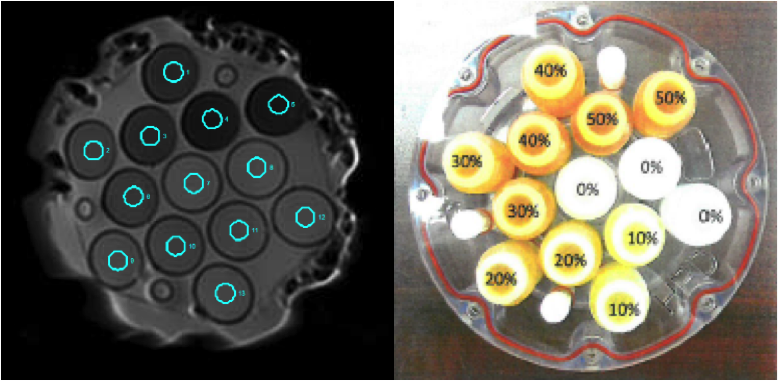
Figure 1: Example of one of the diffusion weighted images
with region of interests overlayed on each of the 13 vials (left). Image of
vial arrangement and corresponding aqueous solutions of PVP1 (right)
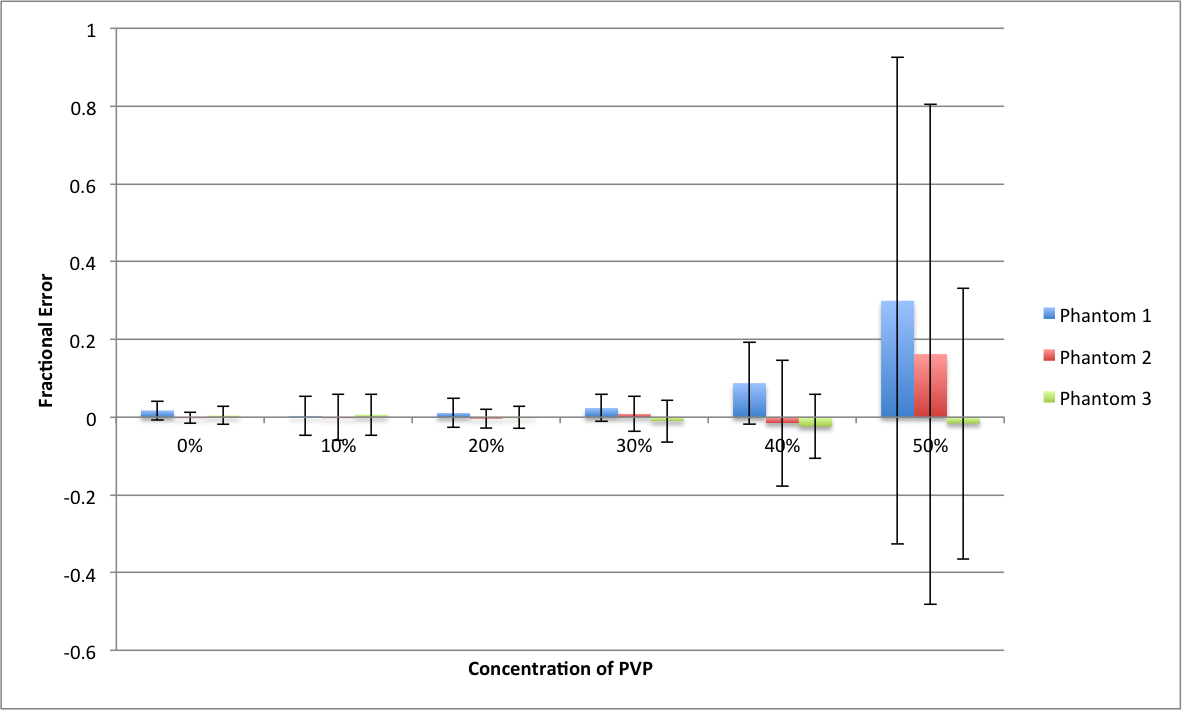
Figure 2: Fractional error in measured ADC values in three
different diffusion phantoms across the PVP concentrations in the phantom
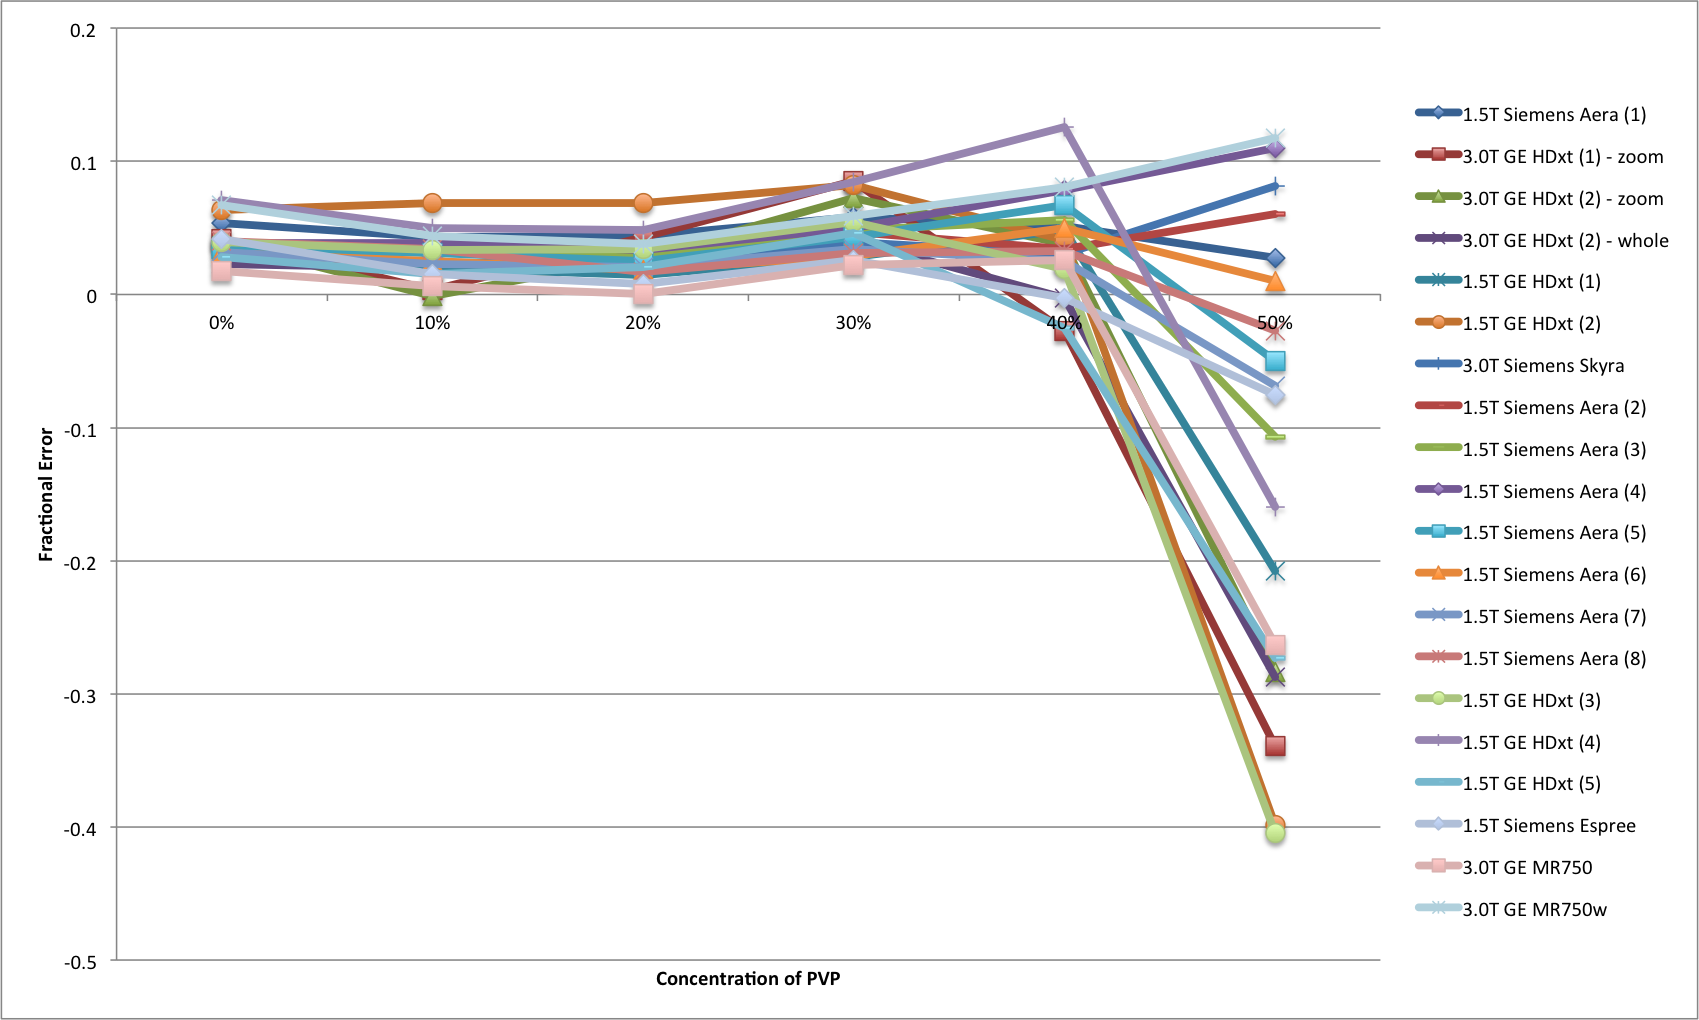
Figure 3: Fractional error in measured ADC values in 20
different MR systems across the PVP concentration in the phantom