3457
Quantitative evaluation of PROPELLER DWI using QIBA diffusion phantomJoshua Yung1, Hua Ai1, Ho-Ling Liu1, and R Jason Stafford1
1Imaging Physics, The University of Texas MD Anderson Cancer Center, Houston, TX, United States
Synopsis
The purpose of this study was to characterize ADC values when varying imaging parameters in a diffusion-weighted (DW) FSE sequence with Periodically Rotated Overlapping ParallEL Lines with Enhanced Reconstruction (PROPELLER) k-space trajectory. The QIBA diffusion phantom was used to quantitatively evaluate the different pulse sequences. The DW PROPELLER sequence showed good agreement with the QIBA SE EPI sequence with the ETL=20 and b-value of 0 and 2000 s/mm2 sequence having with a r2=0.9034. The DW PROPELLER sequence is promising for quantitative evaluation of ADC values and this study may help improve clinical protocols using diffusion weighted imaging.
Introduction
The purpose of this study is to determine the quantitative variability of apparent diffusion coefficient (ADC) values when varying imaging parameters in a diffusion-weighted (DW) fast spin echo (FSE) sequence with Periodically Rotated Overlapping ParallEL Lines with Enhanced Reconstruction (PROPELLER) k-space trajectory.Methods
Using a 3T MRI scanner (Discovery MR750, GE Healthcare, Waukesha, WI), a NIST traceable, quantitative magnetic resonance imaging (MRI) diffusion phantom (High Precision Devices, Inc, Boulder, Colorado) consisting of 13 vials filled with various concentrations of polymer polyvinylpyrrolidone (PVP) in aqueous solution (Figure 1) was imaged with a standard Quantitative Imaging Biomarkers Alliance (QIBA) DWI spin echo, echo planar imaging (SE EPI) acquisition. The vials have a range of concentrations of PVP allowing for a range of ADC values from 118x10-6mm2/s to 1091x10-6mm2/s. To eliminate the temperature sensitivity of diffusion, the phantom was filled with ice water to equilibrate the phantom at 0°C prior to scanning. The same phantom was then imaged with a DWI PROPELLER sequence at varying echo train lengths (ETL) of 8, 20, and 32, as well as b-values of 400, 900, and 2000 s/mm2. Figure 2 shows the imaging parameters used. QIBA DWI phantom analysis software was used to generate ADC maps and create region of interests (ROIs) for quantitative measurements of each vial. Mean and standard deviations of the ROIs in the ADC maps were calculated. The mean of the measured ADC values and individual voxel values were compared to the known ADC value of each vial.Results
The SE EPI sequence generated ADC values that showed very good agreement with the known ADC values of the phantom (r2 = 0.9995, slope = 1.0061) (Figure 3). The ADC values measured from the PROPELLER sequences were inflated, but were highly correlated with an r2 range from 0.8754 to 0.9880. The PROPELLER sequence with an ETL=20 and b-value of 0 and 2000 s/mm2 showed the closest agreement (r2 = 0.9034, slope = 0.9880). In a voxel-by-voxel comparison, the ADC maps produced by the pulse sequence with an ETL of 8 generated the most outliers and voxels that were not able to be processed (Figure 4). The sequence with an ETL = 20 had the least amount of outliers and had consistent variability across b-values. The sequence with an ETL = 20 and b-values of 0 and 2000 s/mm2 resulted in the least variability. In separating the error to individual ADC values or PVP concentrations, the sequence with an ETL = 20 also showed consistent lower error compared to the other sequences across the applied b-values (Figure 5). The sequence with a b-value of 0 and 500 s/mm2 showed the highest error across all the sequences.Conclusion
The DW PROPELLER sequence is promising for quantitative evaluation of ADC values. A drawback of the PROPELLER sequence is the longer acquisition time. The 180° refocusing pulses may also cause the observed increase in ADC values compared to the standard SE EPI DW sequence. However, the FSE sequence offers an advantage with in-plane motion and geometric distortion which will be investigated in future studies. This quantitative comparison helps the decision making process for improving clinical protocols.Acknowledgements
Appreciation is expressed to Dr. Thomas Chenevert for providing the analysis package used in this study. Part of the research was conducted at the Center for Advanced Biomedical Imaging at The University of Texas MD Anderson Cancer Center with equipment support from GE Healthcare.References
No reference found.Figures
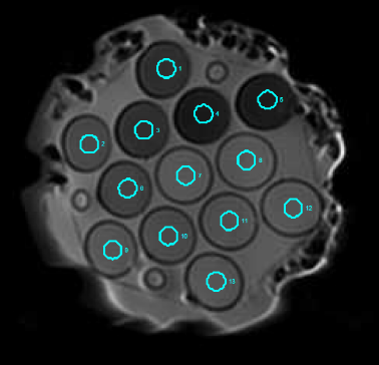
Figure 1.
One of the diffusion weighted images
with region of interests overlayed on each of the 13 vials
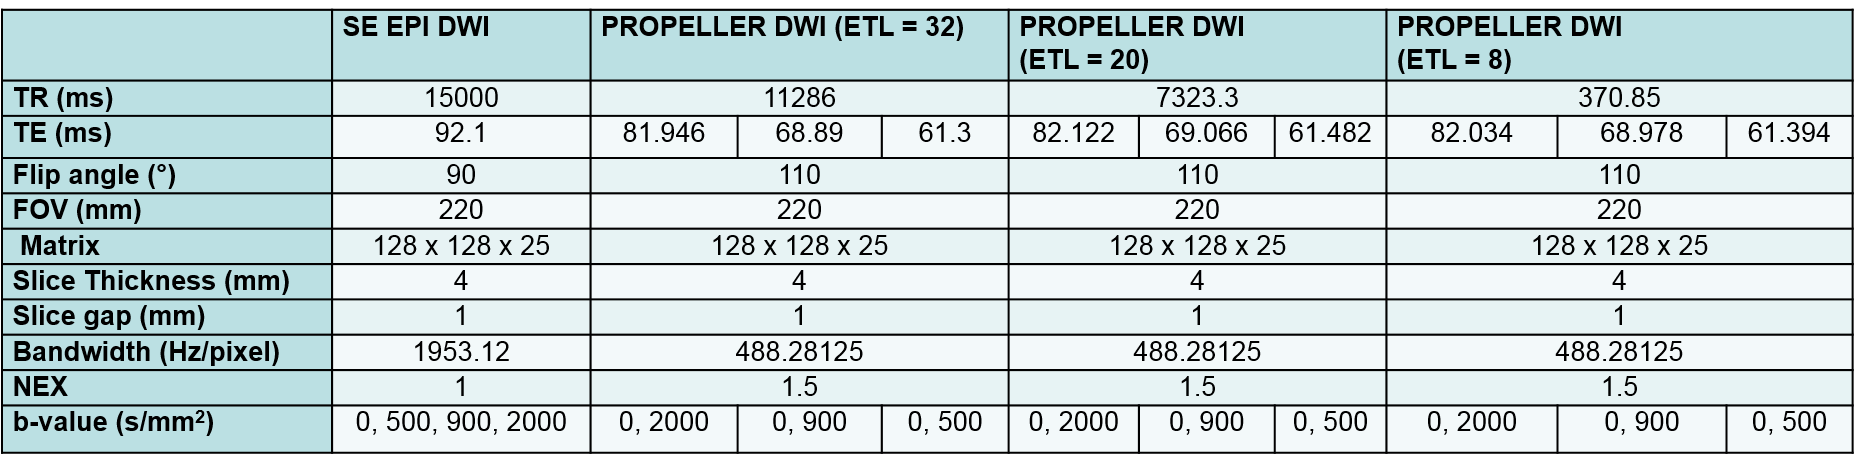
Figure 2.
Imaging parameters of diffusion
weighted sequences
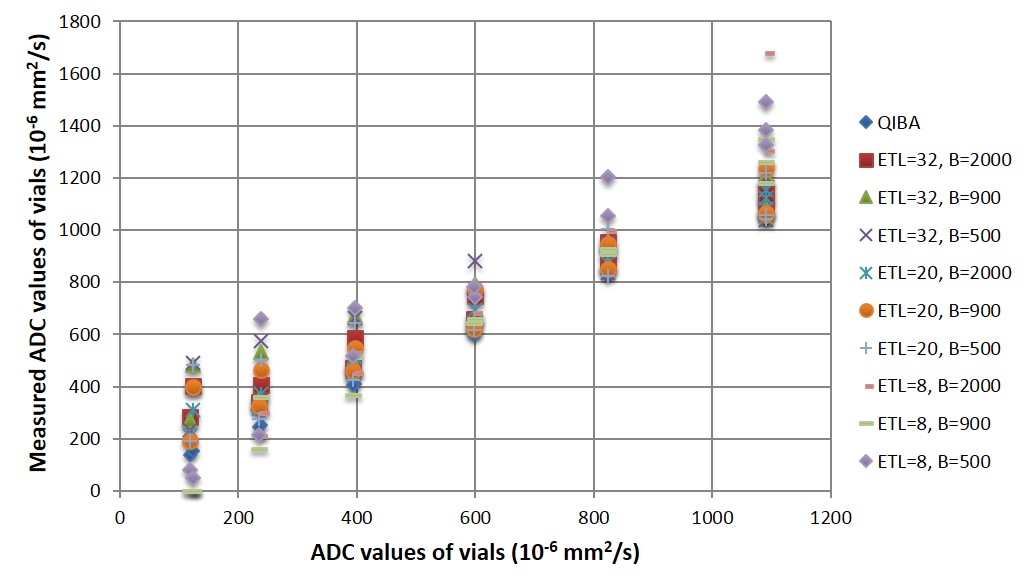
Figure 3.
Measured
ADC values compared to known ADC values. Measured ADC value with a recommend
QIBA protocol is also included.
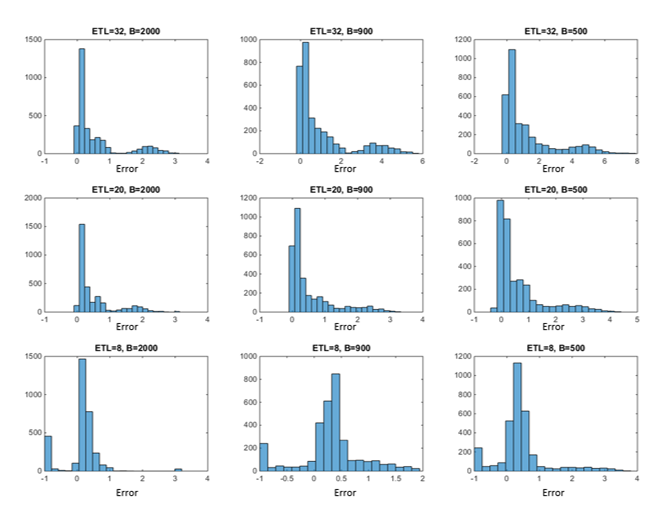
Figure 4. Histogram
of ADC error resulting from different PROPELLER sequences

Figure 5. Boxplot
of ADC error resulting from different PROPELLER sequences at different ranges
of ADC values