3456
Robustness of Local Connectome Fingerprint Explored: Using a Multi-center and Multi-vendor Study1Radiology, University of Pittsburgh, Pittsburgh, PA, United States, 2Radiology, Children's Hospital of Pittsburgh UPMC, Pittsburgh, PA, United States, 3Radiology, University of Michigan, Ann Arbor, MI, United States, 4Radiology, Boston Children’s Hospital, Boston, MA, United States, 5Radiology and Imaging Sciences, Emory University School of Medicine, Atlanta, GA, United States, 6Radiology, Medical College of Wisconsin, Milwaukee, WI, United States, 7Radiology, Children’s Hospital of Philadelphia, Philadelphia, PA, United States, 8Psychology, Carnegie Mellon University, Pittsburgh, PA, United States, 9Neurological Surgery, University of Pittsburgh, Pittsburgh, PA, United States
Synopsis
In this study we explore whether scanner-related-variabilities contribute to an individual’s distinct fingerprint – and whether the fingerprint specificity would be robust as a biomarker by scanning the same subject across multiple vendors and multiple scanner in four institutions. Both Diffusion Tensor Imaging and Multi-shell Multi-band diffusion imaging (MSMBDI) was tested, and differences within acquisition type (using fractional anisotropy and normalized quantitative anisotropy) and between acquisition types comparisons (using q-space diffeomorphic reconstruction) analysis were examined. We found that scanner may contribute partly to the fingerprint patter, but the fingerprint was robust at maintaining pattern, especially in MSMBDI to warrant further studies.
Introduction
Characterization of brain microstructure is critical to studying changes occurring in neuropathology, injury, or even as part of the natural process of development and neuroplasticity1,2. The local connectome can be defined as the microstructural connectivity along fiber pathways, at the level of the voxel, measured using density of diffusing spins to measure the degree of connectivity between adjacent voxels within white matter fascicles3. Sampling the peaks of the spin distribution functions (SDFs) along all voxels gives rise to a local connectome “fingerprint”—a highly conserved measure of individual white matter pathways. This type of microstructural analysis has been used to study specificity, neuroplasticity, and phenotype similarity within subject, and between subjects, twins, and siblings4 as well as in clinical populations5. However, these studies often limited the analysis to cohorts scanned on the same scanner. In this study we explore whether scanner-related-variabilities contribute to an individual’s distinct fingerprint – and whether the fingerprint specificity would be robust as a biomarker. Two levels of analyses were performed. First, within-sequence analyses were performed to compare the scans of the same type (MSMBD only and DTI only) across the five acquisitions. Second, overall SDF comparison within and between the two scan types was conducted.Materials and Methods
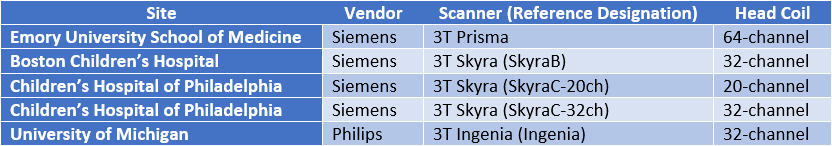
Five sets of diffusion tensor imaging (DTI) and multi-shell, multiband diffusion (MSMBD) scans were acquired on one subject (male 44 year-old) within a five-month period on four scanners at different institutions. The types of scanners and their designations are listed in Figure 1. All Siemens scanners used the same multi-band EPI diffusion sequence MSMBD scheme with 256 directions – 128 unique directions at B3000s/mm2 (at TE/TR=110ms/3300ms) and B5000s/mm2 (at TE/TR=130ms/3600ms). The Ingenia followed a similar 256 directions scheme, but with B=2500 s/mm2 and B=4000 s/mm2. The following parameters were used across all platforms: FOV=240mm, voxel size=2.4mm (isotropic), matrix size=100x100x60, and multiband factor=3. For the DTI all Siemens scanners used the same 42-direction scheme and Ingenia used a similar 42-direction scheme, with following parameters: FOV = 256mm, voxel size = 2.0mm (isotropic), TE/TR=92ms/12600 ms, B = 1000s/mm2. All sequences were approved by the IRBs of the respective institutions.
Each sequence was processed in DSI-studio6 to generate normalized quantitative anisotropy (nQA) for MSMBD scans (GQI technique), and FA for DTI scans. Linear rigid body registration (FSL FLIRT7) was used to register nQA images to each other and FA images to each other. For subsequent analysis q-space diffeomorphic reconstruction (QSDR) technique was used8,9.
Results
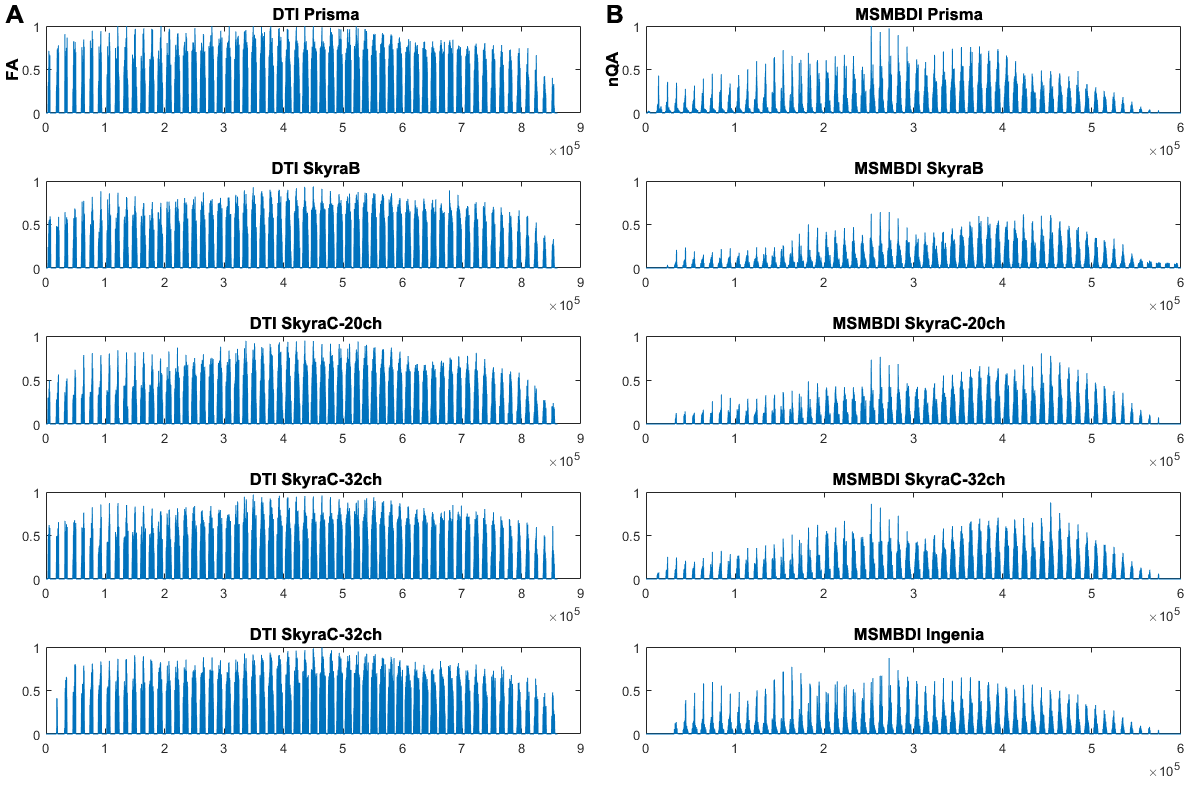
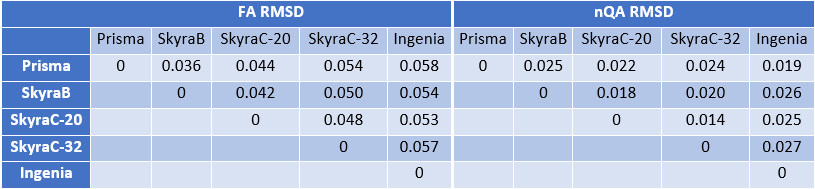
For within acquisition-type analysis, the reshaped FA and nQA images are presented in Figure 1, with brain arranged slice by slice from inferior (left) to superior (right). Qualitatively, no identifiable pattern observed for FA (Figure 1A), while a distinct pattern was observed for nQA on the Siemens machines (Figure 1B). A pair-wise root mean squared deviation for each acquisition-type (Table 2) showed the RMSD range for FA was higher than RSMD range for nQA – lowest RMSD for FA is higher than the highest RMSD for nQA.
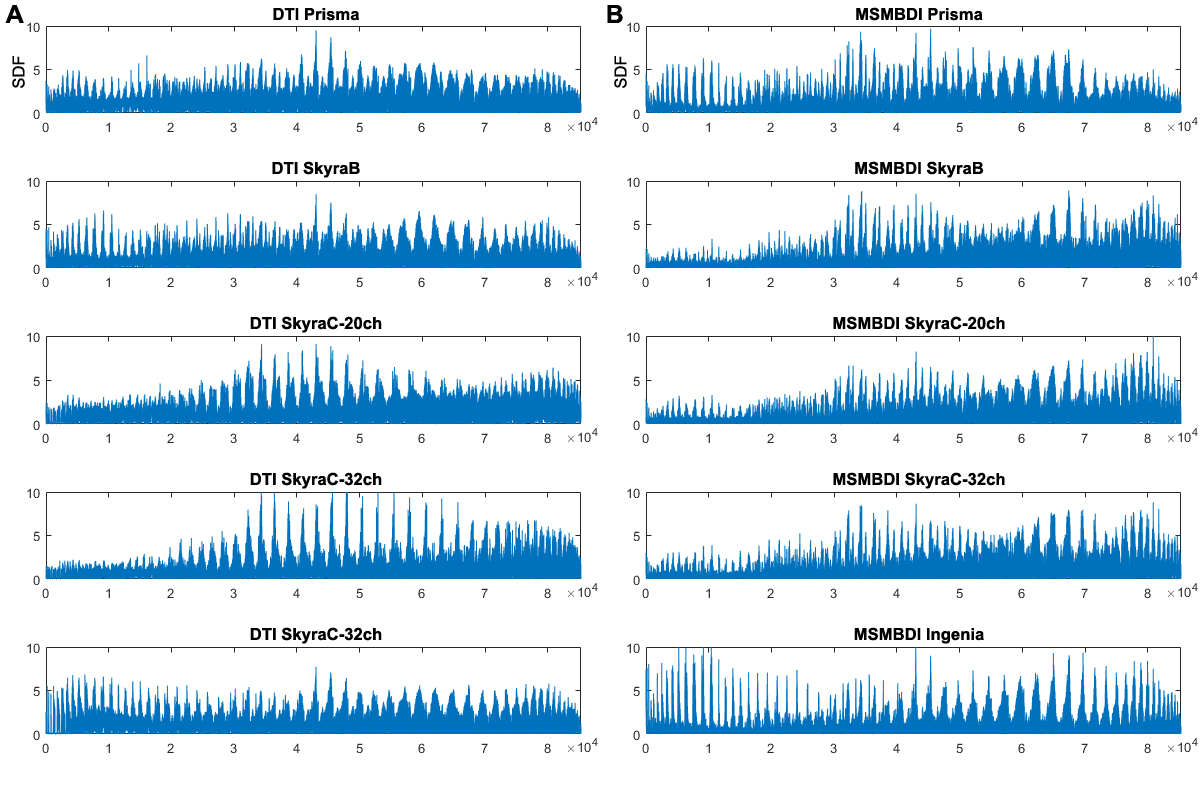
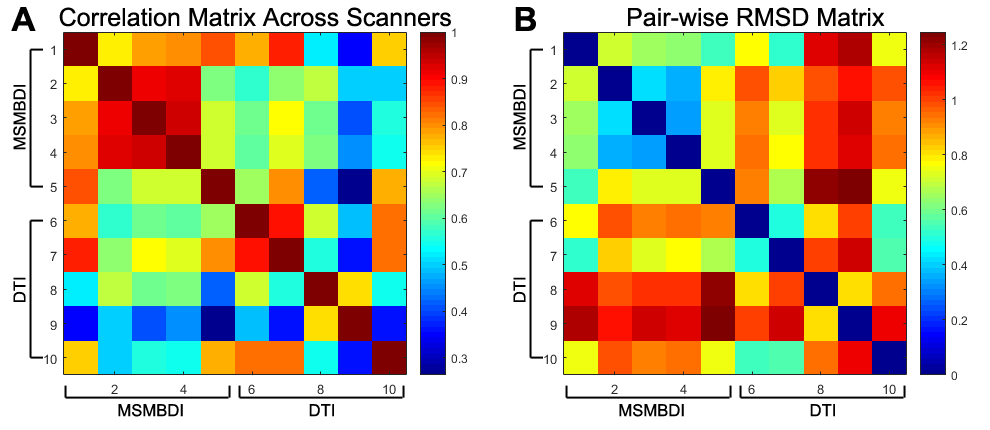
The Local connectome SDF fingerprint comparison analysis is presented in Figure 2, and the pair-wise correlation and RMSD are presented in Figure 3. Within the MSMBD based scans, especially on the Skyras, a distinctly similar local connectome “fingerprint” pattern emerged (Figure 2B), and this is further supported by the high correlation association (Figure 3A) and low deviation (Figure 3B) between the Skyras. It is important to note that the MSMBD scans on the Prisma and Ingenia also seem to share more similarity – as seen by an RMSD of 0.019 (Table 2), moderately high correlation (Figure 3A) – which may be related in part to the higher diffusion levels observed at the more inferior slices in both scans. The DTI-based fingerprints showed more variable and less similar patterns than the MSMBD, with the similarity observed only between the scans on the same scanner, SkryaC-20ch and SkryaC-32ch (Figure 2A).
Discussion
This is the first time where local connectome SDF fingerprint concept was tested across scanners on the same subject. For the MSMBD scans, the nature of the scanner may contribute partly to the fingerprint pattern. However, even with differences in scanners, we see some of the individual specific patterns are preserved and present across scanners. This study also showed that FA is too variable and more scanner dependent for detecting subtle differences. Further cross scanner studies with additional subjects are needed to determine if fingerprint pattern specificity can be replicated, and whether these patterns can be used as phenotype or detect microstructure changes.Acknowledgements
No acknowledgement found.References
[1] Ceschin, R., Lee, V.K., Schmithorst, V. and Panigrahy, A., 2015. Regional vulnerability of longitudinal cortical association connectivity: Associated with structural network topology alterations in preterm children with cerebral palsy. NeuroImage: Clinical, 9, pp.322-337.
[2] Abhinav, K., Yeh, F.C., Pathak, S., Suski, V., Lacomis, D., Friedlander, R.M. and Fernandez-Miranda, J.C., 2014. Advanced diffusion MRI fiber tracking in neurosurgical and neurodegenerative disorders and neuroanatomical studies: A review. Biochimica et Biophysica Acta (BBA)-Molecular Basis of Disease,1842(11), pp.2286-2297.
[3] Yeh, F.C., Badre, D. and Verstynen, T., 2016. Connectometry: A statistical approach harnessing the analytical potential of the local connectome.NeuroImage, 125, pp.162-171.
[4] Yeh, F.C., Vettel, J., Singh, A., Poczos, B., Grafton, S., Erickson, K., Tseng, W.Y.I. and Verstynen, T., 2016. Quantifying Differences and Similarities in Whole-brain White Matter Architecture Using Local Connectome Fingerprints. bioRxiv, p.043778.
[5] Yeh, F.C., Tang, P.F. and Tseng, W.Y.I., 2013. Diffusion MRI connectometry automatically reveals affected fiber pathways in individuals with chronic stroke. Neuroimage: Clinical, 2, pp.912-921.
[6] Yeh, F.C., Wedeen, V.J. and Tseng, W.Y.I., 2010. Generalized-sampling imaging. IEEE transactions on medical imaging, 29(9), pp.1626-1635.
[7] Jenkinson, M., Bannister, P., Brady, M. and Smith, S., 2002. Improved optimization for the robust and accurate linear registration and motion correction of brain images. Neuroimage, 17(2), pp.825-841.
[8] Yeh, F.C. and Tseng, W.Y.I., 2011. NTU-90: a high angular resolution brain atlas constructed by q-space diffeomorphic reconstruction. Neuroimage,58(1), pp.91-99.
[9] Yeh, F.C., Verstynen, T.D., Wang, Y., Fernández-Miranda, J.C. and Tseng, W.Y.I., 2013. Deterministic diffusion fiber tracking improved by quantitative anisotropy. PloS one, 8(11), p.e80713.
Figures