3453
A biomimetic tumour tissue phantom for validating diffusion-weighted MRI measurements1Centre for Imaging Sciences, The University of Manchester, Manchester, United Kingdom, 2CRUK and EPSRC Cancer Imaging Centre in Cambridge and Manchester, Manchester, United Kingdom, 3The School of Materials, The University of Manchester, Manchester, United Kingdom, 4Bioxydyn Ltd., Manchester, United Kingdom
Synopsis
This work investigates the stability of a water-based biomimetic tumour tissue phantom, and evaluates its potential as a tool for validating diffusion-weighted (DW) MRI measurements. As with biological tissue, and unlike most previous phantoms for tumour DW-MRI, the phantom’s apparent diffusion coefficient depends on diffusion time, with values stable over six months. DW-MRI-based estimates of microstructural parameters exhibited bias, possibly indicating limitations in the analysis model or acquisition scheme. It is envisaged that such phantoms will aid investigation of DW-MRI tumour microstructural models, and more generally will act as realistic test objects for comparing DW-MRI-derived biomarkers obtained from different scanners/sites.
Purpose
Diffusion-weighted (DW) MRI biomarkers
require validation in order to become useful clinical tools, determining both
their technical performance (accuracy and precision), and their relationship to
the biological ground truth1. Free diffusion phantoms2,3 typically used for validating tumour apparent diffusion coefficient (ADC)
measurements are unsuitable for validating other DW-MRI biomarkers, such
as tissue microstructural properties4,5, as they lack the
cellular-level structure which underlies such properties.
Building on an earlier organic solvent
based phantom design6, this work evaluates the stability of a
water-based phantom designed as a simple mimic of tumour cellular structure,
and assesses its potential as a tool for validating microstructural measurements.Methods
Phantom construction and characterisation
Coaxial-electrospraying7 was
used to generate a collection of approximately spherical, micron-scale hollow
polymer 'cells'.
Two samples of the material were
immersed in deionised water, with one used for longitudinal scanning electron microscope
(SEM) characterisation of the outer sphere radius, Ro, and the other for MR experiments.
MR acquisition and analysis
Experiments were carried out at ~6, 24, 72 hours, 1, 2, 3, 4, 9, 16, 20 and 26 weeks post-immersion, on a 7 T Bruker system (Bruker BioSpin, Ettlingen, Germany). For ADC calculations, data were acquired with b = 0, 150, 500, 1000 s/mm2, δ = 4 ms, Δ = 12, 45 ms, with TE = 21.3, 54.3 ms, respectively. For microstructural modelling, data were acquired with G = 0, 70, 140, 210 mT/m, δ = 4 ms, Δ = 12, 23, 45 ms, with TE = 21.3, 32.3, 54.3 ms, respectively. All acquisitions had TR = 2500 ms and 0.23 x 0.23 x 1 mm3 resolution.
ADC was calculated separately for the Δ
= 12, 45 ms acquisitions. A two-compartment microstructural model6
was fitted to region of interest (ROI)-averaged multi-G, multi-Δ signals, yielding four parameters: sphere radius, R, free diffusivity, D, intracellular volume fraction, fi, and the normalised
unweighted signal, S0. Parameter
precision was evaluated by bootstrapping residuals and
calculating 95% confidence interval (CI) limits.
Coefficients of variation (CoVs) were calculated to assess repeatability, and two-sample t-tests were used for statistical analyses.
Results and discussion
SEM characterisation
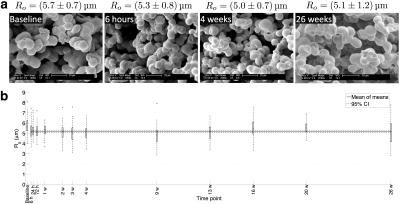
SEM images (Figure 1a) illustrate that the spheres tend to group together, indicating that the phantom's microstructure is not simply a packing of discrete idealised spheres. The CoV of mean post-immersion Ro values was 4.2%, suggesting that the phantom microstructure shows little variation over six months (Figure 1b). Averaging mean values at each post-immersion time point gave Ro = 5.2 ± 0.2 μm (mean ± standard deviation (SD)), indicating that the sphere size is appropriate for mimicking tumour cells8.
Phantom ADC
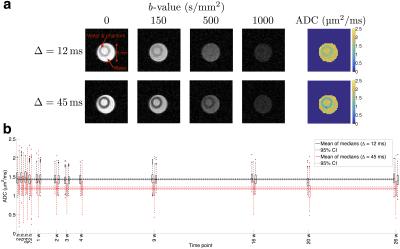
Figure 2a shows example DW images and ADC maps 6 hours post-immersion. ADC was consistently higher at the shorter diffusion time, with a mean ± SD of ROI median values of 1.44 ± 0.04 μm2/ms (CoV = 2.5%) and 1.20 ± 0.05 μm2/ms (CoV = 4.5%) for Δ = 12 and 45 ms (Figure 2b). Average median ADCs at the two diffusion times were significantly different in the phantom (P < 0.001), but not in free water (P = 0.85), providing evidence of hindered/restricted diffusion in the phantom, demonstrating that it more closely reflects diffusion in tissue than previous phantoms. Mean ± SD room temperature over all scanning sessions was 24 ± 1 °C (CoV = 4.2%).
Phantom microstructure
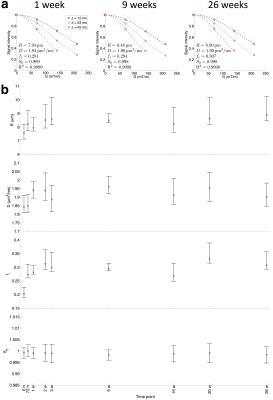
The model fits the data well, with a mean R2 of 0.9998 over all time points (Figure 3a). Parameter estimates are shown in Figure 3b, with CoVs given in Table 1. fi showed the greatest variability over time, D was underestimated relative to free water ADC (1.91 ± 0.04 μm2/ms vs. 2.02 ± 0.04 μm2/ms, P < 0.001), and R was consistently overestimated relative to Ro (8.3 ± 0.4 μm vs. 5.2 ± 0.2 μm, P < 0.001). These biases may be caused by noise, unmodelled effects such as extracellular time-dependent diffusion9 or permeability10, or sphere shrinkage during preparation for SEM. Ro and fi appear to be lower 6 hours post-immersion, possibly due to incomplete permeation of the water into the material at this time point.Conclusion
A novel biomimetic tumour tissue phantom has been developed and shown to be stable over six months. The phantom exhibits time-dependent diffusion, therefore more closely reflecting water diffusion in tissue than free diffusion phantoms. Microstructural estimates exhibited bias, potentially revealing limitations in the modelling. It is envisaged that such phantoms will aid further investigation of microstructural models relevant to characterising tumour tissue, and more generally will act as realistic test objects for comparing DW-MRI-derived biomarkers obtained from different scanners at different sites.Acknowledgements
This work was supported by CRUK [C8742/A18097]. This is a contribution from the Cancer Imaging Centre in Cambridge & Manchester, which is funded by the EPSRC and Cancer Research UK. This work used facilities funded by the BBSRC.References
1. O’Connor J, Aboagye EO, Adams JE, et al. Imaging biomarker roadmap for cancer studies. Nat Rev Clin Oncol. 2016;doi:10.1038/nrclinonc.2016.162.
2. Doblas S, Almeida GS, Blé FX, et al. Apparent diffusion coefficient is highly reproducible on preclinical imaging systems: evidence from a seven-center multivendor study. J Magn Reson Imaging. 2015;42:1759–1764.
3. Lavdas I, Behan KC, Papadaki A, McRobbie DW, Aboagye EO. A phantom for diffusion-weighted MRI (DW-MRI). J Magn Reson Imaging. 2013;38:173–179.
4. Panagiotaki E, Walker-Samuel S, Siow B, Johnson SP, Rajkumar V, Pedley RB, Lythgoe MF, Alexander DC. Noninvasive quantification of solid tumor microstructure using VERDICT MRI. Cancer Res. 2014;74:1902–1912.
5. Reynaud O, Winters KV, Hoang DM, Wadghiri YZ, Novikov DS, Kim SG. Pulsed and oscillating gradient MRI for assessment of cell size and extracellular space (POMACE) in mouse gliomas. NMR Biomed. 2016;doi:10.1002/nbm.3577.
6. McHugh DJ, Zhou F, Hubbard Cristinacce PL, Naish JH, Parker GJM. Estimating microstructural properties of a biomimetic tumour tissue phantom using diffusion-weighted MRI. In Proceedings of the 23rd Annual Meeting of ISMRM, Toronto, Canada, 2015. p. 156.
7. Zhang L, Huang J, Si T, Xu RX. Coaxial electrospray of microparticles and nanoparticles for biomedical applications. Expert Rev Med Devices. 2012;9:595–612.
8. Dolfi SC, Chan LL, Qiu J, Tedeschi PM, Bertino JR, Hirshfield KM, Oltvai ZN, Vazquez A. The metabolic demands of cancer cells are coupled to their size and protein synthesis rates. Cancer Metab. 2013;1:20.
9. De Santis S, Jones DK, Roebroeck A. Including diffusion time dependence in the extra-axonal space improves in vivo estimates of axonal diameter and density in human white matter. NeuroImage. 2016;130:91–103.
10. Li H, Jiang X, Xie J, Gore JC, Xu J. Impact of transcytolemmal water exchange on estimates of tissue microstructural properties derived from diffusion MRI. Magn Reson Med. 2016;doi:10.1002/mrm.26309.
Figures


