3452
Accuracy of ADC measurements with an Ultrashort Echo Time Diffusion Weighted stimulated echo 3D Cones sequence (DW-STEAM 3D Cones UTE)1Radiology and Nuclear Medicine, Erasmus Medical Center, Rotterdam, Netherlands, 2Medical Informatics and Radiology, Erasmus Medical Center, Rotterdam, Netherlands, 3Imaging Science and Technology, Delft University of Technology, Delft, Netherlands
Synopsis
Diffusion weighted STEAM with UTE readout is a promising acquisition method to measure diffusion in tissues with short T2 and T2*, such as tendons, ligaments and menisci. However, the accuracy of the ADC obtained with this method has not been studied before. Using experiments and Bloch simulations we show that the ADC can be biased, especially when a short TR is used, and that this bias depends on T1 and T2. Randomization of the diffusion gradient direction reduces the bias, providing clear suggestions to improve acquisition and/or post processing that reduces the ADC bias.
Introduction
Diffusion weighting imaging of tissues such as tendons, ligaments and menisci is challenging due their short T2 and T2* relaxation times. A diffusion weighted (DW) STEAM-based 3D-Cones UTE (DW-UTE) sequence has been proposed1 to combine the benefits of a stimulated echo acquisition (i.e. to minimize T2 decay for high b-values) with ultrashort UTE echo times (to minimize T2* decay during readout). However, the accuracy of the Apparent Diffusion Coefficient (ADC) with this sequence has not been investigated and may be affected by undesired coherence pathways. In this study, we investigate the accuracy of the calculated ADC in phantoms with different T1 and T2 relaxation times. Additionally, we propose a method that improves the accuracy of the ADC by randomly changing the direction of the diffusion weighting gradient in each TR.
Methods
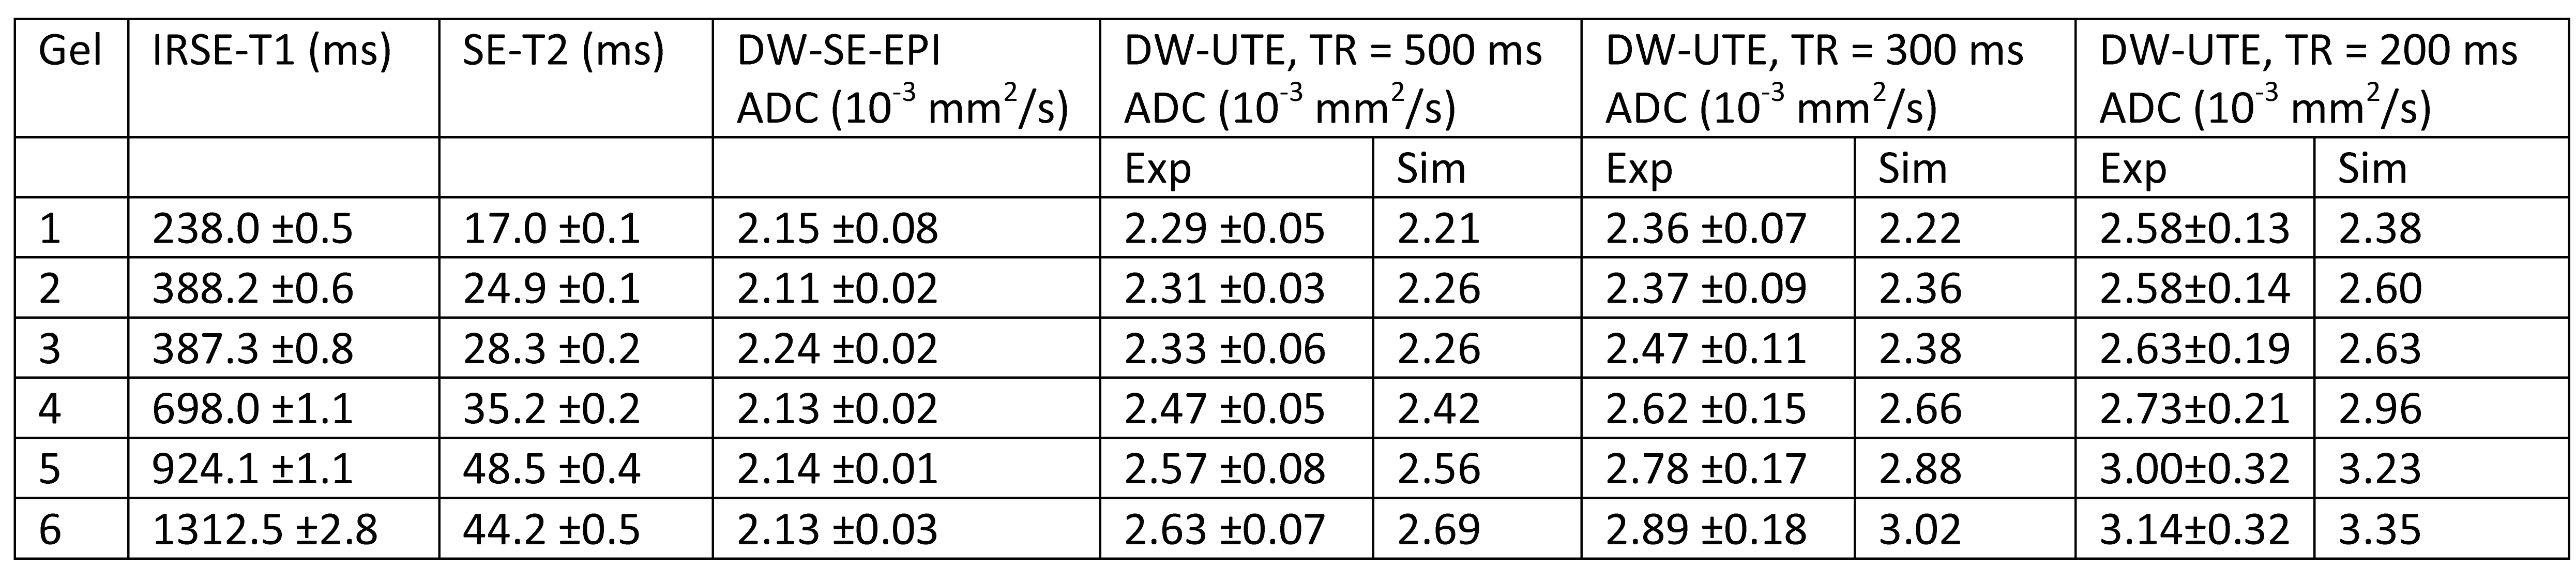
Experimental setup: To achieve a range of T1 and T2, six agar gels (2% agar) were prepared and doped with MnCl2 concentrations from 10 mg/L to 80 mg/L. The gels were contained in 50 ml falcon tubes and placed with the long axis parallel to the B0 field in a 8-ch T/R knee coil in a 3T whole body human MR scanner (Discovery MR750, GE Healthcare). The addition of agar and MnCl2 is not expected to influence the diffusion coefficient of water2, which was verified by measuring the ADC with conventional DW-SE-EPI.
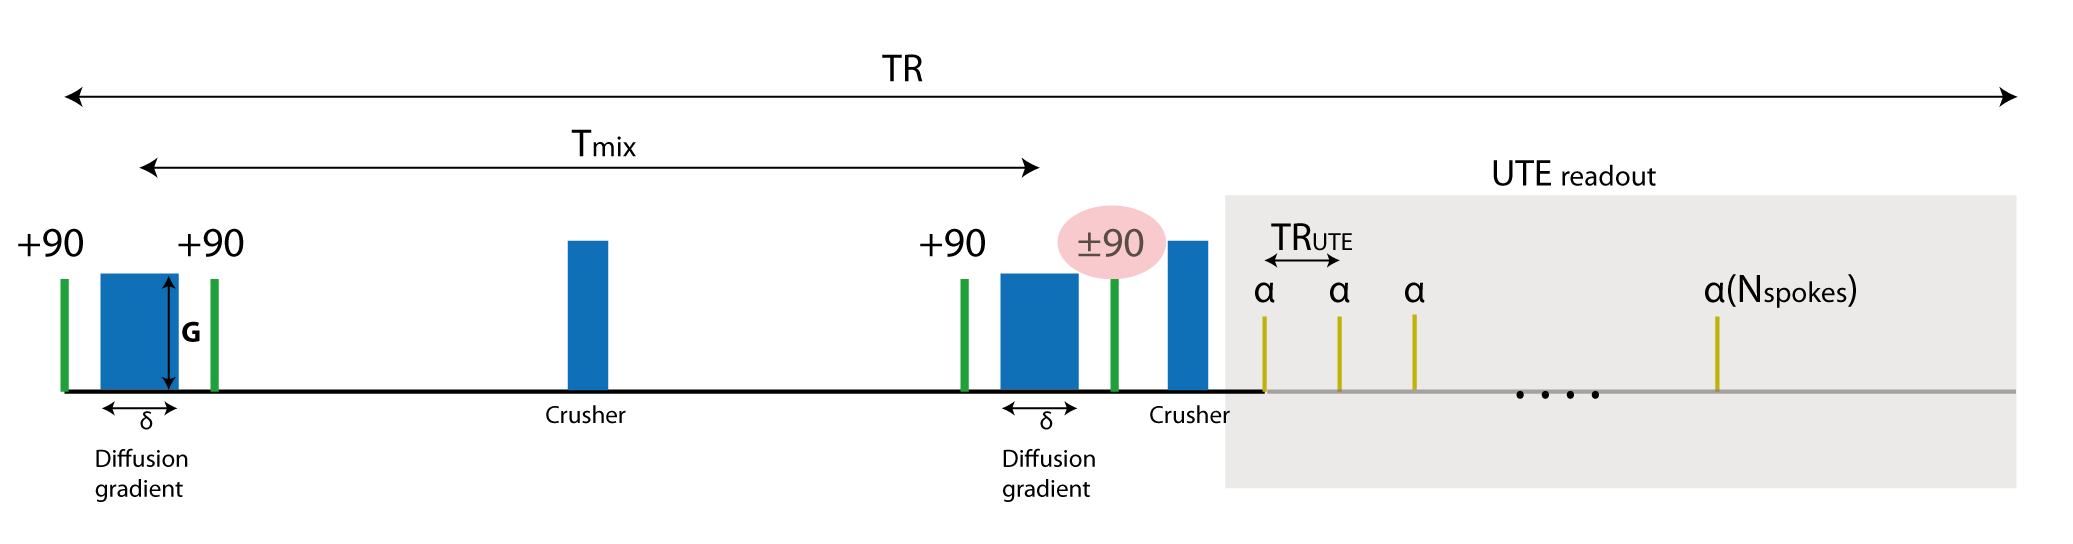
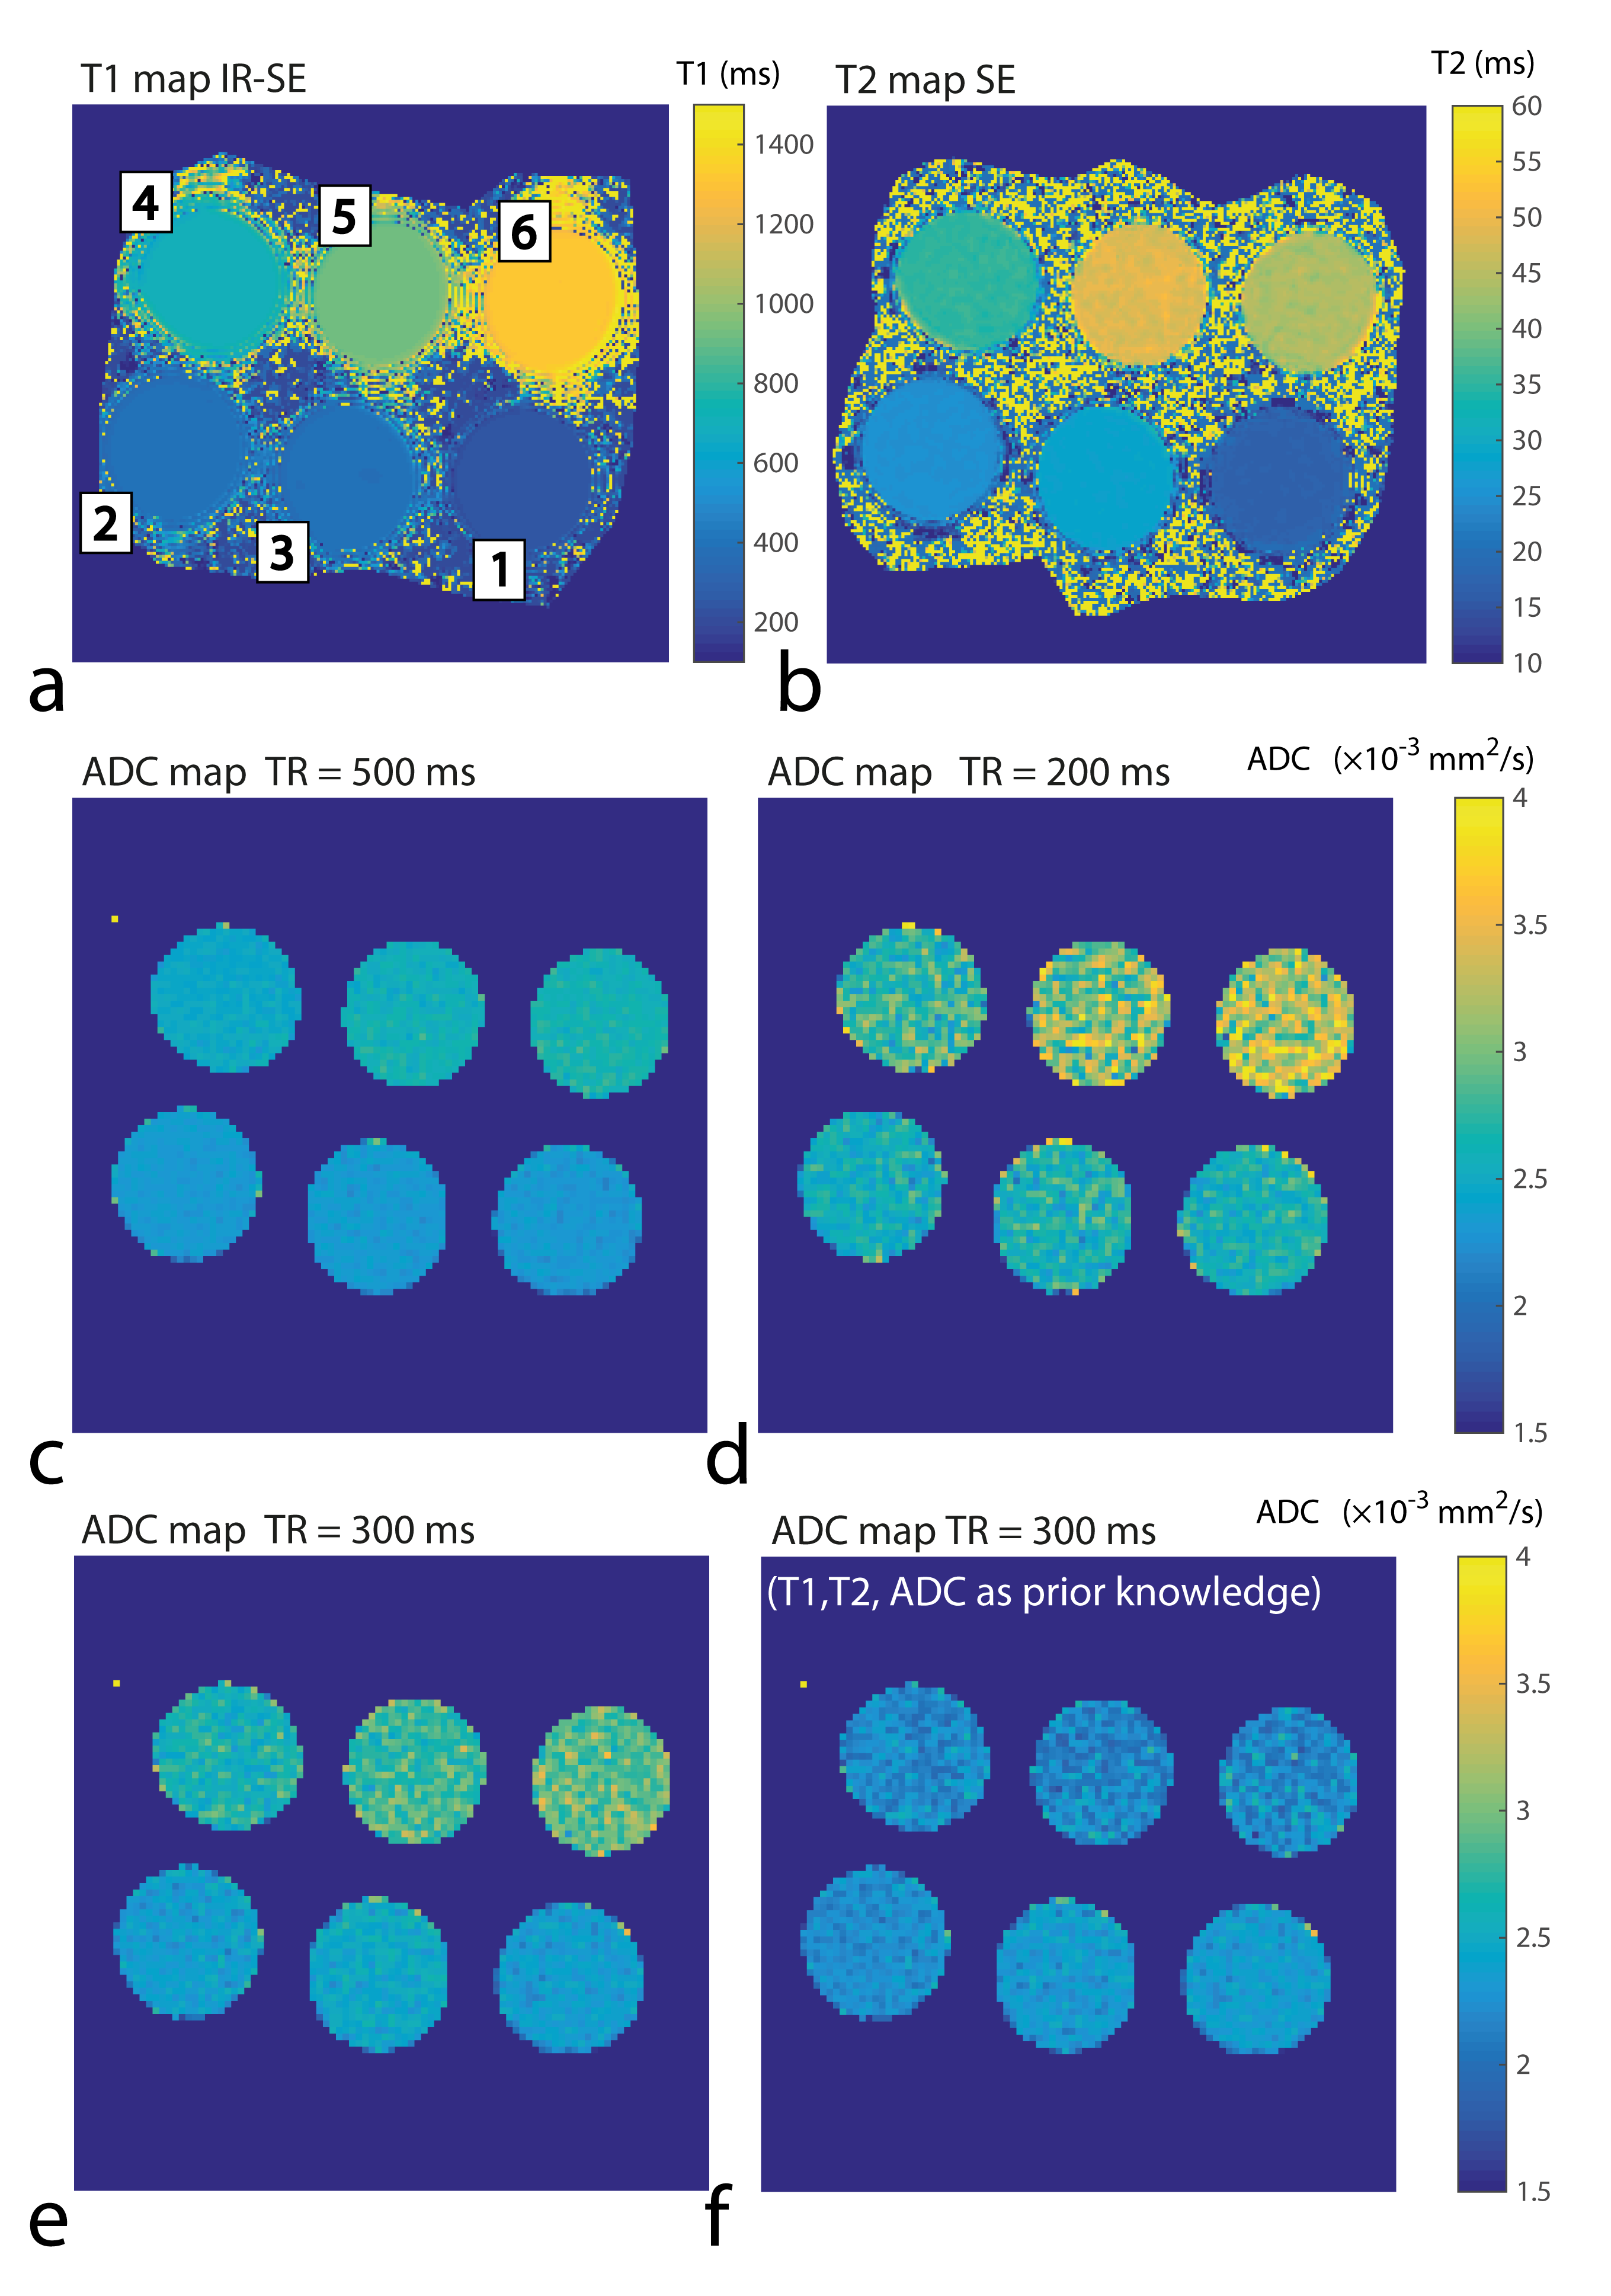
Acquisition and ADC calculation: The DW-UTE images were acquired axially. UTE-parameters (also see Fig. 1): TE=32 µs, FA=10°, 8 spokes per diffusion preparation, FOV = 15×15×19.2 cm, Matrix =128×128×64. Diffusion parameters: Tmix = 120 ms, gradient duration (δ)= 4ms in right-left-direction with amplitudes: 10, 20, 30, and 40 mT/m resulting in b-values 14, 57, 127, and 227 s/mm2. To correct T1 relaxation effects1, one acquisition was acquired with the last STEAM RF pulse as +90° (‘flip up’), and -90° (‘flip down’). Separate acquisitions were acquired with TR’s of 200, 300, and 500 ms. ADC was calculated by subtracting the two (flip up/down) complex images1, and subsequently fitting the magnitude as function of b-value with a mono-exponential function3. Additionally, acquisitions were conducted to measure the T1 and T2 times of the gels. (T1: IR-SE,TR=4s,TE=9ms,ST=10mm, 19×TI’s in range 50-3500 ms, T2: SE, TR=500ms, ST=5mm, 14×TE’s in range 5-120 ms).
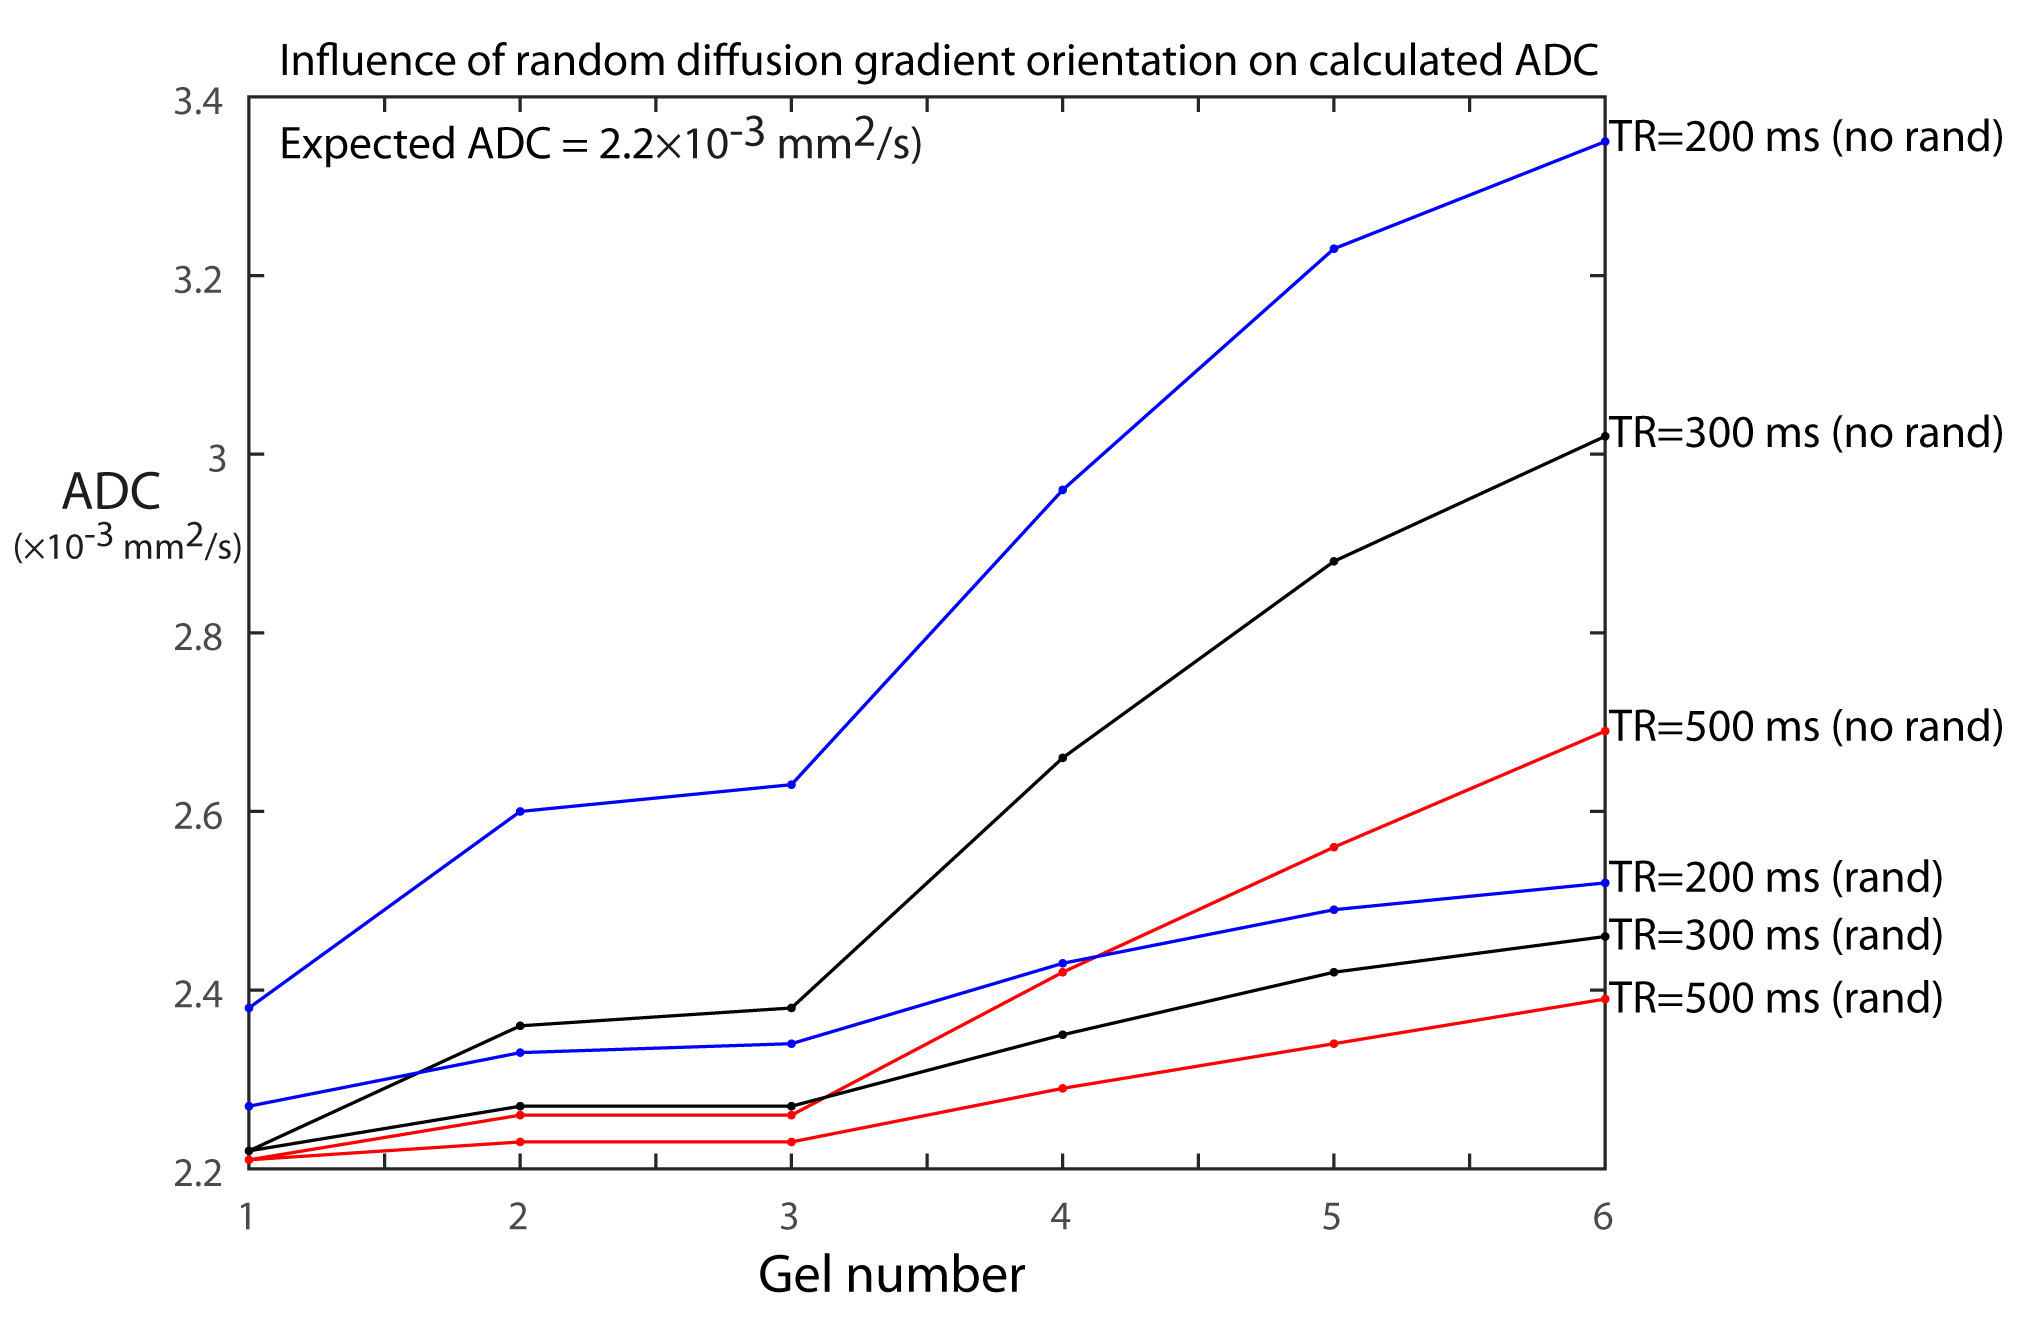
Evaluation and correction: To evaluate the influence of T1, T2, and TR on the calculated ADC, Bloch simulations of the DW-UTE acquisitions were performed. It included diffusion of an ensemble of spins with input parameters T1 and T2 as measured in the gels and ADC=2.20×10⁻³ mm2/s. The ADC was computed with the same procedure as for the experiments. To reduce signal formation from pathways longer than TR we simulated randomly alternating the orientation of diffusion gradients for each TR, averaging over 50 TRs.
Results
Fig. 2 a-b show the T1 and T2 maps and gel numbers. The mean T1 and T2 values are also given in Table 1. The mean ADC value of the six gels measured with DW-SE-EPI was (2.15±0.05)×10-3 mm2/s (Table 1). The ADC with DW-UTE was overestimated by up to 40% for acquisition with the shortest TR for the tubes with long T1 and T2 (fig. 2 c-e, Table 1). The ADC offsets corresponded closely to those obtained with the Bloch simulations (Table 1). Fig 2f illustrates an ADC map if the simulated offsets are accounted for. Fig. 3 shows the influence of using random diffusion gradient orientations on the calculated ADC. The random diffusion orientation scheme resulted in a more accurate ADC estimation. For example, for gel #4 (T1=698 ms, T2=35 ms) and TR=300 , the ADC bias reduced by 67% from 2.66×10⁻³ mm2/s to 2.35×10⁻³ mm2/sDiscussion
DW-UTE seems to enable accurate quantification of diffusion for tissues with short T2 and/or T2*, but undesired coherent pathways may introduce small errors. The influence of imaging parameters (such as TR) should be carefully considered based on the expected relaxation times of the imaging target. The Bloch simulations showed that introducing random diffusion gradient orientations improved ADC accuracy. However, a slight bias remained. Improvements in imaging acquisition (e.g. Implementing random diffusion orientations) and improving analysis (e.g. Improving upon the mono-exponential signal model by deriving an analytical expression that includes the relevant signal pathways) is under investigation. Future work will investigate dependence of SNR, influence of short T2* (<1 ms) and feasibility of in-vivo imaging.Acknowledgements
No acknowledgement found.References
1. M. Carl et al. Proc. ISMRM 2016, abstract number 3021
2. I. Lavdas et al. A phantom for diffusion-weighted MRI (DW-MRI). J. Magn Reson Imag. 2013;38(1):173-9
3. D.H.J. Poot et al. Detecting statistically significant differences in quantitative MRI experiments, applied to diffusion tensor imaging. IEEE Transactions on Medical Imaging, 2015;34(5):1164-1176
Figures